Correlation Correlation 1 Discuss conceptual differences between ANOVA

Correlation

Correlation 1. Discuss conceptual differences between ANOVA and correlation / regression. 2. Define and explain the correlation coefficient and the coefficient of determination. 3. Discuss the relationship between correlation and causation.

So far…. • We have examined IVs that are categorical: Conservative Liberal Water Condition Sweet Condition Disgust Condition • And DVs that are continuous/dimensional: Moral Judgement Disgust Rating

Now we’ll deal with… • IVs that are continuous/dimensional : Number of close friends • And DVs that are continuous/dimensional: Level of stress
 Comparison Correlation")
CI vs. ANOVA vs. Regression CI Estimation What is μ? ANOVA (t-test) Comparison Correlation / Regression Are there group differences? Prediction and Estimation Does knowing X help me predict Y?

CORRELATION: statistical technique used to describe the relationship between two interval or ratio variables 5 A 4 Popularity Person A B C D E F G H I J K L M N Relational Aggression (x) Popularity (y) 5 4 5 5 3 5 4 4 4 5 4 2 4 3 3 4 3 2 2 1 1 1 3 1 2 3 2 1 0 0 1 2 3 Relational Aggression 4 5

Correlation Coefficient: Direction of Relationship Relational Aggression and Popularity Relational Aggression and Liked 5 5 4 3 Liked Popularity 4 2 3 2 1 1 0 0 0 1 2 3 Relational Aggression 4 Positive correlation: two variables tend to change in the same direction • As relational aggression increases, popularity increases 5 0 1 2 3 4 Relational Aggression Negative correlation: two variables tend to change in opposite directions • As relational aggression increases, being liked decreases 5
 of Relationship r = +1 r = -1 Perfect positive")
Correlation Coefficient: strength (consistency) of Relationship r = +1 r = -1 Perfect positive relationship r = positive # less than 1 Perfect negative relationship no relationship r=0 negative relationship r = negative # greater than -1

Correlation Coefficient • Pearson’s product moment coefficient of correlation : a measure of the strength of the linear relationship between two variables. –r – Pearson’s r – correlation coefficient

What does it mean to covary? • To vary together – High scores on one variable tend to be paired with high scores on another

What does it mean to covary? • To vary together – High scores on one variable tend to be paired with high scores on another OR – High scores on one variable tend to be paired with low scores on another

Low covariance Close to zero covariation: Exam scores – High scores are equally likely to be paired with high scores as with low score height

strong +1 perfect positive relationship Weak 0 no relationship Strong Interpretation of Pearson’s r -1 perfect negative relationship

Calculating r SP = sum of the products of the deviations (measure of covariation of x and y) Long-way: SP = ∑(x-Mx)(Y-My) 1. ) Find the X deviation and the Y deviation for each individual 2. ) Calculate the product of the deviations for each individual 3. ) Add the products up

Calculating r SP = sum of the products of the deviations (measure of covariation of x and y) Short-cut way (easier!):

Relation between SS and SP Long-way Short-cut
")
Calculating r Denominator: SS = sum of squares (you know this!)

Cyber-bullying and in-person bullying Children can begin using social media by 5 th grade. Traditionally, bullying has been done on the playground but now researchers fear that bullying is being done online as well. To understand whether this is the case we conduct a study using a sample of four 5 th graders. We observe their Facebook pages and record the number of times they are bullied over the course of two weeks (X). We also observe them everyday on the playground and record the number of times they are bullied in-person (Y). What is the correlation between cyberbullying and in-person bullying? Participant Veronica Heather D Heather M Heather C Scores Cyber (X) In-person (Y) 1 3 2 6 4 4 5 7 Mean = 3 Mean = 5
 In-person (Y) Products (X)(Y) 1 2 4 5 ∑x = 12")
Scores Cyber (X) In-person (Y) Products (X)(Y) 1 2 4 5 ∑x = 12 3 12 16 35 ∑(xy) = 66 3 6 4 7 ∑y = 20 Short-cut:
 In-person (Y) (X)(Y) 1 2 4 5 ∑x = 12")
Scores Products Cyber (X) In-person (Y) (X)(Y) 1 2 4 5 ∑x = 12 3 6 4 7 ∑y = 20 Sum of squares x 2 y 2 3 1 12 4 16 16 35 25 ∑(xy) = 66 ∑x 2 = 46 9 36 16 49 ∑y 2 = 110
 In-person (Y) (X)(Y) x 2 y 2")
Scores Products Sum of squares Cyber (X) In-person (Y) (X)(Y) x 2 y 2 1 3 3 1 9 2 6 12 4 36 4 4 16 16 16 5 7 35 25 49 ∑x = 12 ∑y = 20 ∑(xy) = 66 ∑x 2 = 46 ∑y 2 = 110 SSx = 10 SSy = 10 In-person bullying SP = 6 8 7 6 5 4 3 2 1 0 0 2 4 cyber-bullying 6

Anxiety and Mistakes Does anxiety increase mistakes? To understand this I assessed 5 psychology thesis students and asked them to rate their anxiety before their final thesis defense on a scale of 0 (no anxiety)to 10 (complete terror!). I then recorded the number of mistakes they made when presenting their data to the defense committee. Calculate the pearson correlation between these variables and make a scatterplot. Scores Anxiety (X) Mistakes (Y) Tiffany Sophia Nicky Lorna Gloria 0 10 4 8 8 ∑x = Products (X)(Y) Sum of squares x 2 y 2 2 6 2 4 6 ∑y = ∑(xy) = ∑x 2 = ∑y 2 =

Correlation of Anxiety and Mistakes 7 6 Mistakes 5 4 3 2 1 0 0 1 2 3 4 5 6 Anxiety 7 8 9 10 There is a positive correlation between anxiety and mistakes ( r =. 874), as anxiety level increases so does the number of mistakes.

Correlation does not imply causation!!!

Stress and Health There is a strong negative correlation between stress and health. Generally, the more stressed a person is, the worse their health is. But, does that mean that stress causes poor health? NO! YES! Stress only influences the likelihood of engaging in healthy habits. People under a great deal of stress are less healthy BECAUSE they tend to engage in more unhealthy behaviors. Stress hormones cause your body to consistently be engaged in ‘Fight or Flight’ mode. This causes your heart, lungs, etc. to work too hard, which can compromise the immune system and, over the long haul lead to heart disease, and so forth.
DOES NOT PROOVE")
Other fun facts about correlations Knowledge of Stats 1. (one more time…)DOES NOT PROOVE CAUSEEFFECT RELATIONSHIPS! 2. The value of r can be affected by the range of scores in the data Week in Semester
DOES NOT PROOVE CAUSEEFFECT RELATIONSHIPS! 2.")
Other fun facts about correlations 1. (one more time…)DOES NOT PROOVE CAUSEEFFECT RELATIONSHIPS! 2. The value of r can be affected by the range of scores in the data 3. Extreme data points (outliers) can dramatically affect a correlation value

Influence of outlier on correlation
DOES NOT PROOVE CAUSEEFFECT RELATIONSHIPS! 2.")
Other fun facts about correlations 1. (one more time…)DOES NOT PROOVE CAUSEEFFECT RELATIONSHIPS! 2. The value of r can be affected by the range of scores in the data 3. Extreme data points (outliers) can dramatically affect a correlation value 4. The r value DOES NOT correspond to how accurate predictions are (r=. 50, does NOT mean 50% accuracy of prediction)

Coefficient of Determination r 2 : measures the proportion of variability in one variable that can be determined from the relationship with the other variable. Calculating it when we know r is rather obvious…. Anxiety and Mistakes: r =. 88 r 2 =. 77 Interpretation: Anxiety before thesis defense explains 77% of the variability in mistakes
 Mistakes (Y) 0 10 4 8 8 2")
In other words…. Scores Anxiety (X) Mistakes (Y) 0 10 4 8 8 2 6 2 4 6 Why are the mistakes scores different (variable) from one another? r 2 suggests that 77% of the variability in the scores is due to how anxious the person was • Which means 23% is due to other factors and random chance.

Coefficient of Determination as a measure of effect size r 2 =. 01 small effect (small correlation =. 1) r 2 =. 09 medium effect (medium correlation =. 3) r 2 =. 25 large effect (large correlation =. 5)

Hypothesis Tests with the Pearson Correlation Is there a correlation between X and Y in the population? …in other words does the r value we obtained: 1. Reflect a true meaningful relationship? 2. Random chance relationship?

Hypothesis Tests with the Pearson Correlation Step 1: define null and alternative Ho: ρ = 0 (there is no correlation in the population) Ha: ρ 0 (there is a correlation in the population) Step 2: set alpha Step 3: calculate r Step 4: Look up critical value for pearson correlation df = n-2 Step 5: if │r│ is greater than or equal to critical value: reject the null Step 6: interpret results

Hypothesis Tests: Anxiety and Mistakes Step 1: Ho: ρ = 0 Ha: ρ 0 Step 2: set alpha α=. 05 Step 3: calculate r r =. 875 Step 4: Look up critical value for pearson correlation df = n-2 = 5 -2 = 3

Critical value for r

Hypothesis Tests: Anxiety and Step 1: Ho: p = 0 ; Ha: p Mistakes 0 Step 2: set alpha: α=. 05 Step 3: calculate r =. 875 Step 4: Look up critical value for pearson correlation df = 5 -2 = 3 critical value=. 878 Step 5: │. 875│ < critical value. 878; fail to reject the null Step 6: there is not a significant correlation between anxiety and the number of mistakes made during the defense r=. 875, p >. 05 OR we do not have enough evidence to conclude there is a real relationship between anxiety and mistakes in the population.
")
Hypothesis test: Cyber-bulling and in-person bullying Are they significantly correlated? r =. 60 (n=4) Set alpha at. 05

What can we use correlations for? • Prediction – If you know someone’s score on one variable can you predict their score on another? • Validity – How do scores on a new test relate to scores on a well established test? • Reliability – Are measurements consistent across time? • Theory Verification – If theory suggests two variables should be related, they should be correlated in expected direction

Using RC Is there a correlation between weekend bed time and veggie eating? Step 1: Step 2: Step 3: Step 4: Step 5: Step 6: Ho: ρ=0 Ha: ρ≠ 0 Make a scatter plot Set alpha (α=. 05) Calculate robs (and p-value) in RC. Compare p-value to alpha. Report and INTERPRET the results.

Scatterplot: Veggies WE Bedtime

RC Correlation Output: Veggies WE bedtime Pearson's product-moment correlation data: Veggies and Week. End t = 0. 63678, df = 28, p-value = 0. 5294 alternative hypothesis: true correlation is not equal to 0 95 percent confidence interval: -0. 2516219 0. 4599492 sample estimates: cor 0. 1194782 A correlation analysis revealed that there was no significant relationship between weekend bed time and vegetable consumption, r(28) =. 12, p >. 50.

Using RC – Multiple correlations Is there a correlation between bed times (weekend and weekday) and both fruit and veggie consumption? Step 1: Step 2: Step 3: Step 4: Step 5: Step 6: Ho: ρ=0 Ha: ρ≠ 0 Make a scatter plot(s); optional Set alpha (α=. 05) Calculate robs (and p-value) in RC. Compare robs to critical value (table). Report and INTERPRET the results.

Correlation Matrix Fruit 1. 0000 Veggies 0. 2630 Week. Day 0. 0044 Week. End 0. 1355 Veggies Week. Day 0. 2630 0. 0044 1. 0000 -0. 0493 1. 0000 0. 1195 0. 4434 Week. End 0. 1355 0. 1195 0. 4434 1. 0000

Correlation Matrix Fruit 1. 0000 Veggies 0. 2630 Week. Day 0. 0044 Week. End 0. 1355 Veggies Week. Day 0. 2630 0. 0044 1. 0000 -0. 0493 1. 0000 0. 1195 0. 4434 Week. End 0. 1355 0. 1195 0. 4434 1. 0000 You can ignore the diagonal. Often see dashes in place of the 1. 000

Correlation Matrix Fruit -Veggies 0. 2630 Week. Day 0. 0044 Week. End 0. 1355 Veggies Week. Day 0. 2630 0. 0044 --0. 0493 -0. 1195 0. 4434 Week. End 0. 1355 0. 1195 0. 4434 --

Correlation Matrix Fruit Veggies Week. Day Week. End Fruit -- Veggies Week. Day 0. 2630 0. 0044 --0. 0493 -- Still one problem. . . Which correlations are significant? Solution… r-table. Rcrit = 0. 361 Week. End 0. 1355 0. 1195 0. 4434 --

Correlation Matrix Fruit Veggies Week. Day Week. End Fruit -- Veggies Week. Day 0. 2630 0. 0044 --0. 0493 -- Week. End 0. 1355 0. 1195 0. 4434* -- Note: * p <. 05 A correlation analysis revealed that there was a significant relationship between weekend and week day bed times, r(28) =. 44, p <. 05. No other relationships yielded significant correlations.

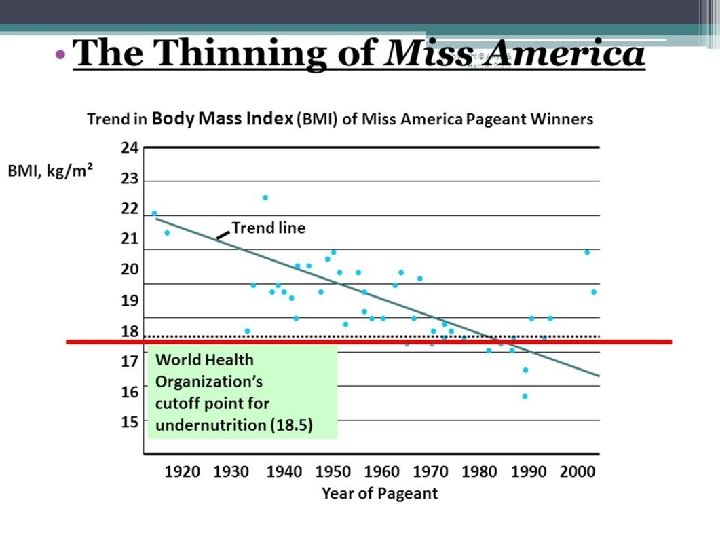
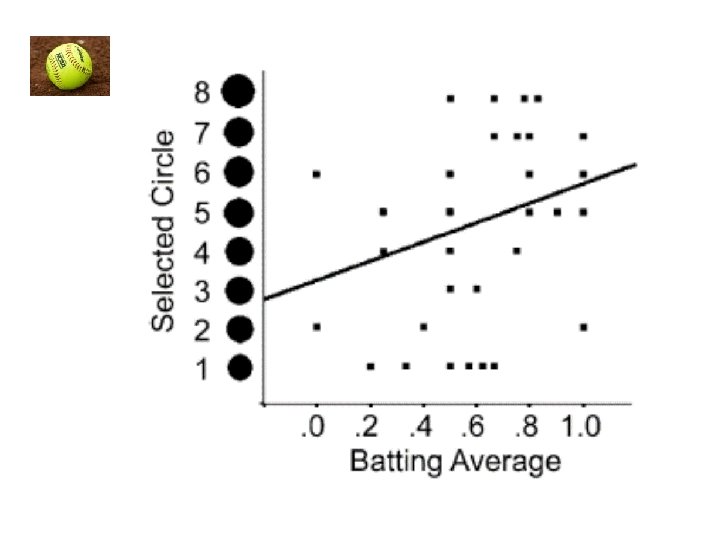
Real Research Examples
- Slides: 52