Correlation Chapter 15 Correlation Sir Francis Galton Uncle


")

- Slides: 43
Correlation Chapter 15
Correlation • Sir Francis Galton (Uncle to Darwin – Development of behavioral statistics – Father of Eugenics – Science of fingerprints as unique – Retrospective IQ of 200 – Drove himself mad just to prove you could do it – Invented the pocket
Defining Correlation • Co-variation or co-relation between two variables • These variables change together • Usually scale (interval or ratio) variables • http: //www. youtube. com/watch? v=ahp 7 Qhb. B 8 G 4
Correlation Coefficient • A statistic that quantifies a relation between two variables • Can be either positive or negative • Falls between -1. 00 and 1. 00 • The value of the number (not the sign) indicates the strength of the relation
Linear Correlation Linear relationships Y Curvilinear relationships Y X Y X n. Slide from: Statistics for Managers Using Microsoft® Excel 4 th Edition, 2004 Prentice-Hall X
Linear Correlation Strong relationships Y Weak relationships Y X Y X n. Slide from: Statistics for Managers Using Microsoft® Excel 4 th Edition, 2004 Prentice-Hall X
Linear Correlation No relationship Y X n. Slide from: Statistics for Managers Using Microsoft® Excel 4 th Edition, 2004 Prentice-Hall
Correlation 10
Positive Correlation Association between variables such that high scores on one variable tend to have high scores on the other variable A direct relation between the variables
Negative Correlation Association between variables such that high scores on one variable tend to have low scores on the other variable An inverse relation between the variables
A Perfect Positive Correlation
A Perfect Negative Correlation
What is “Linear”? n Remember this: n Y=m. X+B? m B
What’s Slope? A slope of 2 means that every 1 -unit change in X yields a 2 -unit change in Y.
Simple linear regression P=. 22; not significant The linear regression model: intercept Love of Math = 5 +. 01*math SAT score slope
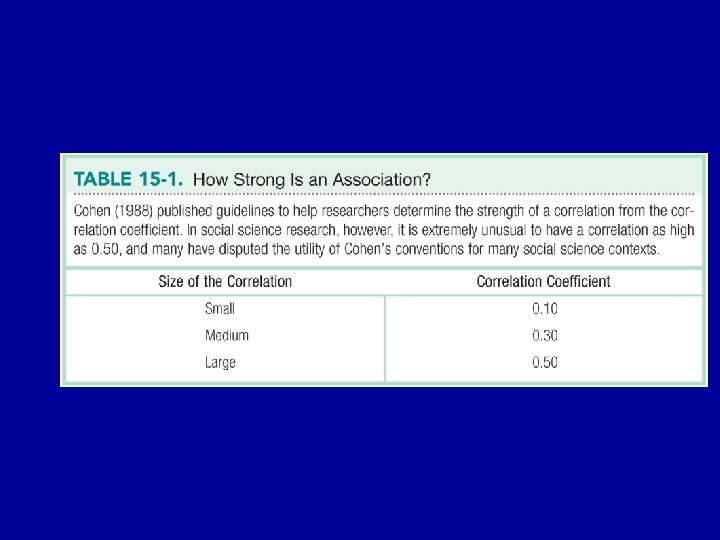
Check Your Learning • Which is stronger? – A correlation of 0. 25 or -0. 74?
Misleading Correlations • Something to think about – There is a 0. 91 correlation between ice cream consumption and drowning deaths. • Does eating ice cream cause drowning? • Does grief cause us to eat more ice cream?
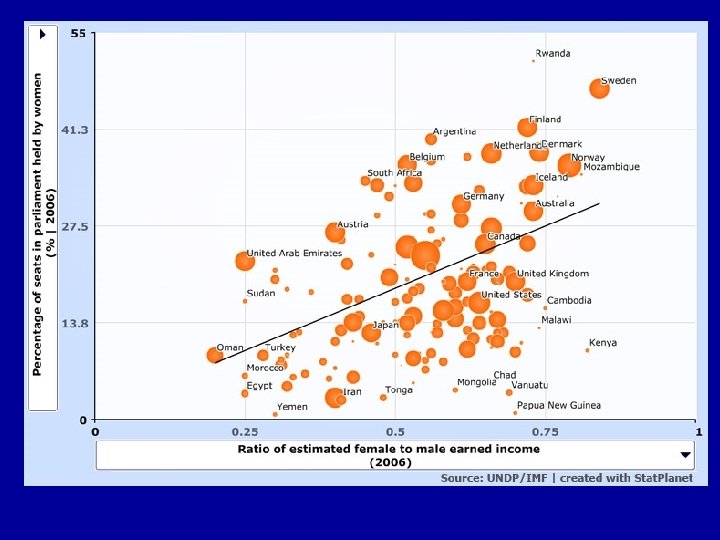
Correlation is NOT causation -e. g. , armspan and height 21
The Limitations of Correlation • Correlation is not causation. – Invisible third variables Three Possible Causal Explanations for a Correlation
The Limitations of Correlation, cont. > Restricted Range. A sample of boys and girls who performed in the top 2% to 3% on standardized tests - a much smaller range than the full population from which the researchers could have drawn their sample.
> Restricted Range, cont. If we only look at the older students between the ages of 22 and 25, the strength of this correlation is now far smaller, just 0. 05.
The Limitations of Correlation, cont. > The effect of an outlier. One individual who both studies and uses her cell phone more than any other individual in the sample changed the correlation from 0. 14, a negative correlation, to 0. 39, a much stronger and positive correlation!
The Pearson Correlation Coefficient • A statistic that quantifies a linear relation between two scale variables. • Symbolized by the italic letter r when it is a statistic based on sample data. • Symbolized by the italic letter p “rho” when it is a population parameter.
• Pearson correlation coefficient –r – Linear relationship
Correlation Hypothesis Testing • Step 1. Identify the population, distribution, and assumptions • Step 2. State the null and research hypotheses. • Step 3. Determine the characteristics of the comparison distribution. • Step 4. Determine the critical values. • Step 5. Calculate the test statistic • Step 6. Make a decision.
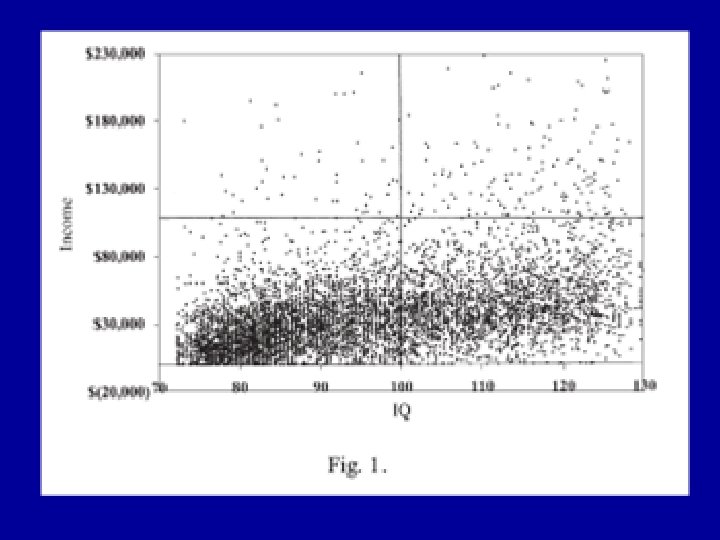
Always Start with a Scatterplot
Correlation and Psychometrics • Psychometrics is used in the development of tests and measures. • Psychometricians use correlation to examine two important aspects of the development of measures—reliability and validity.
Reliability • A reliable measure is one that is consistent. • One particular type of reliability is test–retest reliability. • Correlation is used by psychometricians to help professional sports teams assess the reliability of athletic performance, such as how fast a pitcher can throw a baseball.
Validity • A valid measure is one that measures what it was designed or intended to measure. • Correlation is used to calculate validity, often by correlating a new measure with existing measures known to assess the variable of interest.
• Correlation can also be used to establish the validity of a personality test. • Establishing validity is usually much more difficult than establishing reliability. • Most magazines and newspapers never examine the psychometric properties of the quizzes that they publish.
Partial Correlation • A technique that quantifies the degree of association between two variables after statistically removing the association of a third variable with both of those two variables. • Allows us to quantify the relation between two variables, controlling for the correlation of each of these variables with a third related variable.
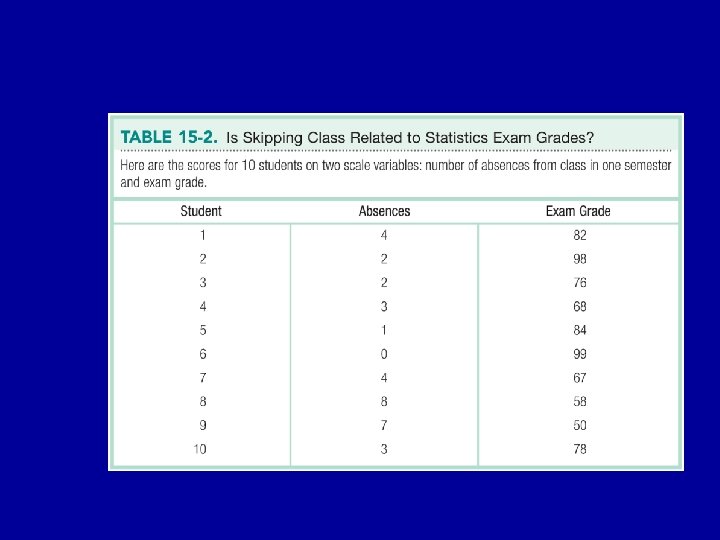
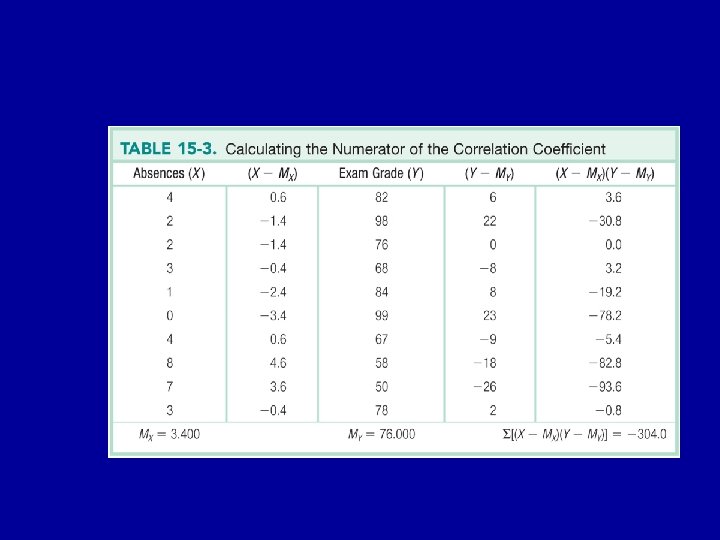
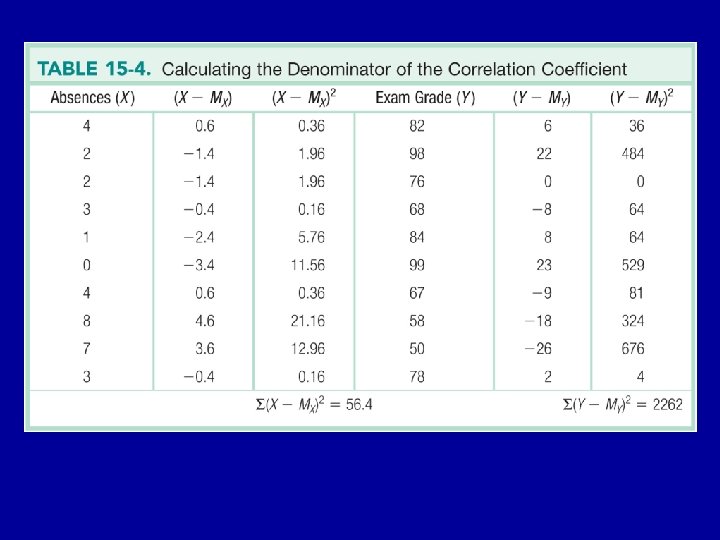
> We can assess the correlation between number of absences and exam grade, over and above the correlation of percentage of completed homework assignments with these variables.
Partial Correlation • A partial correlation is the relationship between two variables after removing the overlap with a third variable completely from both variables. In the diagram below, this would be the relationship between male literacy (Y) and percentage living in cities (X 2), after removing the influence of gross domestic product (X 1) on both literacy and percentage living in cities In the calculation of the partial correlation coefficient r. YX 2. X 1, the area of interest is section a, and the effects removed are those in b, c, and d; partial correlation is the relationship of X 2 and Y after the influence of X 1 is completely removed from both variables. When only the effect of X 1 on X 2 is removed, this is called a part correlation; part correlation first removes from X 2 all variance which may be accounted for by X 1 (sections c and b), then correlates the remaining unique component of the X 2 with the dependent variable, Y
Statistical Control • Using Multivariate Analysis
Statistical Control • Using Multivariate Analysis
Simpson’s Paradox • In each of these examples, the bivariate analysis (cross-tabulation or correlation) gave misleading results • Introducing another variable gave a better understanding of the data – It even reversed the initial conclusions
Another Example • A study of graduates’ salaries showed negative association between economists’ starting salary and the level of the degree – i. e. Ph. Ds earned less than Masters degree holders, who in turn earned less than those with just a Bachelor’s degree – Why? • The data was split into three employment sectors – Teaching, government and private industry – Each sector showed a positive relationship – Employer type was confounded with degree level