Correlation Analysis Topic Spearmans coefficient of Correlation For
 - 2")


- Slides: 13
Correlation Analysis Topic: Spearman’s coefficient of Correlation For nd B. Com (Hons) - 2 Semester
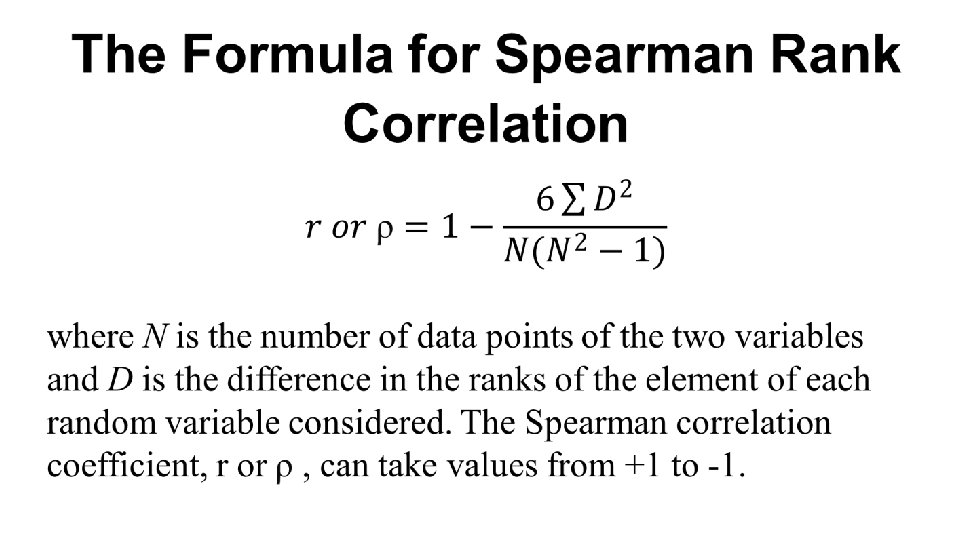
The Spearman’s Correlation Coefficient is represented by ρ or by r, it is a nonparametric measure of the strength and direction of the association that exists between two ranked variables. It determines the degree to which a relationship is monotonic, i. e. , whethere is a monotonic component of the association between two continuous or ordered variables.
Spearman Ranking of the Data We must rank the data under consideration before proceeding with the Spearman’s Rank Correlation evaluation. This is necessary because we need to compare whether on increasing one variable, the other follows a monotonic relation (increases or decreases regularly) with respect to it or not.
In order to understand systematically the practical aspect, we categorize as: Categories When ranks are given When ranks are not given Distinct Ranks Repeated Ranks
• A ‘r’ of +1 indicates a perfect association of ranks. A ‘r’ of zero indicates no association between ranks and ‘r’ of -1 indicates a perfect negative association of ranks. The closer ρ is to zero, the weaker the association between the ranks.
When Ranks are given In a Dance Competition, two judges gave the following Ranks to 10 participants : Example : Ist Judge 3 4 7 8 1 5 2 9 10 6 IInd Judge 1 3 10 9 4 6 5 2 8 7 Ist Judge R 1 IInd Judge R 2 D = R 1 – R 2 D 2 3 1 +2 4 4 3 +1 1 7 10 -3 9 8 9 -1 1 1 4 -3 9 5 6 -1 1 2 5 -3 9 9 2 +7 49 10 8 +2 4 6 7 +1 1 N = 10 N =10
When Ranks are not given Discrete Ranks : When there is no repetition in the values of two variables, the assigned rank will be different for every variable. At every level in this method, we need to compare the values of the two variables. The method of ranking assigns such ‘levels’ to each value in the dataset so that we can easily compare it. Assign number 1 to n (the number of data points) corresponding to the variable values in the order highest to lowest or lowest to highest in both series.
Example : Calculate Spearman’s Rank Coefficient of correlation between two variables X and Y : X 24 30 50 25 27 45 42 40 19 37 Y 30 40 42 36 38 28 44 52 80 35 X Y R 1 R 2 D = R 1 – R 2 D 2 24 30 9 8 +1 1 30 40 6 4 +2 4 50 42 1 3 -2 4 25 36 8 6 +2 4 27 38 7 5 +2 4 45 28 2 9 -7 49 42 44 3 2 +1 1 40 52 4 1 +3 9 19 80 10 10 0 0 37 35 5 7 -2 4
In the next part, we will discuss about finding the Spearman’s coefficient of Correlation when the ranks are not given as well as repeated.
Thank you