
Corporate Finance Lecture 7 Dr Solt Eszter BME

Corporate Finance Lecture 7 Dr. Solt Eszter BME 2018
Growth stocks and income stocks • Investors buy growth stocks primarily in the expectation of capital gains, and they are interested in the future growth of earnings rather than in next year’s dividends. • They buy income stocks principally for the cash dividends.
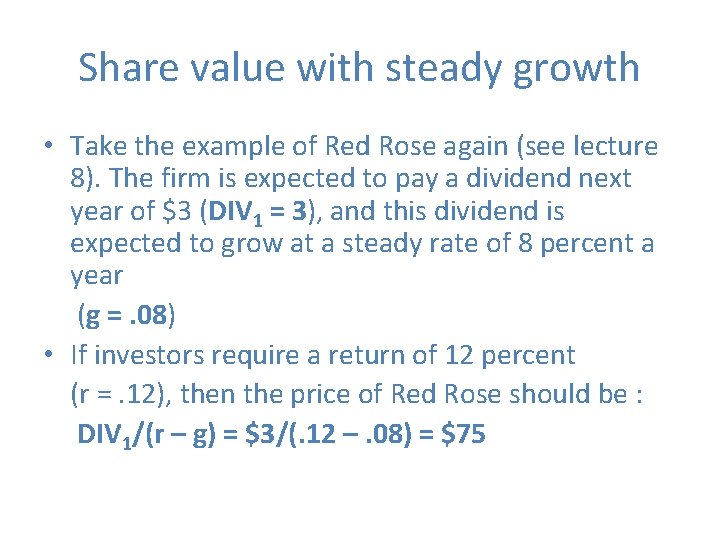
Share value with steady growth • Take the example of Red Rose again (see lecture 8). The firm is expected to pay a dividend next year of $3 (DIV 1 = 3), and this dividend is expected to grow at a steady rate of 8 percent a year (g =. 08) • If investors require a return of 12 percent (r =. 12), then the price of Red Rose should be : DIV 1/(r – g) = $3/(. 12 –. 08) = $75
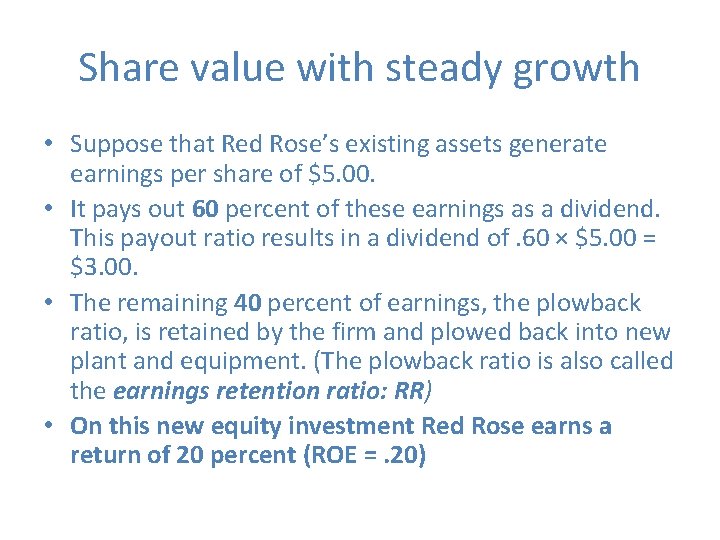
Share value with steady growth • Suppose that Red Rose’s existing assets generate earnings per share of $5. 00. • It pays out 60 percent of these earnings as a dividend. This payout ratio results in a dividend of. 60 × $5. 00 = $3. 00. • The remaining 40 percent of earnings, the plowback ratio, is retained by the firm and plowed back into new plant and equipment. (The plowback ratio is also called the earnings retention ratio: RR) • On this new equity investment Red Rose earns a return of 20 percent (ROE =. 20)
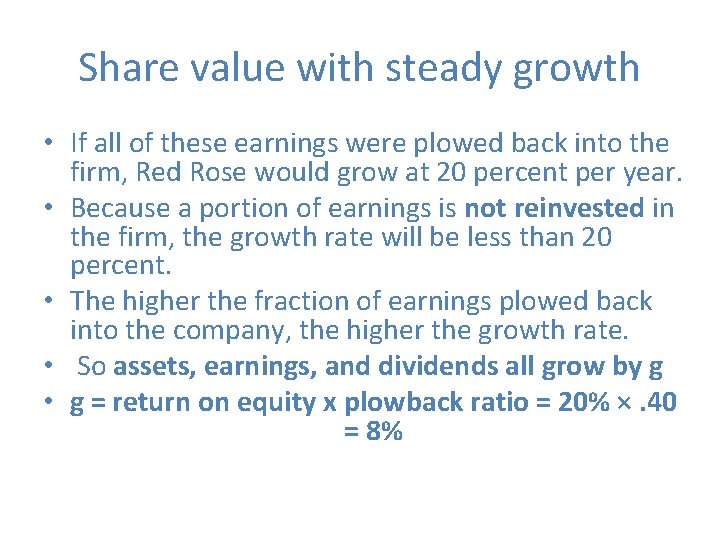
Share value with steady growth • If all of these earnings were plowed back into the firm, Red Rose would grow at 20 percent per year. • Because a portion of earnings is not reinvested in the firm, the growth rate will be less than 20 percent. • The higher the fraction of earnings plowed back into the company, the higher the growth rate. • So assets, earnings, and dividends all grow by g • g = return on equity x plowback ratio = 20% ×. 40 = 8%

Share value without steady growth • What if Red Rose did not plow back any of its earnings into new plant and equipment? • In that case it would pay out all its earnings as dividends but would forgo any growth in dividends. • So we could recalculate value with DIV 1 = $5. 00 and g = 0: • P 0 = $5. 00 /. 12 – 0 = $41. 67

The present value of growth opportunities PVGO • Thus if Red Rose did not reinvest any of its earnings, its stock price would not be $75 but $41. 67 • The $41. 67 represents the value of earnings from the assets that are already in place • The rest of the stock price ($75 – $41. 67 = $33. 33) is the net present value of the future investments that Red Rose is expected to make: • the present value of the superior returns on assets to be acquired in the future. It is called the present value of growth opportunities, or PVGO.
Definitions • Sustainable growth rate (g): Steady rate at which firm can grow; return on equity × plowback ratio • Present value of growth opportunities(PVGO): Net present value of a firm’s future investments • Payout ratio: Fraction of earnings paid out as dividends • Plowback ratio: Fraction of earnings retained by the firm
Example 1 • Suppose that instead of plowing money back into lucrative ventures, Red Rose’s management is investing at an expected return on equity of 10 percent, which is below the return of 12 percent that investors could expect to get from comparable securities. • a. Find the sustainable growth rate of dividends and earnings in these circumstances. Assume a 60 percent payout ratio. • b. Find the new value of its investment opportunities (PVGO). Explain why this value is negative despite the positive growth rate of earnings and dividends. • c. If you were a corporate raider, would Red Rose be a good candidate for an attempted takeover?

What is a „Corporate Raider”? • A corporate raider is an investor who buys a large number of shares in a corporation whose assets appear to be undervalued. • The large share purchase would give the • corporate raider significant voting rights, which could then be used to push changes in the company's leadership and management. • This would increase share value and thus generate a massive return for the raider. • Famous corporate raider Carl Ichan used tactics such as taking a company private, compelling a spin-off, calling for an entirely new board of directors or calling for a divestiture of assets to make a fortune with his hostile takeovers.
Solution a. The sustainable growth rate is: g = return on equity (ROE) × plowback ratio = 10% ×. 40 = 4% b. First value the company. At a 60 percent payout ratio, DIV 1 = $3. 00 as before. Using the constant-growth model: P 0 = $3. 00/(. 12 –. 04) = $37. 50 which is $4. 17 per share less than the company’s no-growth value of $41. 67. In this example Red Rose is throwing away $4. 17 of potential value by investing in projects with unattractive rates of return.
Solution c. Sure. A raider could take over the company and generate a profit of $4. 17 per share just by halting all investments offering less than the 12 percent rate of return demanded by investors. This assumes the raider could buy the shares for $37. 50.
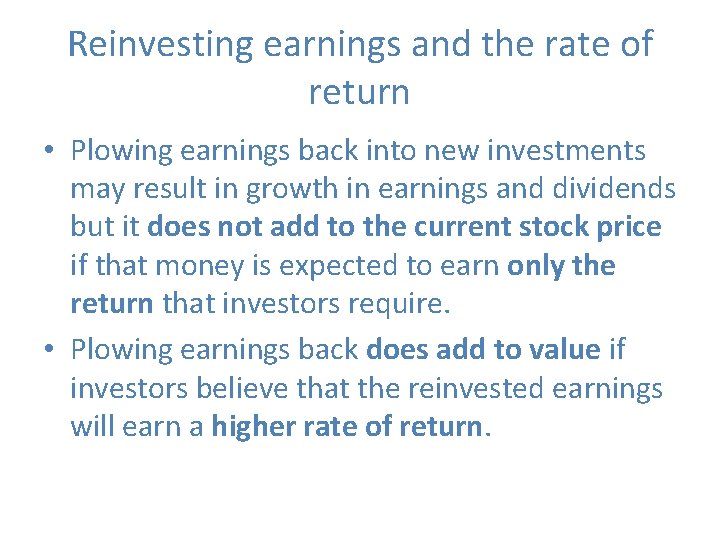
Reinvesting earnings and the rate of return • Plowing earnings back into new investments may result in growth in earnings and dividends but it does not add to the current stock price if that money is expected to earn only the return that investors require. • Plowing earnings back does add to value if investors believe that the reinvested earnings will earn a higher rate of return.
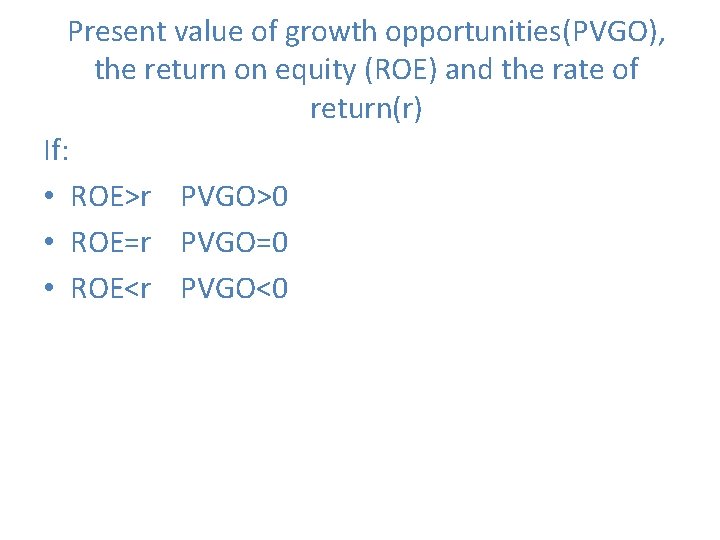
Present value of growth opportunities(PVGO), the return on equity (ROE) and the rate of return(r) If: • ROE>r PVGO>0 • ROE=r PVGO=0 • ROE<r PVGO<0
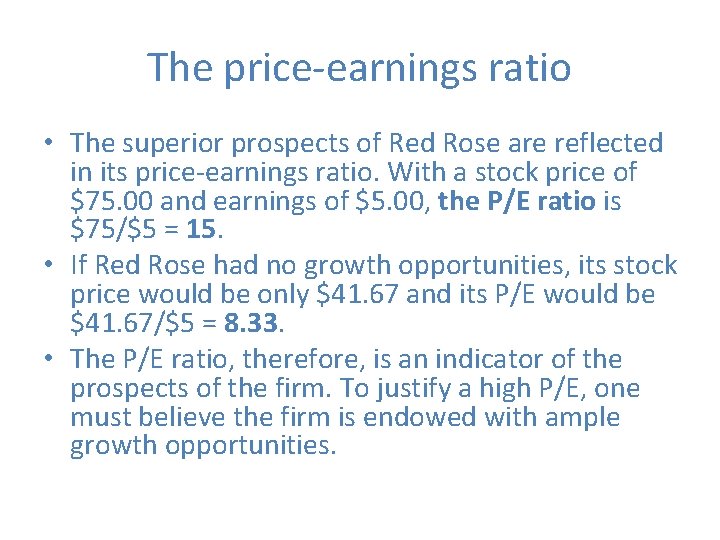
The price-earnings ratio • The superior prospects of Red Rose are reflected in its price-earnings ratio. With a stock price of $75. 00 and earnings of $5. 00, the P/E ratio is $75/$5 = 15. • If Red Rose had no growth opportunities, its stock price would be only $41. 67 and its P/E would be $41. 67/$5 = 8. 33. • The P/E ratio, therefore, is an indicator of the prospects of the firm. To justify a high P/E, one must believe the firm is endowed with ample growth opportunities.
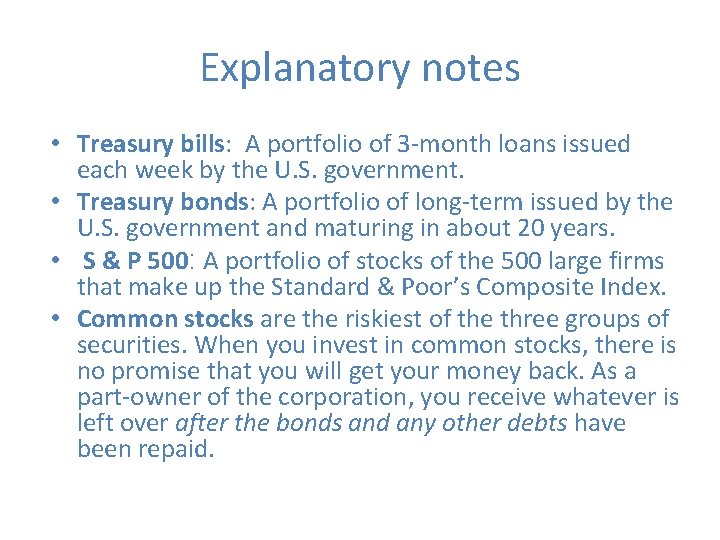
Explanatory notes • Treasury bills: A portfolio of 3 -month loans issued each week by the U. S. government. • Treasury bonds: A portfolio of long-term issued by the U. S. government and maturing in about 20 years. • S & P 500: A portfolio of stocks of the 500 large firms that make up the Standard & Poor’s Composite Index. • Common stocks are the riskiest of the three groups of securities. When you invest in common stocks, there is no promise that you will get your money back. As a part-owner of the corporation, you receive whatever is left over after the bonds and any other debts have been repaid.
What do earnings mean? Some accounting problems • We should be careful when we look at price-earnings ratios. “Expected future earnings” refers to expected cash flow less the true depreciation in the value of the assets. • “True” depreciation is the amount that the firm must reinvest simply to offset any deterioration in its assets. • In practice, however, when accountants calculate the earnings that are reported in the company’s income statement, they do not attempt to measure true depreciation. • Instead, reported earnings are based on generally accepted accounting principles, which use rough-and-ready rules of thumb to calculate the depreciation of the company’ assets.
What do earnings mean? Some accounting problems • A switch in the depreciation method can dramatically change reported earnings without affecting the true profitability of the firm • Other accounting choices that can affect reported earnings are: • the method for valuing inventories • the decision to treat research and development as a current expense rather than as an investment • the way that tax liabilities are reported
Appreciation in stock prices in the late 1990 s, a “new paradigm” • Is there a possibility that part of the (worrying) run-up of stock prices relative to earnings in the 1990 s may be due to other accounting problems? • The distortions are created in income statements when investments in research, development, software, and training are treated as expenses which reduce reported earnings, rather than as investments in intangible assets, which would then be gradually depreciated over time.
What is „Risk”? • Risk involves the chance an investment's actual return will differ from the expected return. • Risk includes the possibility of losing some or all of the original investment. • Different versions of risk are usually measured by calculating the standard deviation of the historical returns or average returns of a specific investment.
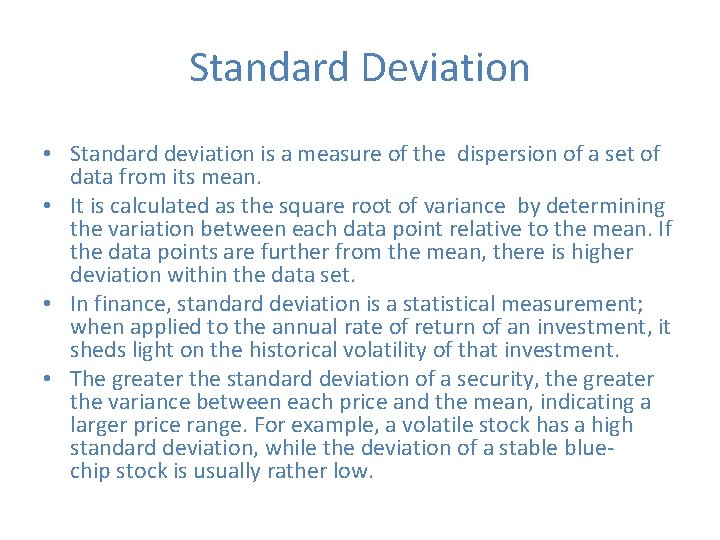
Standard Deviation • Standard deviation is a measure of the dispersion of a set of data from its mean. • It is calculated as the square root of variance by determining the variation between each data point relative to the mean. If the data points are further from the mean, there is higher deviation within the data set. • In finance, standard deviation is a statistical measurement; when applied to the annual rate of return of an investment, it sheds light on the historical volatility of that investment. • The greater the standard deviation of a security, the greater the variance between each price and the mean, indicating a larger price range. For example, a volatile stock has a high standard deviation, while the deviation of a stable bluechip stock is usually rather low.
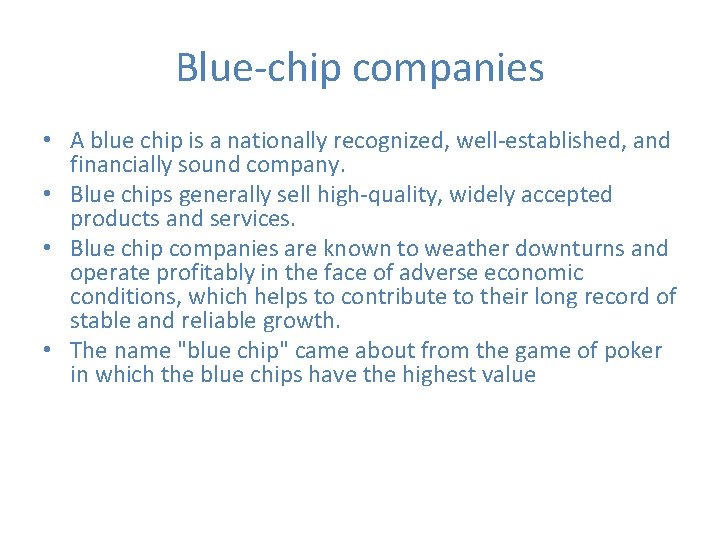
Blue-chip companies • A blue chip is a nationally recognized, well-established, and financially sound company. • Blue chips generally sell high-quality, widely accepted products and services. • Blue chip companies are known to weather downturns and operate profitably in the face of adverse economic conditions, which helps to contribute to their long record of stable and reliable growth. • The name "blue chip" came about from the game of poker in which the blue chips have the highest value
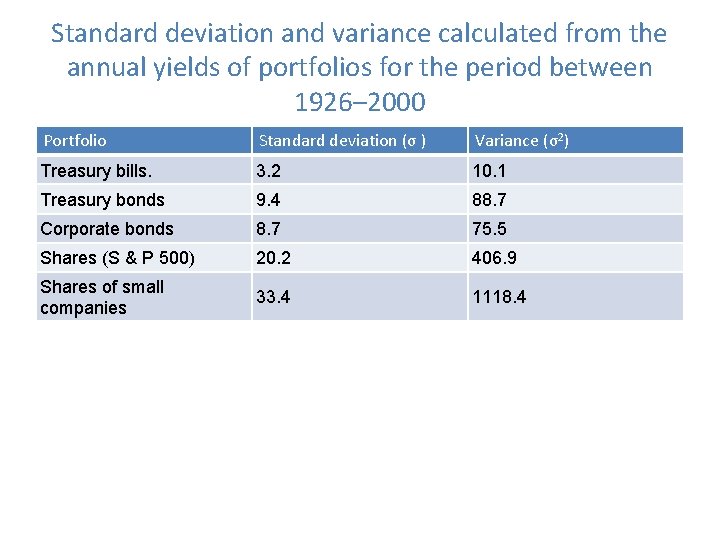
Standard deviation and variance calculated from the annual yields of portfolios for the period between 1926– 2000 Portfolio Standard deviation (σ ) Variance (σ2) Treasury bills. 3. 2 10. 1 Treasury bonds 9. 4 88. 7 Corporate bonds 8. 7 75. 5 Shares (S & P 500) 20. 2 406. 9 Shares of small companies 33. 4 1118. 4
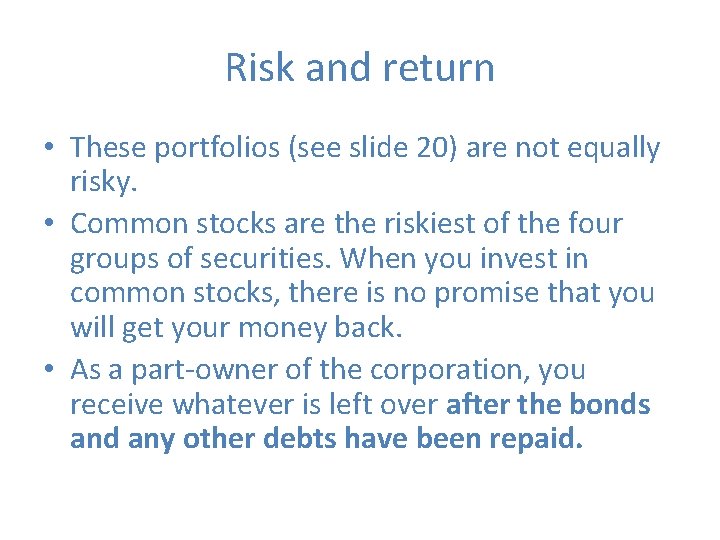
Risk and return • These portfolios (see slide 20) are not equally risky. • Common stocks are the riskiest of the four groups of securities. When you invest in common stocks, there is no promise that you will get your money back. • As a part-owner of the corporation, you receive whatever is left over after the bonds and any other debts have been repaid.
The historical record Risk and return • The historical record shows that investors have received a risk premium for holding risky assets. • Average returns on high-risk assets are higher than those on low-risk assets. • The safest investment, Treasury bills, had the lowest rates of return—they averaged 3. 8 percent a year. • Long-term government bonds gave slightly higher returns than Treasury bills : 5. 7 percent a year. • This difference is called the maturity premium. (1. 9%)
The historical record Risk and return • Investors who accepted the risk of common stocks received a return of 13. 2 percent a year. • It means an extra return of 9. 4 percent a year over the return on Treasury bills (3. 8%) on average. • This compensation for taking on the risk of common stock ownership is known as the market risk premium.
Definitions • Maturity premium: Extra average return from investing in long- versus short-term Treasury securities. • Risk premium: Expected return in excess of risk-free return as compensation for risk. • The expected return on an investment provides compensation to investors both for waiting (the time value of money) and for worrying (the risk of the particular asset).
Measuring the risk • Investment risk depends on the dispersion or spread of possible outcomes • The financial manager needs a numerical measure of dispersion. The standard measures are variance and standard deviation • Variance: Average value of squared deviations from mean. A measure of volatility • Standard deviation: Square root of variance. Another measure of volatility
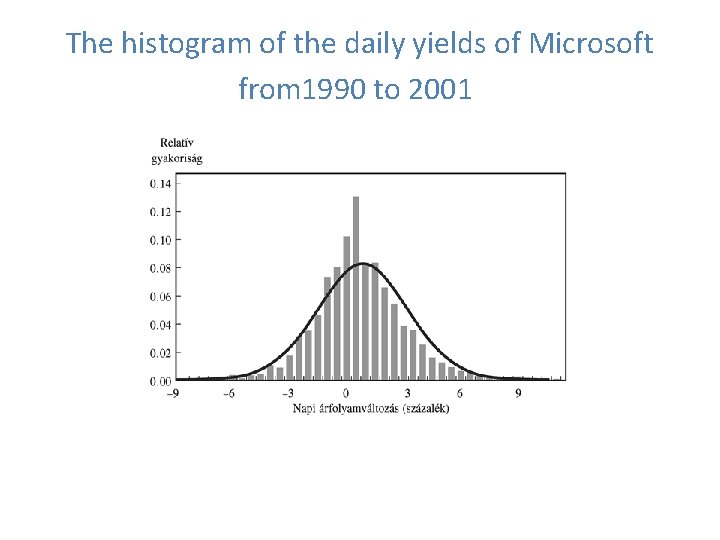
The histogram of the daily yields of Microsoft from 1990 to 2001
Risk and Diversification • Diversification: Strategy designed to reduce risk by spreading the portfolio across many investments. • Portfolio diversification works because prices of different stocks do not move exactly together. • Statisticians make the same point when they say that stock price changes are less than perfectly correlated • Diversification works best when the returns are negatively correlated. When one business does well, the other does badly. Unfortunately, in practice, stocks that are negatively correlated are rare.
- Slides: 30