
CoronaNorco Unified School District Accountability 2017 Target Setting
Corona-Norco Unified School District Accountability: 2017 Target Setting Presentation Riverside County Regional Assessment Meeting December 8, 2017
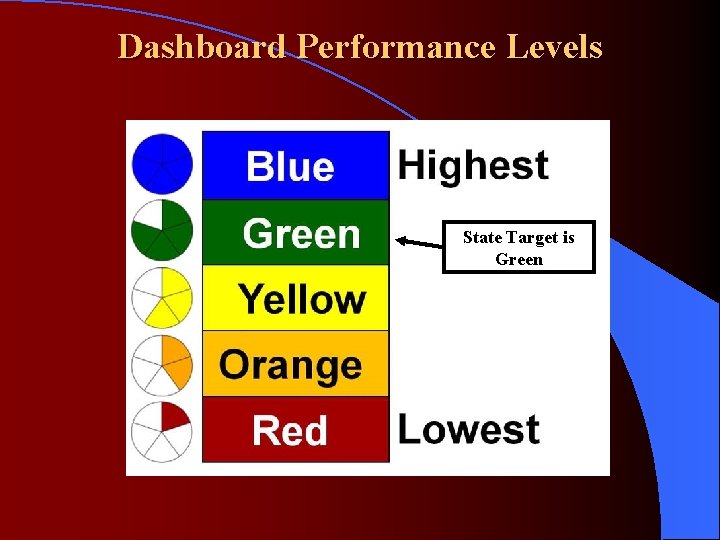
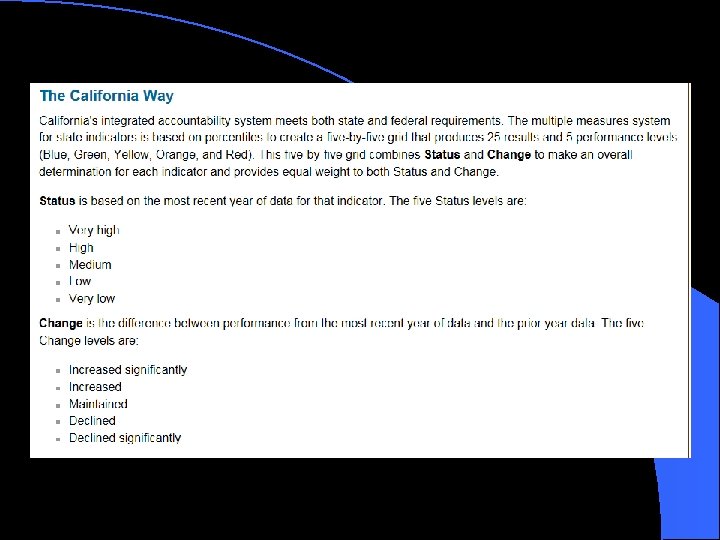
Dashboard Performance Levels State Target is Green
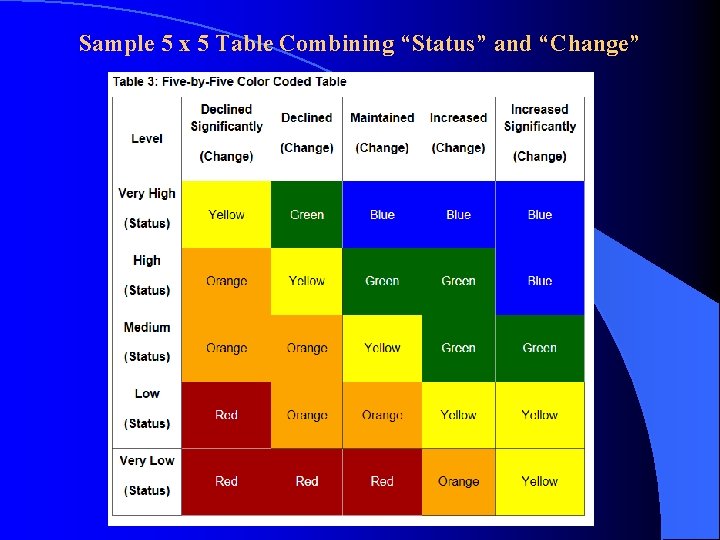
Sample 5 x 5 Table Combining “Status” and “Change”
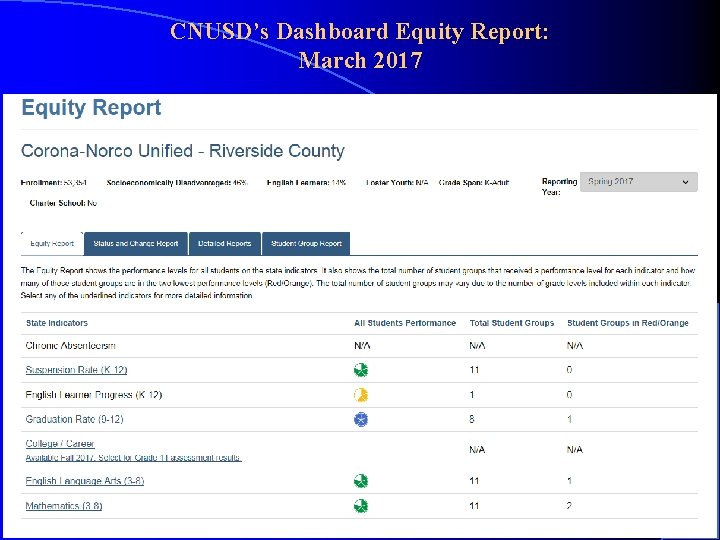
CNUSD’s Dashboard Equity Report: March 2017
Setting Annual Targets
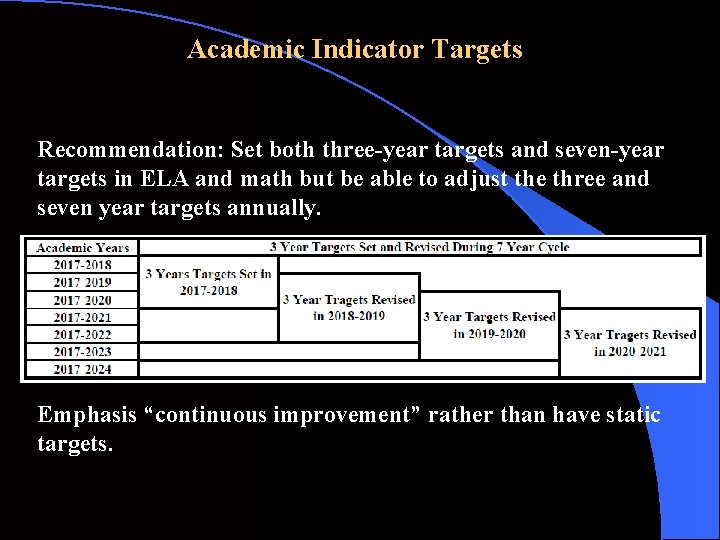
Academic Indicator Targets Recommendation: Set both three-year targets and seven-year targets in ELA and math but be able to adjust the three and seven year targets annually. Emphasis “continuous improvement” rather than have static targets.
Academic Indicator: English-Language Arts/Literacy (Based Upon SBAC ELA Results) Step 1: Locate where your school is on the estimated December 2017 Dashboard ELA 5 x 5 matrix.
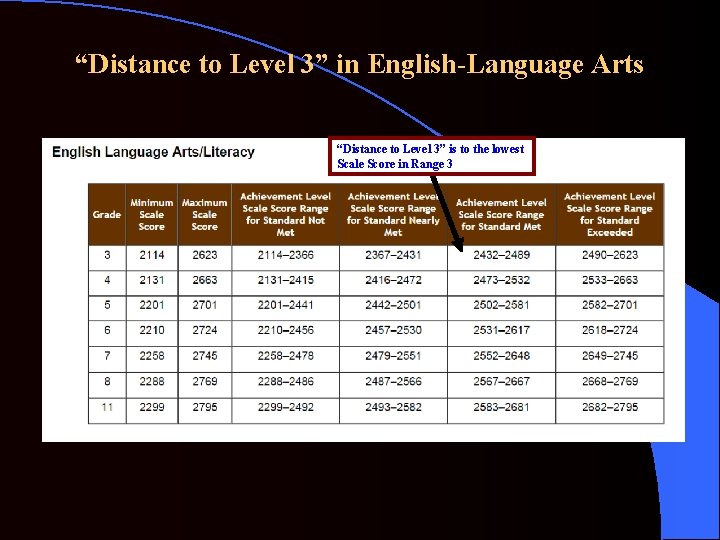
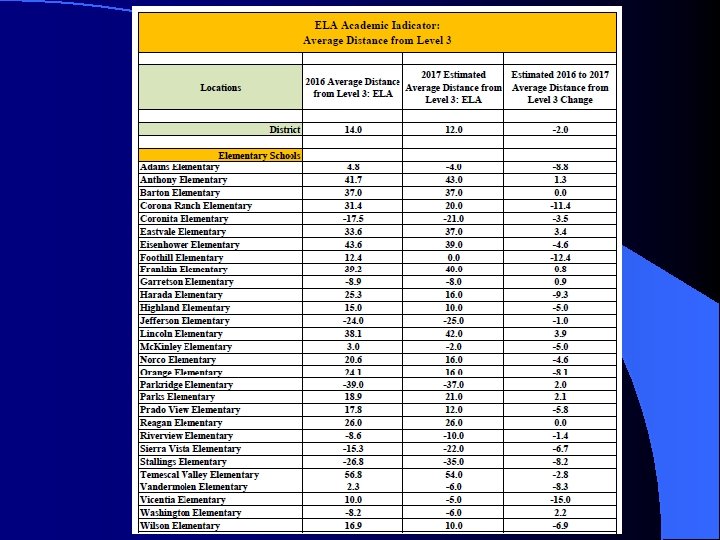
“Distance to Level 3” in English-Language Arts “Distance to Level 3” is to the lowest Scale Score in Range 3
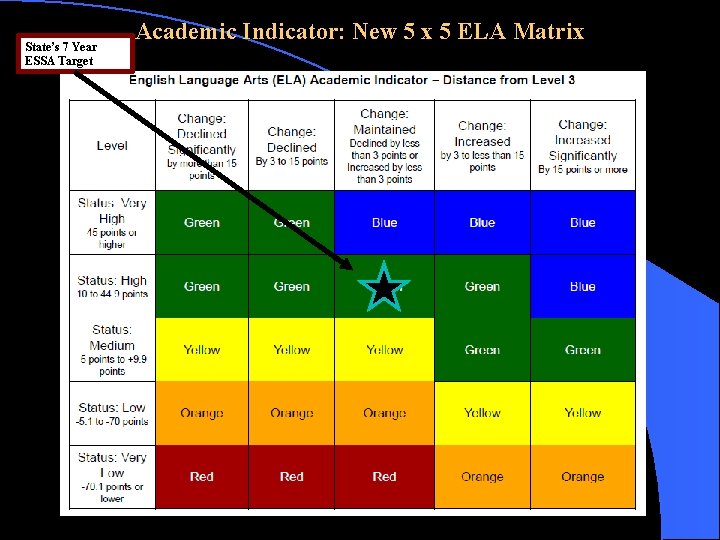
State’s 7 Year ESSA Target Academic Indicator: New 5 x 5 ELA Matrix
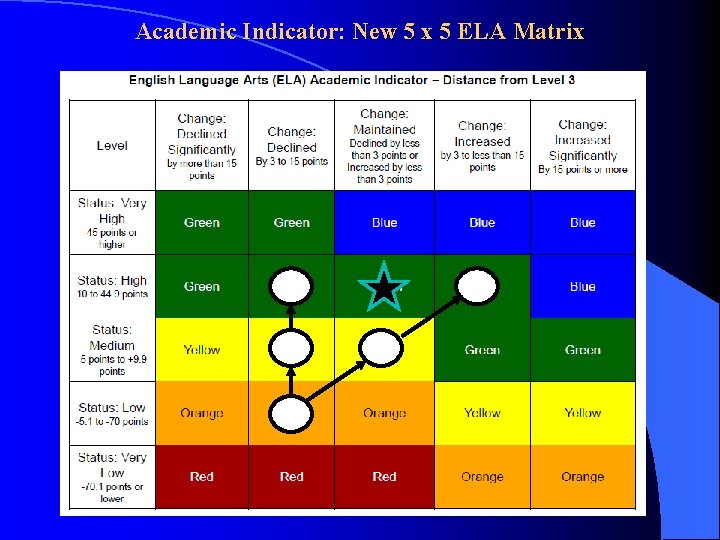
Academic Indicator: New 5 x 5 ELA Matrix
Academic Indicator: English-Language Arts/Literacy (Based Upon SBAC ELA Results) Step 2: Using your school’s location on the ELA 5 x 5 matrix, set a three year target and a seven year target. For example, if your school is in a “yellow” cell now, you may select a three year target of achieving well enough to make it into a “green” cell.
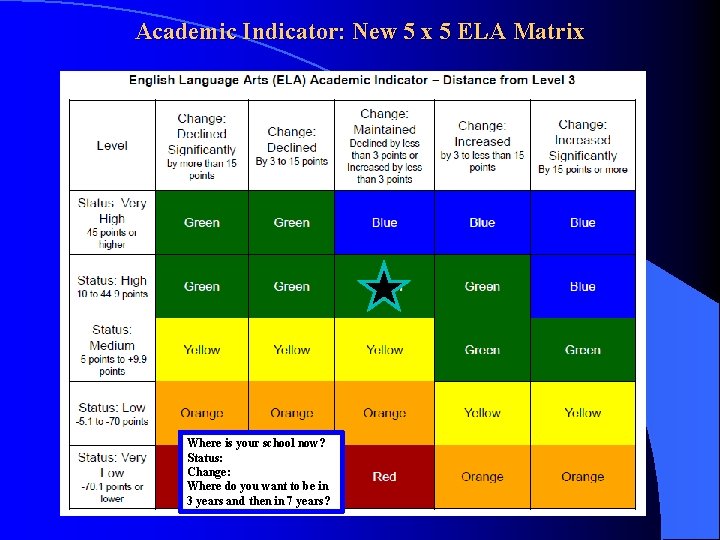
Academic Indicator: New 5 x 5 ELA Matrix Where is your school now? Status: Change: Where do you want to be in 3 years and then in 7 years?
Academic Indicator: English-Language Arts/Literacy (Based Upon SBAC ELA Results) Step 3: Select a way to numerically measure progress toward your three year goal.
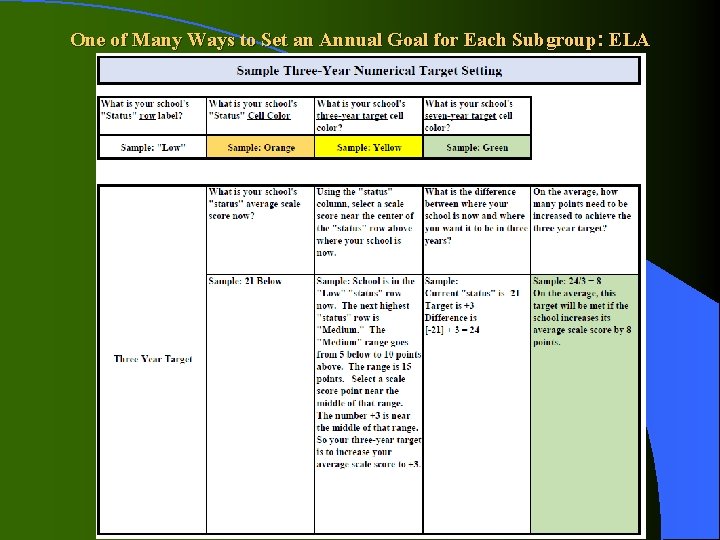
One of Many Ways to Set an Annual Goal for Each Subgroup: ELA
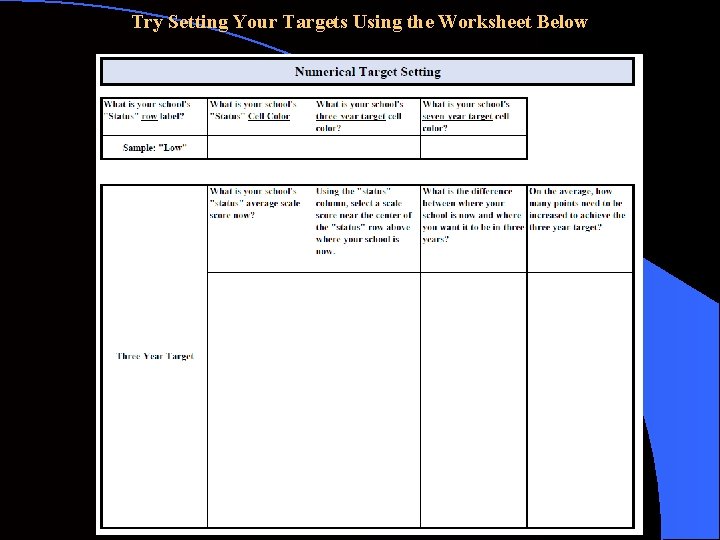
Try Setting Your Targets Using the Worksheet Below
Academic Indicator: Mathematics (Based Upon SBAC Mathematics Results)
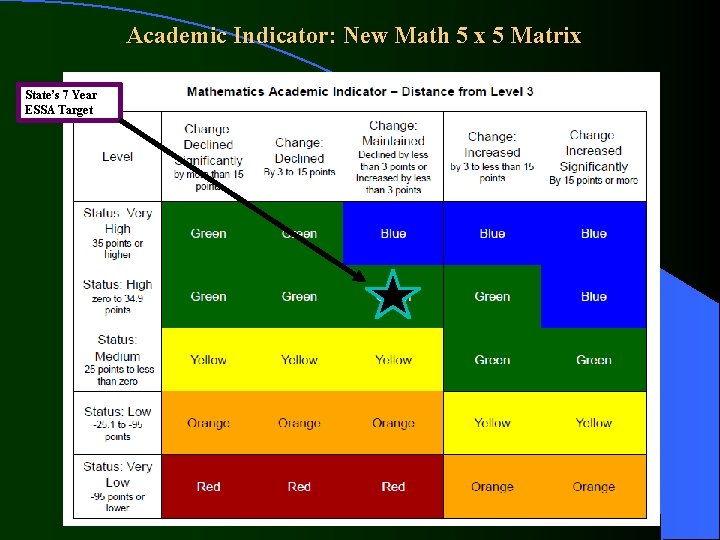
Academic Indicator: New Math 5 x 5 Matrix State’s 7 Year ESSA Target
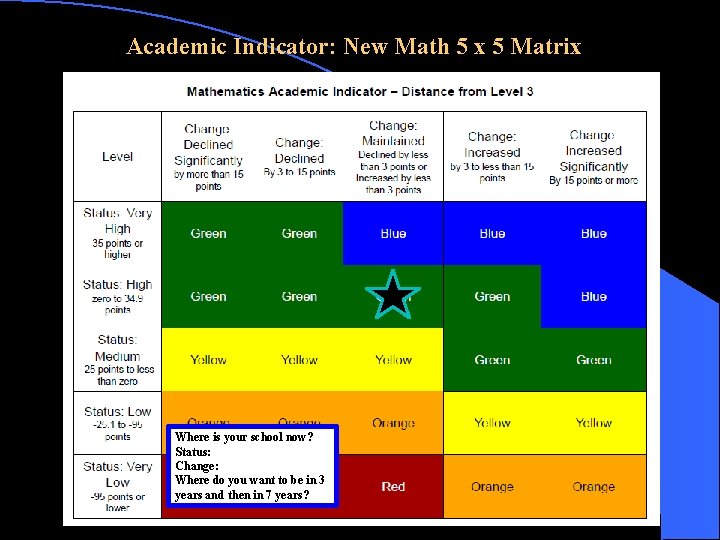
Academic Indicator: New Math 5 x 5 Matrix Where is your school now? Status: Change: Where do you want to be in 3 years and then in 7 years?
Academic Indicators: More Detailed Information to Support Targets Step 4: Select a numerical way to measure progress toward your school’s three-year targets.
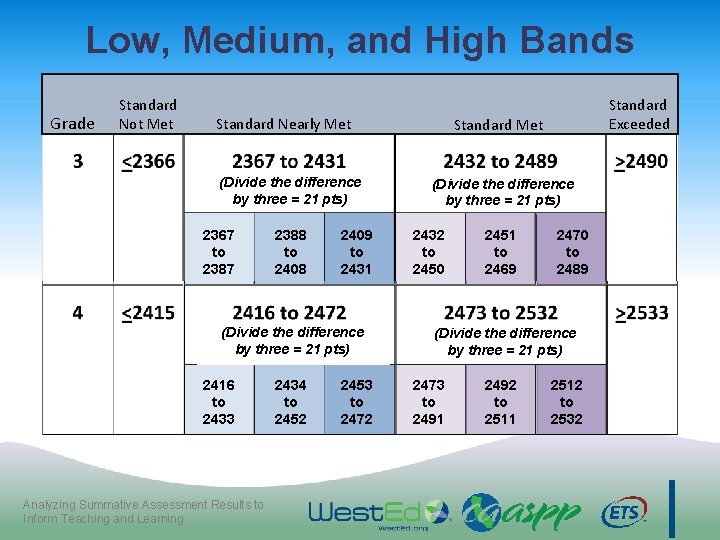
Low, Medium, and High Bands Grade Standard Not Met Standard Nearly Met (Divide the difference by three = 21 pts) 2367 to 2387 2388 to 2408 2409 to 2431 (Divide the difference by three = 21 pts) 2416 to 2433 Analyzing Summative Assessment Results to Inform Teaching and Learning 2434 to 2452 2453 to 2472 Standard Exceeded Standard Met (Divide the difference by three = 21 pts) 2432 to 2450 2451 to 2469 2470 to 2489 (Divide the difference by three = 21 pts) 2473 to 2491 2492 to 2511 2512 to 2532
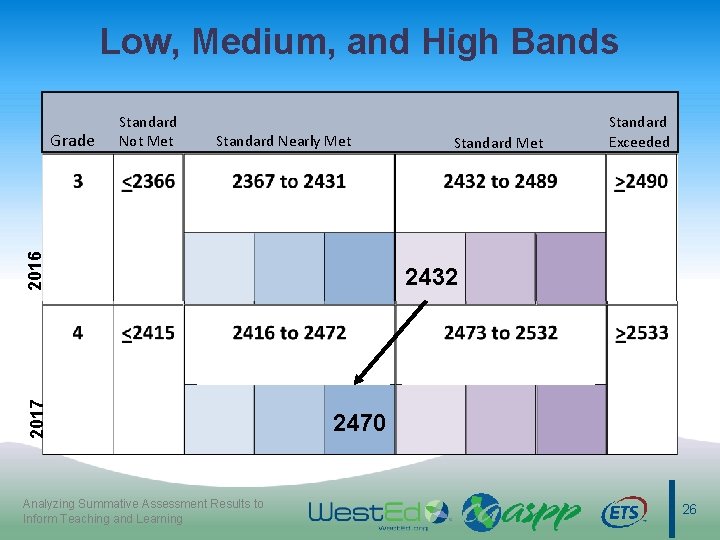
Low, Medium, and High Bands Standard Nearly Met 2017 2016 Grade Standard Not Met Analyzing Summative Assessment Results to Inform Teaching and Learning Standard Met Standard Exceeded 2432 2470 26
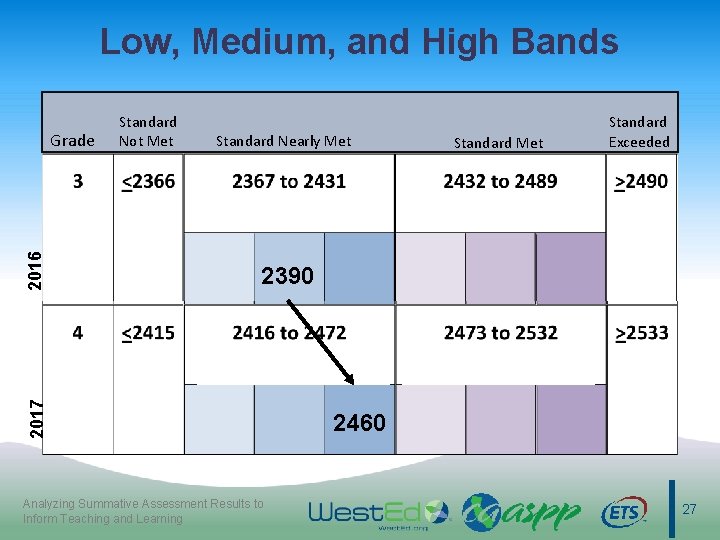
Low, Medium, and High Bands Standard Nearly Met Standard Exceeded 2390 2017 2016 Grade Standard Not Met Analyzing Summative Assessment Results to Inform Teaching and Learning 2460 27
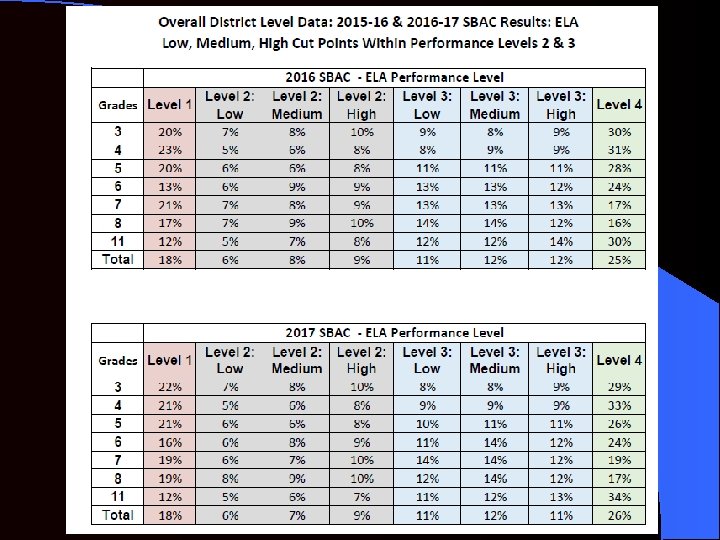
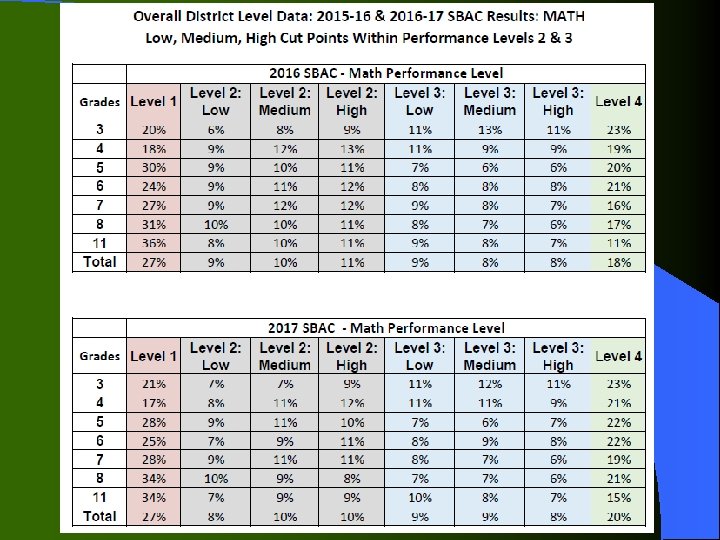
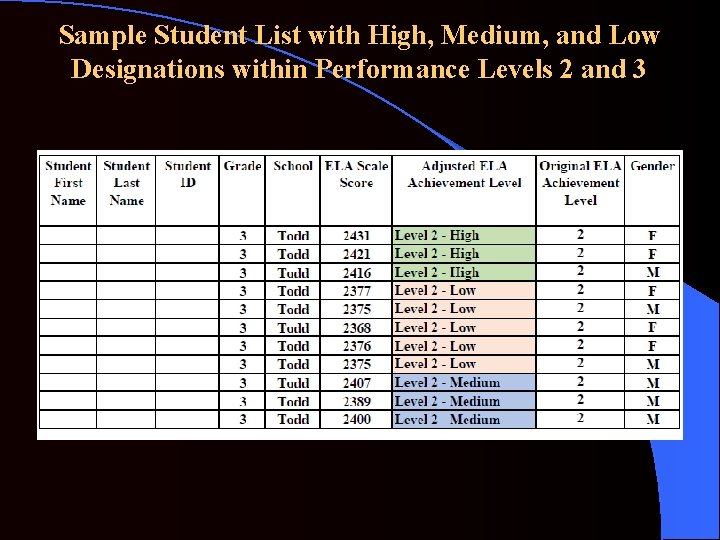
Sample Student List with High, Medium, and Low Designations within Performance Levels 2 and 3
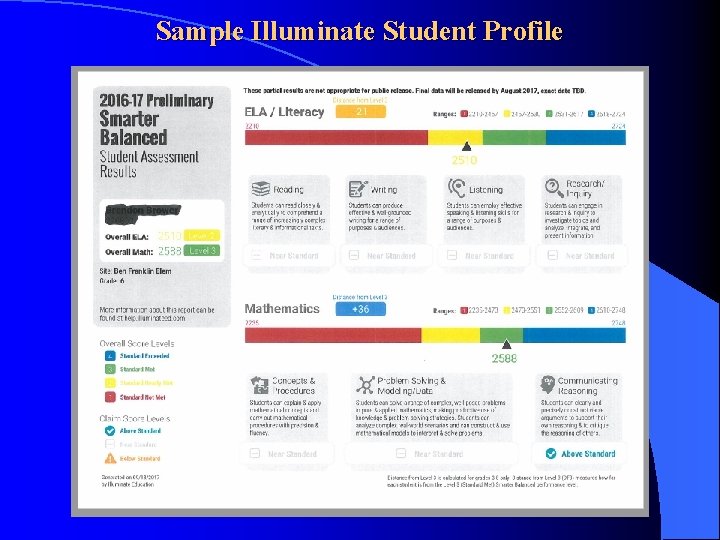
Sample Illuminate Student Profile
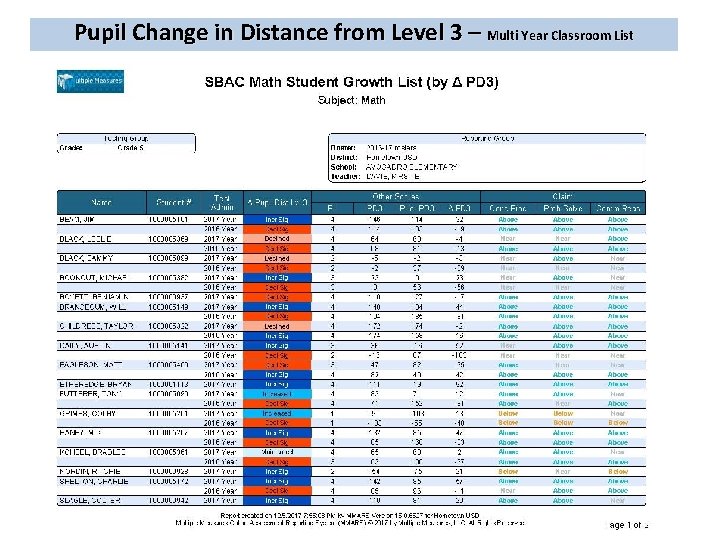
Pupil Change in Distance from Level 3 – Multi Year Classroom List
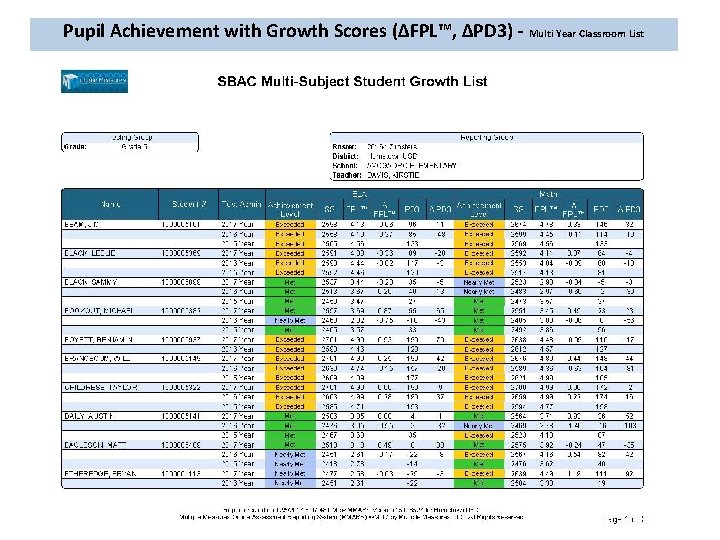
Pupil Achievement with Growth Scores (∆FPL™, ∆PD 3) - Multi Year Classroom List
- Slides: 33