Corn and Soybean Differentiation Using MultiSpectral Landsat Data

Corn and Soybean Differentiation Using Multi-Spectral Landsat Data Freeborn County Minnesota, 2008 -2013 Matt Mc. Guire and Andrew Munsch

Importance of Corn and Soy • • • Minnesota’s Leading Agricultural Commodities Ethanol Subsidies Increasing Worldwide Soy Demand

Minnesota’s Top Corn Counties

How to Differentiate Corn and Soy Spectral Properties Change During Growth
")
Recent Trends in Corn and Soy • • Use Pre-Classed CDL’s (Crop Data Layers) Matrix Union Can Detect Total Field Area of Both Can Detect Crop Rotation

Sample CDL Image

Corn and Soy Field Areas

Corn and Soy Rotation

Study Area: Freeborn County MN Landsat 5 Image: 2008 Landsat 8 Image: 2013 Both Images Taken On July 16, July 14

“Quick and Dirty” 2 -Class Unsupervised Classification of 2008 Landsat 5 Image 1. Create a “Corn and Soy” only mask using the 2008 CDL (recode) 2. Stack and Extract Study Area From 2008 Landsat 5 Image 3. Run Simple K-Means Unsupervised Classification With 2 Output Classes

Results of 2 -Class Unsupervised

Comparison of Classification With 2008 CDL Image Use Matrix Union Pixels Classified As: Reference Class Corn Soy Total Producer's Acc Corn 777038 59587 836625 92. 88% Soy 81344 555095 636439 87. 22% Total 858382 614682 1473064 User Accuracy 90. 52% 90. 31% 90. 43% Total Accuracy

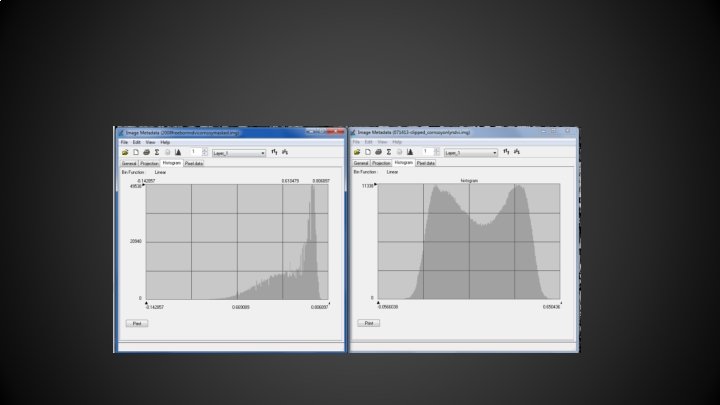
Landsat NDVI Vs 2008 CDL

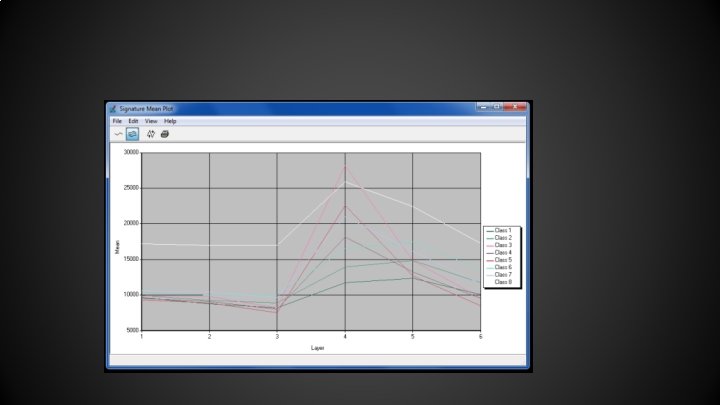
Signature Mean Plot of 2008 Classification

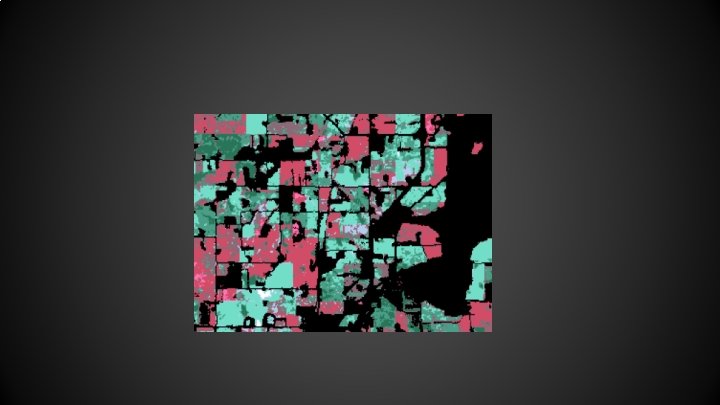
Results of 8 -Class Unsupervised Classification of 2013 Landsat
 Estimated Acres Actual Acreage Planted Error% Corn")
2013 Initial Crop Pixels (Classified Estimates Image) Estimated Acres Actual Acreage Planted Error% Corn 772472 171793. 5242 151705. 71 13. 20% Soy 714161 158825. 4785 84240. 07 88. 50%
 Estimated Acres Actual Acreage Planted Error% Corn")
2013 Initial Crop Pixels (Classified Estimates Image) Estimated Acres Actual Acreage Planted Error% Corn 772472 171793. 5242 151705. 71 13. 20% Soy 501850 111608. 6798 84240. 07 32. 50%

Final Re-Classed Image

Issues and Future Improvements • • Use multi-temporal data Use elevation data for field flooding Temporal Resolution Issues Cloud Cover
- Slides: 22