Corequisite Remediation At Scale Bruce Vandal Vice President

Corequisite Remediation At Scale Bruce Vandal | Vice President, Complete College America Deborah Lott | Student, Ivy Tech Community College of Indiana Mary Ostrye | Senior Vice President and Provost, Ivy Tech Community College of Indiana James Skidmore | Chancellor, West Virginia Council for Community and Technical College Education

Corequisite Remediation

Remediation Too many students start college in remediation. 60%

Remediation Too few remedial students ever graduate. 1 in 10

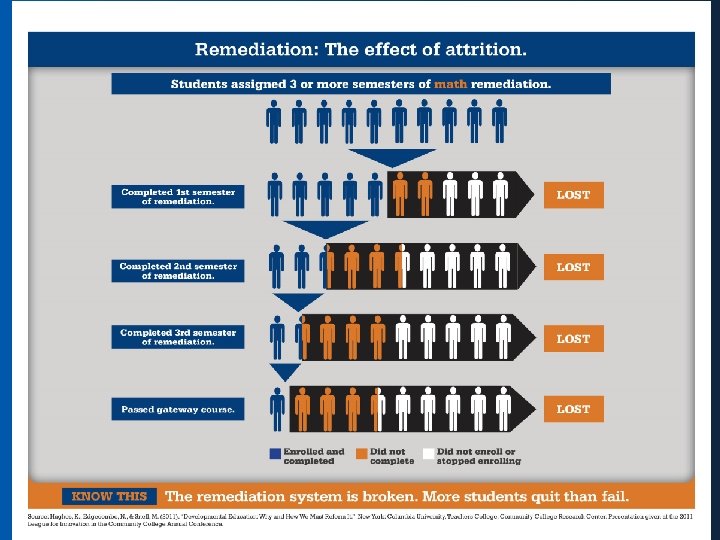
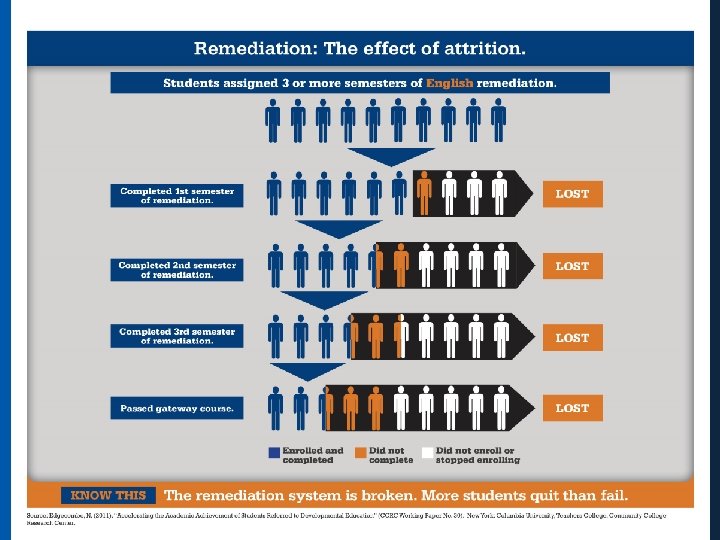
Remediation Student attrition is at the heart of the matter.

Corequisite Remediation Provide academic support as a corequisite not as a prerequisite

Corequisite Remediation More time on task and help for students when they need it (just in time).

Corequisite Options • • 45 minutes after class An additional class period or two Required lab with mentors 5 weeks dev ed, 10 weeks regular course (5 days/wk) • Two semester stretch course
 74% 33%")
One Semester Coreq Results Community College of Baltimore County (Accelerated Learning Program) 74% 33% Traditional Coreq Model ENGLISH
 70% 65% 78% 49%")
One Semester Coreq Results Austin Peay State University (Structured Assistance) 70% 65% 78% 49% 11% Traditional Model Coreq ENGLISH Traditional Model 8% Coreq QUANTITATIVE REASONING Traditional Model Coreq STATISTICS

Percent of Students Current Model Enrolls Most in Remediation 70% Gateway 30% Student Placement Data

Percent of Students New Model Enrolls Most in College Test Prep or Technical Certificate Gateway Course with Corequisite Support 10% 60% Gateway 30% Student Placement Data

Ivy Tech Community College Moving to Scale: Writing Spring, 2014 Traditional 64% Corequisite 36% Fall, 2014 Fall, 2016 Corequisite 100% Traditional 40% Corequisite 60%

Ivy Tech Community College Moving to Scale: Math Spring, 2015 • Fully scaled Quantitative Reasoning Course with Corequisites • Fully scaled Technical Math Pathway • Strategy covers over 60% of students • Math Pathways on the horizon

For every 100 students attempting Reading remediation… 100 65 47 37 Attempted remedial reading Completed remedial reading Attempted gateway English Completed gateway English Leave Pipeline: 35 27% of those who require reading remediation never attempt it. 18 Time lapse: 1 to 3 years 10 2009 ATD cohort – by end of spring 2012 semester (6, 702 tested into reading remediation)

In co-req model, for every 100 students attempting Reading remediation… 49 100 Attempted remedial & gateway English Leave Pipeline: Completed gateway English 51 Time lapse: 4 months Spring 2014 (all students – 423 students

For every 100 students attempting Writing remediation… 62 100 Attempted remedial writing Leave Pipeline: 48 Completed remedial writing 38 27% of those who require writing remediation never attempt it. 37 Attempted gateway English 14 Time lapse: 1 to 3 years Completed gateway English 11 2009 ATD cohort – by end of spring 2012 semester (8, 255 tested into writing remediation)

In co-req model, for every 100 students attempting Writing remediation… Leave Pipeline: 100 52 Attempted remedial & gateway English Completed gateway English 48 Time lapse: 4 months Spring 2014 (all students – 1054 students

For every 100 students attempting Math remediation… 49 100 Completed remedial math Attempted remedial math Leave Pipeline: 18% of those who require math remediation never attempt it. 51 36 29 Attempted gateway math Completed gateway math 13 Time lapse: 1 to 3 years 7 2009 ATD cohort – by end of spring 2012 semester (17, 785 tested in math remediation)

In co-req model, for every 100 students attempting Math remediation… 100 52 Attempted remedial & gateway math Completed gateway math Leave Pipeline: 48 Time lapse: 4 months Spring 2014 (all students – 2103 students

The Problem First-Time Freshmen In Developmental Education Graduation Rate of Developmental Education Students

Developmental Education Courses 2011 - Math 2014 - Math

Developmental Education Courses 2011 - English 2014 - English
- Slides: 27