Copyright 2015 Mc GrawHill Education All rights reserved

與相對次數表(relative frequency tables). LO 2")

: Kane Motors, Olean Automotive Inc.")


 n Step 1: Decide on")
 n Step 3: Set the")
 n. Step 4: Tally the")
 can be converted")
 to")


- Slides: 41
描述資料: 次數表, 次數分配, 以及 統 計圖 第二章 Copyright © 2015 Mc. Graw-Hill Education. All rights reserved. No reproduction or distribution without the prior written consent of Mc. Graw-Hill Education.
Learning Objectives LO 2 -1 將 qualitative variables 整理成次數表(frequency tables)與相對次數表(relative frequency tables). LO 2 -2 用長條圖 (bar chart) 或圓餅圖 (pie chart)來呈現次 數表(frequency table) LO 2 -3 將 quantitative variables整理成次數分配 (frequency distributions) and相對次數分配(relative frequency distributions) LO 2 -4 用直方圖 (histogram)或次數多邊圖(frequency polygon)來呈現次數分配(frequency distribution) 2 -*
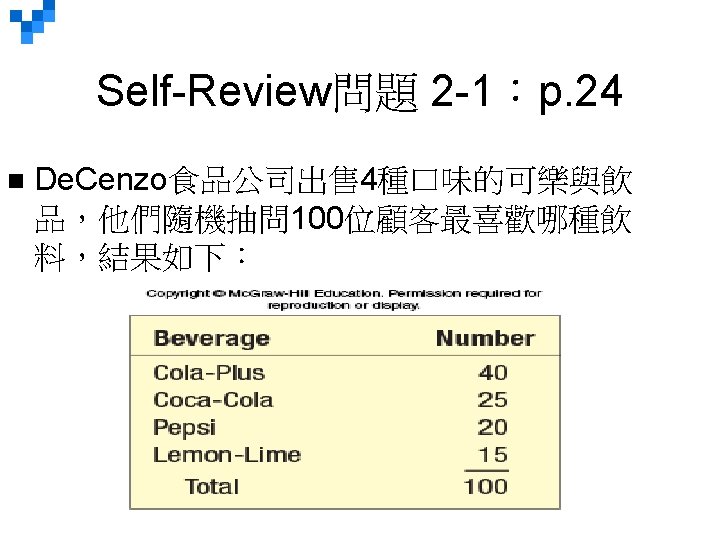
LO 2 -1 Summarize qualitative variables with frequency and relative frequency tables. 次數表 Frequency Table FREQUENCY TABLE 將類別(屬質)資料(qualitative data)分組成 互斥的(mutually exclusive)以及相互獨立,完全耗盡的組別(collectively exhaustive classes) ,並呈現各組觀察值數量的表格。 2 -*
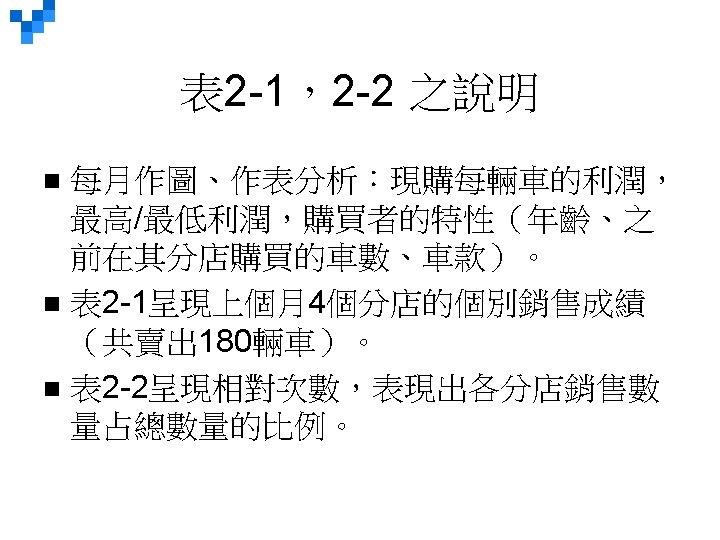
表 2 -1之說明 n n n Applewood Auto Group有4個銷售點(分店): Kane Motors, Olean Automotive Inc. , Sheffield Motors Inc. , Tionesta Ford Lincoln Mercury 他們銷售Kia, Hyundai, BMW, Volvo 的sedans(4 門轎車),SUV(休旅車),以及福特與雪佛萊的轎 車與貨卡車。 Kathryn Ball負責追蹤分析各類車款的銷售成績與 獲利率。
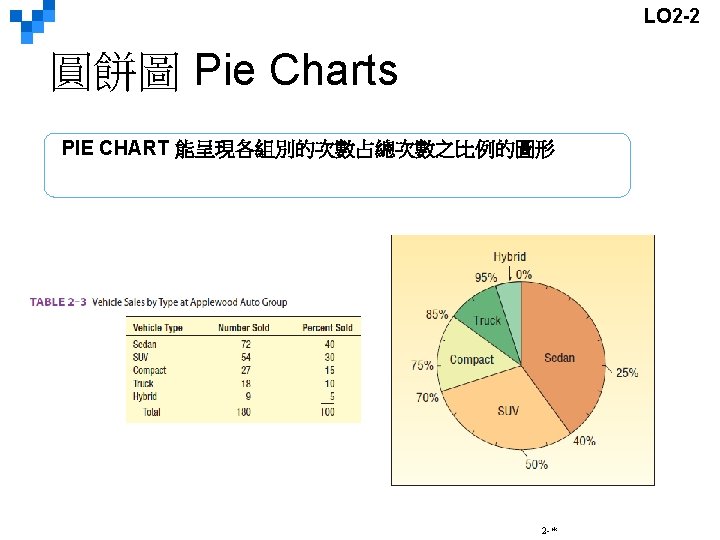
長條圖 Bar Charts LO 2 -2 Display a frequency table using a bar or pie chart. BAR CHART 將屬質資料(qualitative classes)的組別 標示於X軸,將 各組別次數標示於Y軸的圖形。各組的次數與長條圖的高度成正比。 2 -*
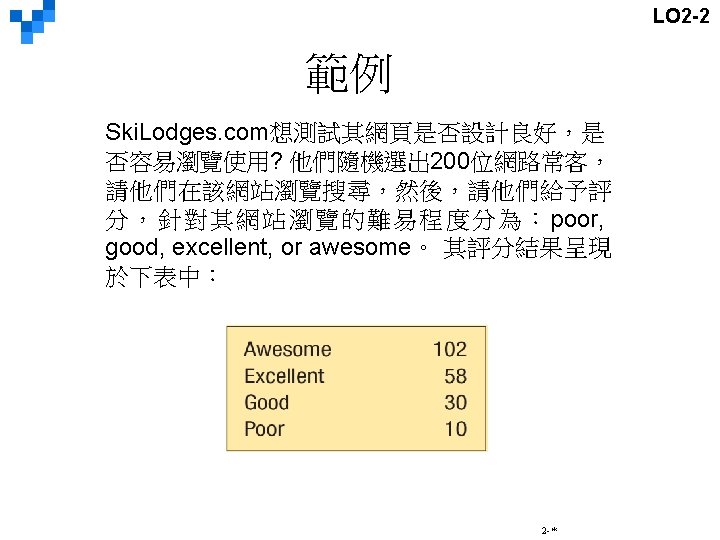
LO 2 -2 Example Continued 1. What type of measurement scale is used for ease of navigation? O 2. Draw a bar chart for the survey results. 3. Draw a pie chart for the survey results. 2 -*
LO 2 -2 Pie Chart Using Excel 2 -*
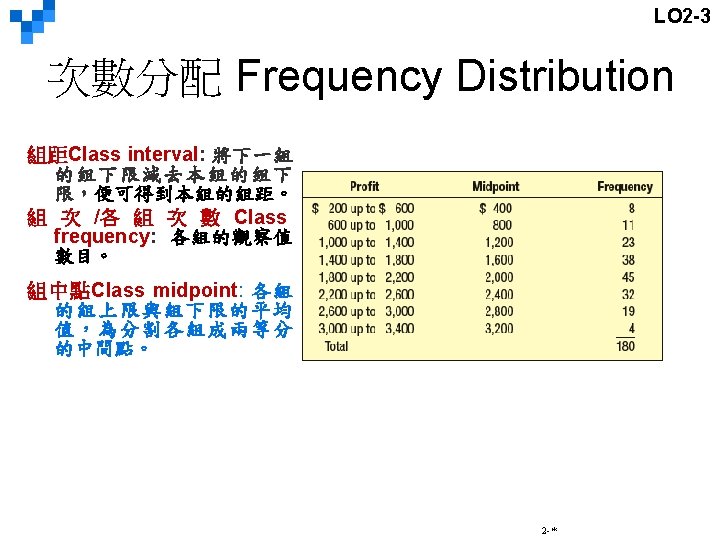
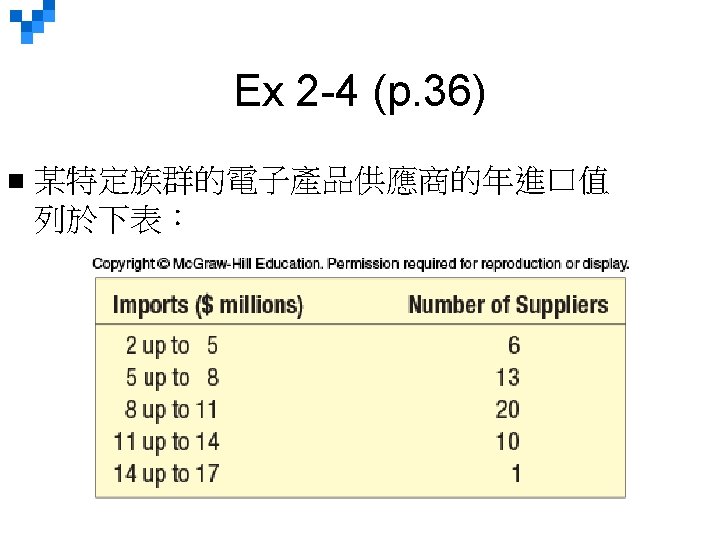
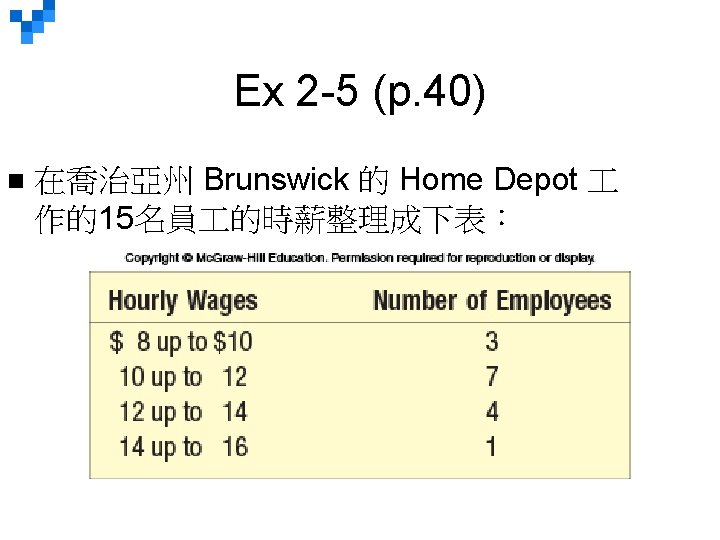
LO 2 -3 Summarize quantitative variables with frequency and relative frequency distributions. 次數分配 Frequency Distribution FREQUENCY DISTRIBUTION 將數量資料依照互斥(mutually exclusive)與相互獨立且完全耗盡(collectively exhaustive)的原 則分成不同的組別(classes) ,並呈現各組別觀察值的數量。 例如: Applewood Auto Group 上個月賣車利潤的次數 分配表 2 -*
LO 2 -3 Creating a Frequency Distribution Table – Example Kathryn Ball of the Applewood Auto Group wants to describe the data collected on the profits for the 180 vehicles sold last month at the four Applewood locations. She would like to know: 1. What is the typical profit for the 180 vehicles sold? 2. What is the largest profit on any sale? 3. What is the lowest profit on any sale? 4. What is the typical value of profit or around what value of profit does the data tend to cluster? 2 -*
LO 2 -3 Frequency Distribution Table – Example (Continued) n Step 1: Decide on the 組數 k number of classes. A useful recipe to determine the number of classes (k) is the “ 2 to the k rule, ” such that 2 k > n. (n: 觀察值個數) There were 180 vehicles sold, so n = 180. If we try k = 7, then 27 = 128, somewhat less than 180. Hence, 7 is not enough classes. If we let k = 8, then 28 = 256, which is greater than 180. So the recommended number of classes is 8. n Step 2: Determine the 組距 class interval or width. The formula is: i (H-L)/k where i is the class interval, H is the highest observed value, L is the lowest observed value, and k is the number of classes. Round up to some convenient number, such as a multiple of 10 or 100. Use a class width of $400. 2 -*
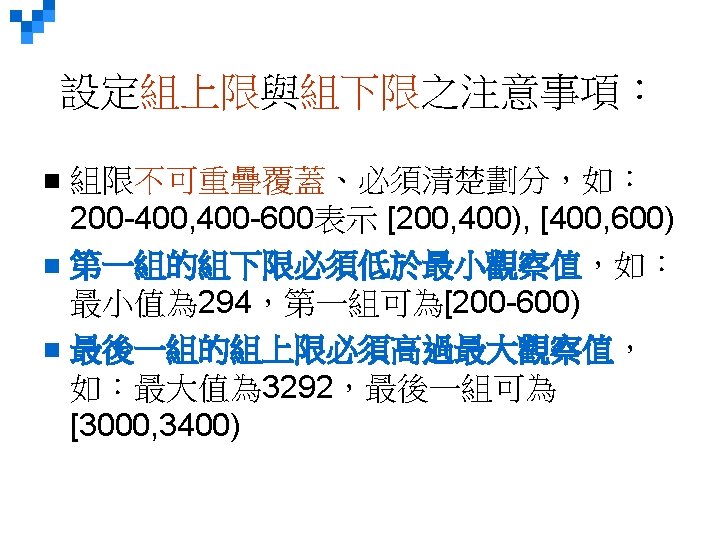
LO 2 -3 Frequency Distribution Table – Example (Continued) n Step 3: Set the individual class limits:組上限與組下限. 2 -*
LO 2 -3 Frequency Distribution Table – Example (Continued) n. Step 4: Tally the vehicle profits into the classes. n. Step 5: Count the number of items in each class. 2 -*
LO 2 -3 相對組次 Relative Class Frequencies n n 組次(Class frequencies) can be converted to 相對組次 (relative class frequencies) to show the fraction of the total number of observations in each class. A relative frequency captures the relationship between a class total and the total number of observations. 2 -*
LO 2 -3 相對次數分配 Relative Frequency Distribution To convert a 次數分配 (frequency distribution) to a 相對次數分配 (relative frequency distribution), each of the組次(class frequencies) is divided by the total number of observations. 2 -*
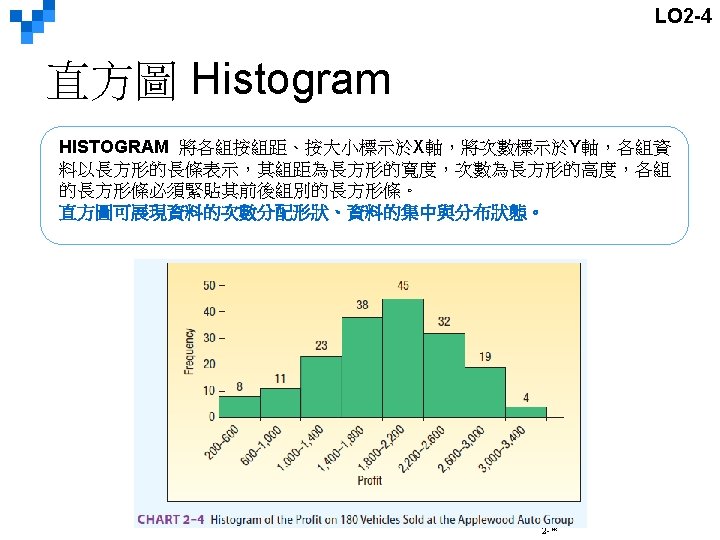
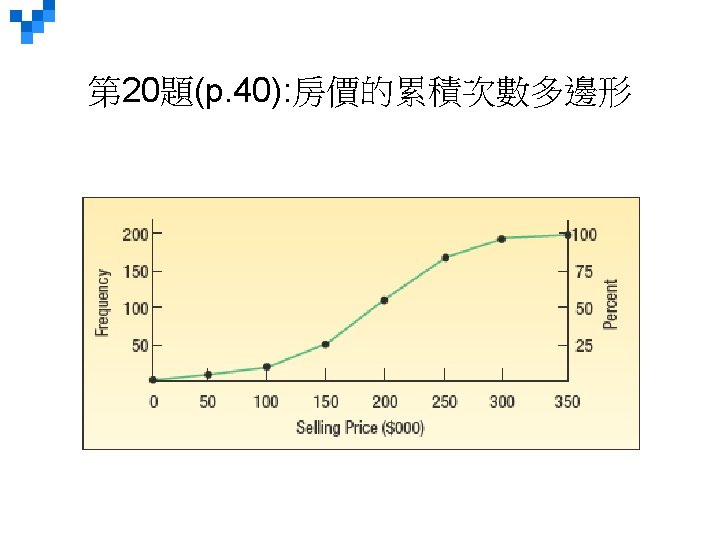
LO 2 -4 Display a frequency distribution using a histogram or frequency polygon. Displays of Frequency Distributions The three commonly used graphic forms are: § Histograms(直方圖) § Frequency polygons(次數多邊圖) § Cumulative frequency distributions (累積次數分配) 2 -*
LO 2 -4 Histogram Using Excel 2 -*
LO 2 -4 次數多邊圖 Frequency Polygon n A frequency polygon, 與直方圖一樣能展現分 配的形狀 (similar to a histogram, also shows the shape of a distribution. ) n 它乃是將各組的(組中 點, 次數)各點連結成多 邊形線條 n (It consists of line segments connecting the class midpoints of the class frequencies. ) 2 -*
LO 2 -4 Histogram versus Frequency Polygon n Both provide a quick picture of the main characteristics of the data (highs, lows, points of concentration, etc. ) n Advantage of the histogram: It depicts each class as a rectangle, with the height of the rectangular bar representing the number in each class. n Advantage of the frequency polygon: It allows us to compare directly two or more frequency distributions. 2 -*
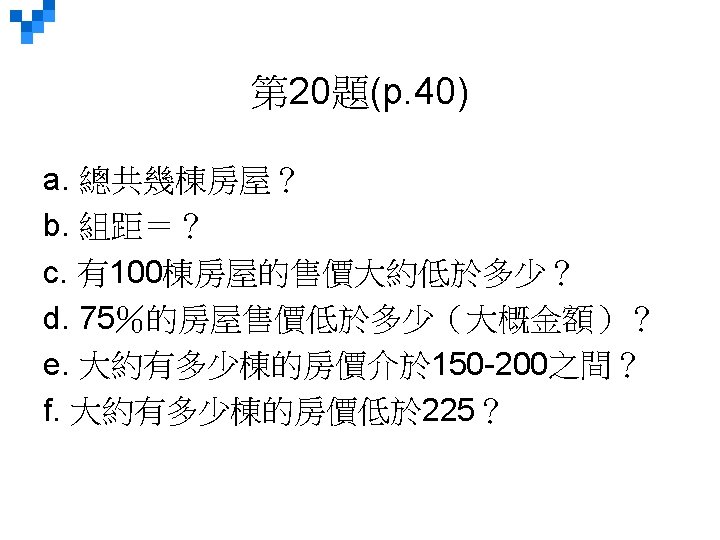
LO 2 -4 累積次數分配Cumulative Frequency Distribution 2 -*
LO 2 -4 累積次數分配Cumulative Frequency Distribution 2 -*