Copyright 2008 by Hawkes Learning SystemsQuant Systems Inc

Copyright © 2008 by Hawkes Learning Systems/Quant Systems, Inc. All rights reserved. HAWKES LEARNING SYSTEMS math courseware specialists Section 11. 6 ANOVA
 11. 6")
HAWKES LEARNING SYSTEMS math courseware specialists Hypothesis Testing (Two or More Populations) 11. 6 ANOVA Definitions: • ANOVA – analysis of variance. • Grand Mean – the weighted mean of the sample means from each of the populations. • Total Variation – the sum of the variations contributed by each sample. • Sum of Squares among Treatments, SST – the variation resulting from the differences in the population means. • Sum of Squares of Error, SSE – the variation resulting from the variance within the populations.
 11. 6")
HAWKES LEARNING SYSTEMS math courseware specialists Hypothesis Testing (Two or More Populations) 11. 6 ANOVA Test: 1. The distributions of all of the populations are approximately normal. 2. The variances of the populations are the same. (If the sample sizes are nearly equal, this assumption is not essential. ) 3. Independent, simple random samples were taken from each population.
 11. 6")
HAWKES LEARNING SYSTEMS math courseware specialists Hypothesis Testing (Two or More Populations) 11. 6 ANOVA Null and Alternative Hypotheses: H 0 : 1 = 2 = … = n. Ha: At least one mean differs from the others. An ANOVA test indicates if at least one of the population means is different, but it DOES NOT indicate which one differs, or by how much.
 11. 6")
HAWKES LEARNING SYSTEMS math courseware specialists Hypothesis Testing (Two or More Populations) 11. 6 ANOVA Grand Mean: xij = the j th data value from population i ni = the sample size from population i ∑ xij = the sum of the data values in the i th population Example: Treatments A , B and C A= 2 3 5 3 6 7 8 9 10 B= 3 5 7 9 2 1 7 8 9 C= 5 6 3 2 4 5 6 7 8 Total Average = 5. 55 (Grand Mean)
 11. 6")
HAWKES LEARNING SYSTEMS math courseware specialists Hypothesis Testing (Two or More Populations) 11. 6 ANOVA Table: SS DF Treatments SST k– 1 Error SSE n–k Total SST + SSE DFT + DFE MS F
 11. 6")
HAWKES LEARNING SYSTEMS math courseware specialists Hypothesis Testing (Two or More Populations) 11. 6 ANOVA Sum of Squares among Treatments: the variation resulting from the differences in the population means. k = the number of populations ni = the sample size from the i th population = the sample mean from the i th population Example: Treatments A , B and C A= 2 3 5 3 6 7 8 9 10 Average = 5. 89 n=9 B= 3 5 7 9 2 1 7 8 9 Average = 5. 67 n=9 C= 5 6 3 2 4 5 6 7 8 Average = 5. 11 n=9 Total Average = 5. 55 (Grand Mean) SST= 9*(5. 89 – 5. 55)2 + 9*(5. 67 – 5. 55)2 + 9*(5. 11 – 5. 55)2 SST = 1. 0000 + 0. 11111 + 1. 77777 = 2. 888889
 11. 6")
HAWKES LEARNING SYSTEMS math courseware specialists Hypothesis Testing (Two or More Populations) 11. 6 ANOVA Sum of Squares of Error: the variation resulting from the variance within the populations. Example: Treatments A , B and C A= 2 3 5 3 6 7 8 9 10 Average = 5. 89 n=9 B= 3 5 7 9 2 1 7 8 9 Average = 5. 67 n=9 C= 5 6 3 2 4 5 6 7 8 Average = 5. 11 n=9 SSE(A) = (2 -5. 89)2 + (3 -5. 89)2 + …… + (10 -5. 89)2 = 64. 889 SSE(B) = (3 -5. 67)2 + (5 -5. 67)2 + …… + (9 -5. 67)2 = 74 SSE(C) = (5 -5. 11)2 + (6 -5. 11)2 + …… + (8 -5. 11)2 = 28. 889 SSE = SSE(A) + SSE(B) + SSE(C) = 167. 7778
 11. 6")
HAWKES LEARNING SYSTEMS math courseware specialists Hypothesis Testing (Two or More Populations) 11. 6 ANOVA Total Variation: the sum of the variations contributed by each sample. Total Variation = SST + SSE Total Variation = 2. 888889 + 167. 7778 Total Variation = 170. 66667 Example: Treatments A , B and C A= 2 3 5 3 6 7 8 9 10 Average = 5. 89 n=9 B= 3 5 7 9 2 1 7 8 9 Average = 5. 67 n=9 C= 5 6 3 2 4 5 6 7 8 Average = 5. 11 n=9 Total Average = 5. 55 (Grand Mean) SSTotal = (2 -5. 55)2 + (3 -5. 55)2 + …… + (7 -5. 55)2 + (8 -5. 55)2 = 170. 6667
 11. 6")
HAWKES LEARNING SYSTEMS math courseware specialists Hypothesis Testing (Two or More Populations) 11. 6 ANOVA Mean Square for Treatment: = k = number of treatments = 3 Degrees of Freedom of Treatments (DFT) = k -1 DFT = 3 -1 =2 SST = 2. 888889 MST = 2. 888889 ÷ 2 = 1. 44444
 11. 6")
HAWKES LEARNING SYSTEMS math courseware specialists Hypothesis Testing (Two or More Populations) 11. 6 ANOVA Mean Square for Error: = k = number of treatments = 3 n = number of observations = 27 Degrees of Freedom of Error (DFE) = n - k DFE = 27 -3 =24 SSE = 167. 77778 MSE = 167. 77778 ÷ 24 = 6. 9907

HAWKES LEARNING SYSTEMS math courseware specialists Test Statistic for ANOVA: Hypothesis Testing (Two or More Populations) 11. 6 ANOVA = 1. 44444. == 0. 2066 6. 9907 To determine if the test statistic calculated from the sample is statistically significant we will need to look at the critical value. The critical values for population variances are found from the chi-square distribution. Reject the Null Hypotheses if p ≤ or Reject if F-Statistic (F) ≥ F-Critical (Fdft, dfe) F-Critical (F 2, 24) = 3. 4028 ( = 0. 05) H 0 : 1 = 2 = … = n. Ha: At least one mean differs from the others.
 11. 6")
HAWKES LEARNING SYSTEMS math courseware specialists Hypothesis Testing (Two or More Populations) 11. 6 ANOVA Table: Don’t Reject, 0. 2066 is NOT ≥ 3. 4028 (p-value of 0. 814758 is NOT ≤ 0. 05) There is not sufficient evidence at the 0. 05 level of significance to support the researcher’s claim that there is a significant difference in the three treatments.
 11. 6")
HAWKES LEARNING SYSTEMS math courseware specialists Hypothesis Testing (Two or More Populations) 11. 6 ANOVA Table: SST = MST x DFT SS DF Treatments SST k– 1 Error SSE n–k Total SST + SSE DFT + DFE = SSE_ MSE MS F
 = 1135. 18 x 3 = 3405. 54")
SST = MST x (k-1) = 1135. 18 x 3 = 3405. 54

SSTotal = SST + SSE = SSTotal – SST SSE = 6637. 23 – 3405. 54 = 3231. 69

DFTotal = DFT + DFE = DFTotal – DFT DFE = 14 -3 = 11

= 1135. 18. = 3. 86 = 293. 79

SST

SSE

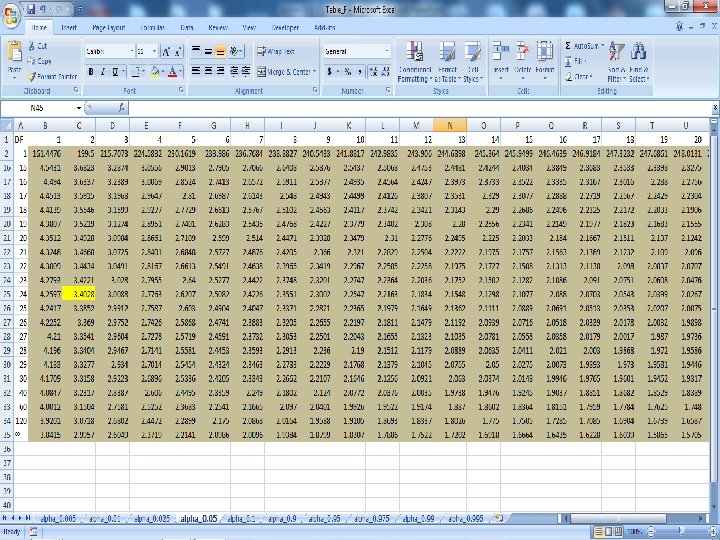
DF FIND CRITICAL-F DFT= DFE= Alpha= 3 11 0. 05 F-Critical= 3. 587434 =FINV(3, 11, 0. 05) 1 2 3 4 5 6 7 8 9 10 11 12 1 161. 4476 18. 5128 10. 128 7. 7086 6. 6079 5. 9874 5. 5914 5. 3177 5. 1174 4. 9646 4. 8443 4. 7472 2 3 4 199. 5 215. 7073 224. 5832 19 19. 1643 19. 2468 9. 5521 9. 2766 9. 1172 6. 9443 6. 5914 6. 3882 5. 7861 5. 4095 5. 1922 5. 1433 4. 7571 4. 5337 4. 7374 4. 3468 4. 1203 4. 459 4. 0662 3. 8379 4. 2565 3. 8625 3. 6331 4. 1028 3. 7083 3. 478 3. 9823 3. 5874 3. 3567 3. 8853 3. 4903 3. 2592

Ho: All means are equal HA: At least one mean is different Reject the Null if F-Statistics (F) > F-Critical REJECT -- STATISTICALLY SIGNIFICANT IF 3. 8639 > 3. 587434, REJECT NULL

Copy Data from Hawkes to Excel Paste in cell A 2

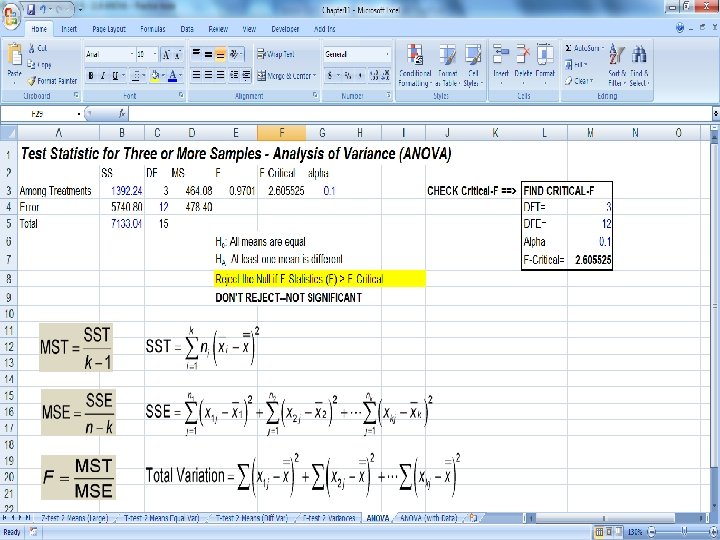
MST = SST ÷ DFT SST = MST x DFT SST = 464. 08 x 3 = 1392. 24 DFTotal = DFT + DFE = DFTotal – DFT DFE = 15 – 3 = 12 SSTotal = SST + SSE = SSTotal – SST SSE = 7133. 04 – 1392. 24 = 5740. 8 F-Statistic = MST ÷ MSE F-Statistic = 464. 08 ÷ 478. 40 F-Statistic = 0. 97
- Slides: 26