Copyright 2004 Intel Corporation All Rights Reserved Maximizing

- Slides: 37

Copyright © 2004 Intel Corporation. All Rights Reserved. Maximizing Application’s Performance by Threading, SIMD and micro arcitecture tuning Koby Gottlieb Intel Corporation Feb 27 2007 -1 -

Copyright © 2004 Intel Corporation. All Rights Reserved. Agenda n Threading gains and challenges n Optimization methodology, project milestones – Developing Benchmark – VTune™ Performance Analyzer – Threading: Overview of approaches – Intel® Thread Checker – Intel® Thread Profiler – Streaming SIMD Extensions (SSE) and micro architectural issue n Project example [Mark] is a trademark or registered trademark of Intel Corporation or its subsidiaries in the United States or other countries -2 -

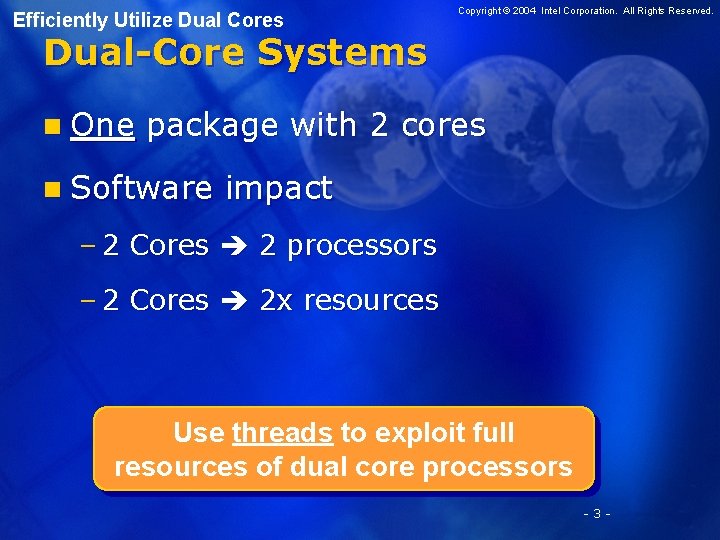
Efficiently Utilize Dual Cores Copyright © 2004 Intel Corporation. All Rights Reserved. Dual-Core Systems n One package with 2 cores n Software impact – 2 Cores 2 processors – 2 Cores 2 x resources Use threads to exploit full resources of dual core processors -3 -

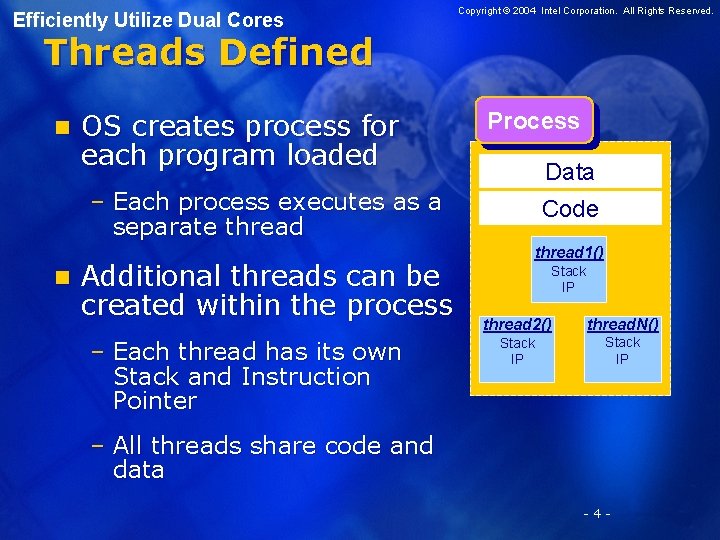
Efficiently Utilize Dual Cores Copyright © 2004 Intel Corporation. All Rights Reserved. Threads Defined n OS creates process for each program loaded Process Data – Each process executes as a separate thread n Additional threads can be created within the process – Each thread has its own Stack and Instruction Pointer Code thread 1() Stack IP thread 2() thread. N() Stack IP … – All threads share code and data -4 -

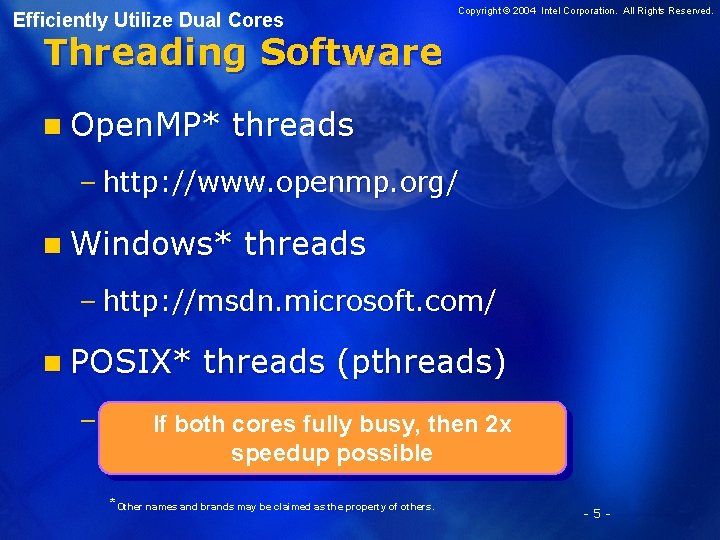
Efficiently Utilize Dual Cores Copyright © 2004 Intel Corporation. All Rights Reserved. Threading Software n Open. MP* threads – http: //www. openmp. org/ n Windows* threads – http: //msdn. microsoft. com/ n POSIX* threads (pthreads) – http: // www. ieee. org / then 2 x If both cores fully busy, speedup possible *Other names and brands may be claimed as the property of others. -5 -

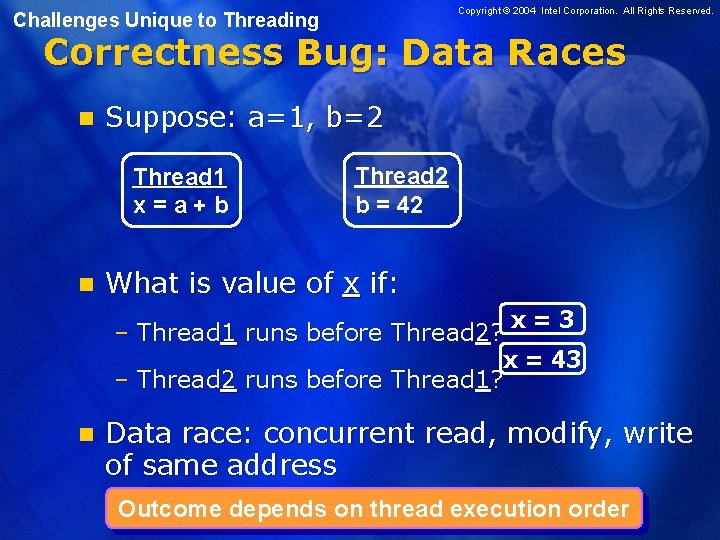
Copyright © 2004 Intel Corporation. All Rights Reserved. Challenges Unique to Threading Correctness Bug: Data Races n Suppose: a=1, b=2 Thread 1 x=a+b n Thread 2 b = 42 What is value of x if: x=3 – Thread 1 runs before Thread 2? x = 43 – Thread 2 runs before Thread 1? n Data race: concurrent read, modify, write of same address Outcome depends on thread execution order -6 -

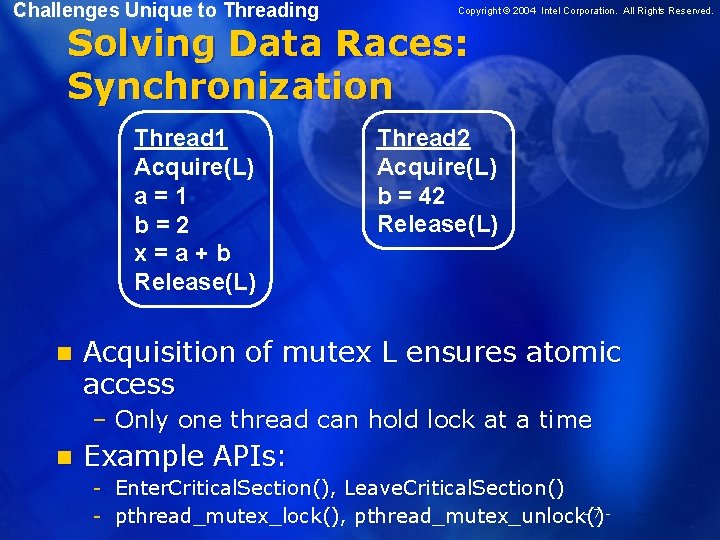
Challenges Unique to Threading Copyright © 2004 Intel Corporation. All Rights Reserved. Solving Data Races: Synchronization Thread 1 Acquire(L) a=1 b=2 x=a+b Release(L) n Thread 2 Acquire(L) b = 42 Release(L) Acquisition of mutex L ensures atomic access – Only one thread can hold lock at a time n Example APIs: - Enter. Critical. Section(), Leave. Critical. Section() 7 - pthread_mutex_lock(), pthread_mutex_unlock-()

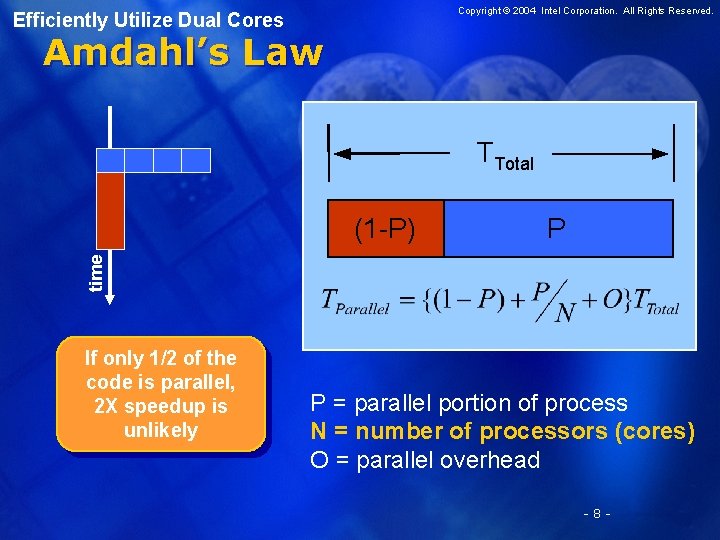
Copyright © 2004 Intel Corporation. All Rights Reserved. Efficiently Utilize Dual Cores Amdahl’s Law TTotal time (1 -P) If only 1/2 of the code is parallel, 2 X speedup is unlikely P P P = parallel portion of process N = number of processors (cores) O = parallel overhead -8 -

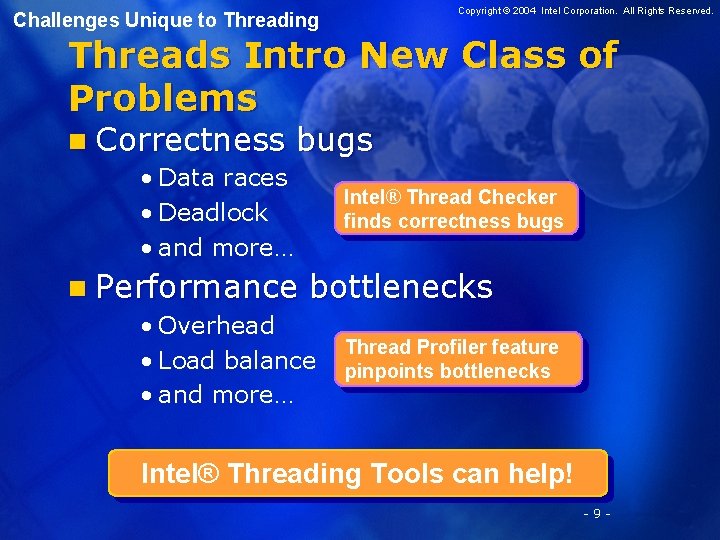
Copyright © 2004 Intel Corporation. All Rights Reserved. Challenges Unique to Threading Threads Intro New Class of Problems n Correctness bugs • Data races • Deadlock • and more… n Performance Intel® Thread Checker finds correctness bugs bottlenecks • Overhead • Load balance • and more… Thread Profiler feature pinpoints bottlenecks Intel® Threading Tools can help! -9 -

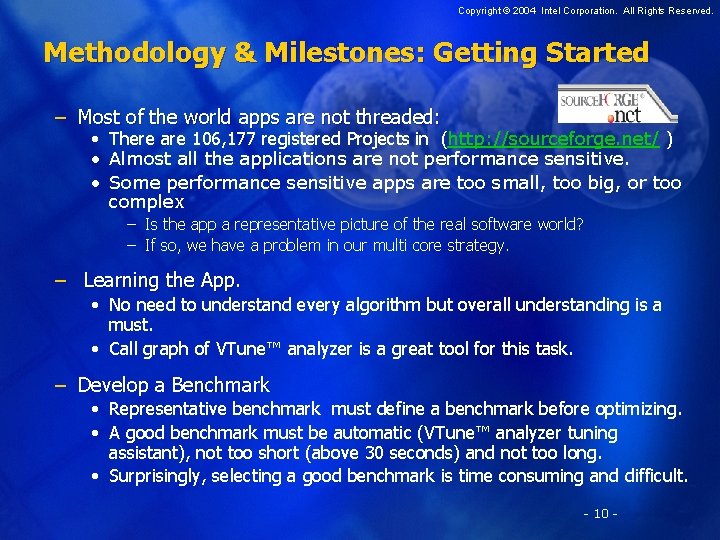
Copyright © 2004 Intel Corporation. All Rights Reserved. Methodology & Milestones: Getting Started – Most of the world apps are not threaded: • There are 106, 177 registered Projects in (http: //sourceforge. net/ ) • Almost all the applications are not performance sensitive. • Some performance sensitive apps are too small, too big, or too complex – Is the app a representative picture of the real software world? – If so, we have a problem in our multi core strategy. – Learning the App. • No need to understand every algorithm but overall understanding is a must. • Call graph of VTune™ analyzer is a great tool for this task. – Develop a Benchmark • Representative benchmark must define a benchmark before optimizing. • A good benchmark must be automatic (VTune™ analyzer tuning assistant), not too short (above 30 seconds) and not too long. • Surprisingly, selecting a good benchmark is time consuming and difficult. - 10 -

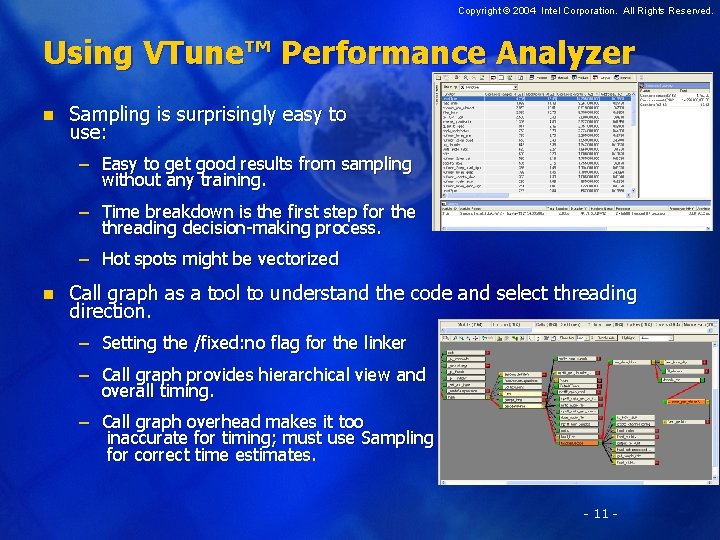
Copyright © 2004 Intel Corporation. All Rights Reserved. Using VTune™ Performance Analyzer n Sampling is surprisingly easy to use: – Easy to get good results from sampling without any training. – Time breakdown is the first step for the threading decision-making process. – Hot spots might be vectorized n Call graph as a tool to understand the code and select threading direction. – Setting the /fixed: no flag for the linker – Call graph provides hierarchical view and overall timing. – Call graph overhead makes it too inaccurate for timing; must use Sampling for correct time estimates. - 11 -

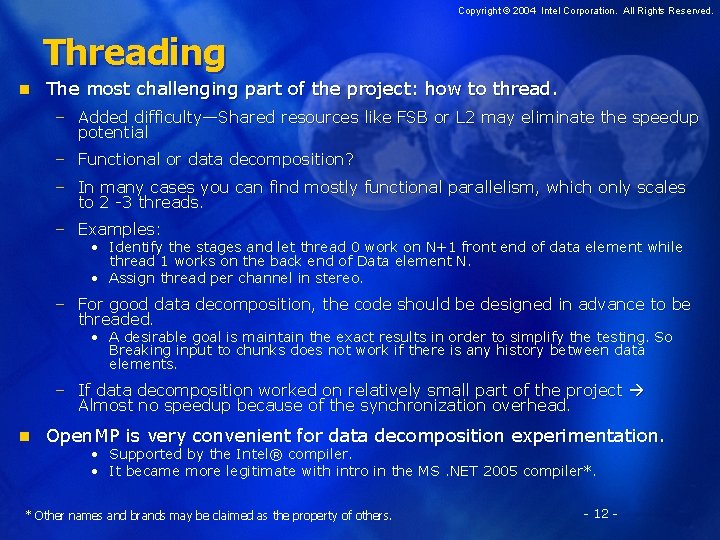
Copyright © 2004 Intel Corporation. All Rights Reserved. Threading n The most challenging part of the project: how to thread. – Added difficulty—Shared resources like FSB or L 2 may eliminate the speedup potential – Functional or data decomposition? – In many cases you can find mostly functional parallelism, which only scales to 2 -3 threads. – Examples: • Identify the stages and let thread 0 work on N+1 front end of data element while thread 1 works on the back end of Data element N. • Assign thread per channel in stereo. – For good data decomposition, the code should be designed in advance to be threaded. • A desirable goal is maintain the exact results in order to simplify the testing. So Breaking input to chunks does not work if there is any history between data elements. – If data decomposition worked on relatively small part of the project Almost no speedup because of the synchronization overhead. n Open. MP is very convenient for data decomposition experimentation. • Supported by the Intel® compiler. • It became more legitimate with intro in the MS. NET 2005 compiler*. * Other names and brands may be claimed as the property of others. - 12 -

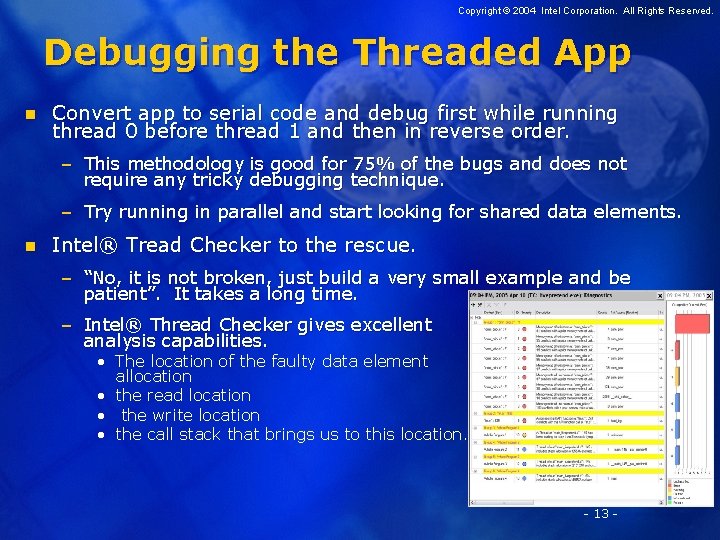
Copyright © 2004 Intel Corporation. All Rights Reserved. Debugging the Threaded App n Convert app to serial code and debug first while running thread 0 before thread 1 and then in reverse order. – This methodology is good for 75% of the bugs and does not require any tricky debugging technique. – Try running in parallel and start looking for shared data elements. n Intel® Tread Checker to the rescue. – “No, it is not broken, just build a very small example and be patient”. It takes a long time. – Intel® Thread Checker gives excellent analysis capabilities. • The location of the faulty data element allocation • the read location • the write location • the call stack that brings us to this location. - 13 -

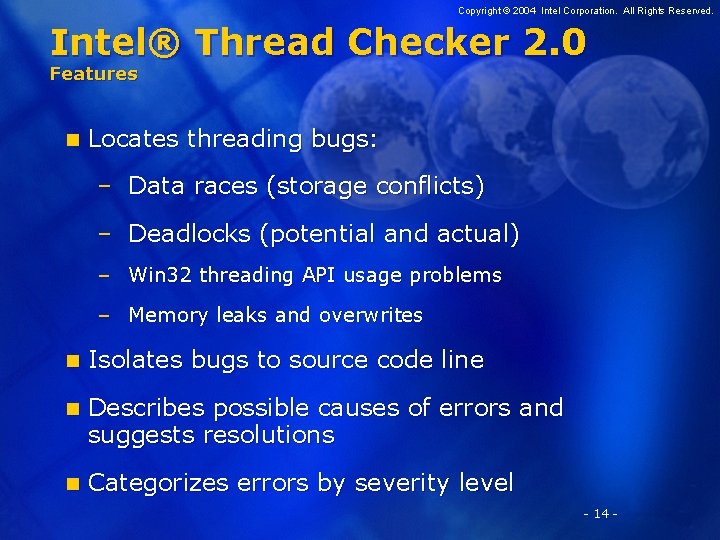
Copyright © 2004 Intel Corporation. All Rights Reserved. Intel® Thread Checker 2. 0 Features n Locates threading bugs: – Data races (storage conflicts) – Deadlocks (potential and actual) – Win 32 threading API usage problems – Memory leaks and overwrites n Isolates bugs to source code line n Describes possible causes of errors and suggests resolutions n Categorizes errors by severity level - 14 -

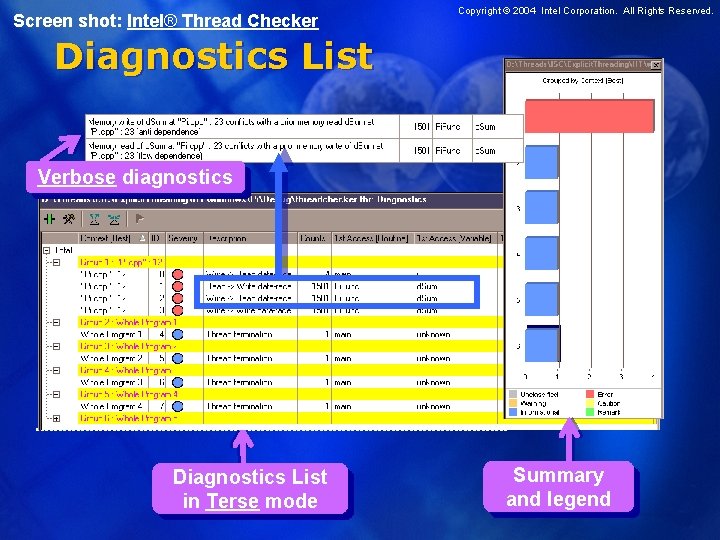
Screen shot: Intel® Thread Checker Copyright © 2004 Intel Corporation. All Rights Reserved. Diagnostics List Verbose diagnostics Diagnostics List in Terse mode Summary and legend - 15 -

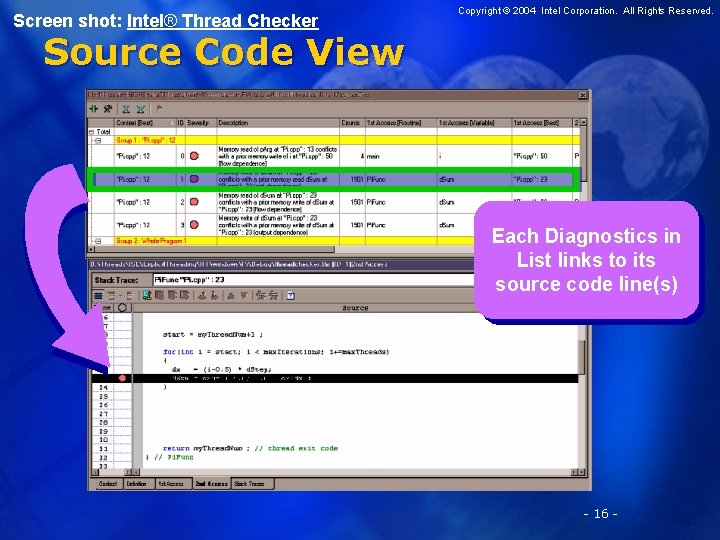
Screen shot: Intel® Thread Checker Copyright © 2004 Intel Corporation. All Rights Reserved. Source Code View Each Diagnostics in List links to its source code line(s) - 16 -

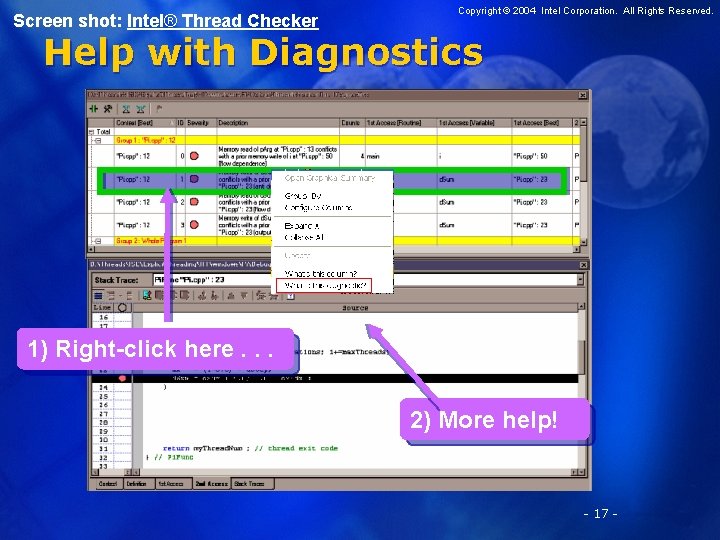
Screen shot: Intel® Thread Checker Copyright © 2004 Intel Corporation. All Rights Reserved. Help with Diagnostics 1) Right-click here. . . 2) More help! - 17 -

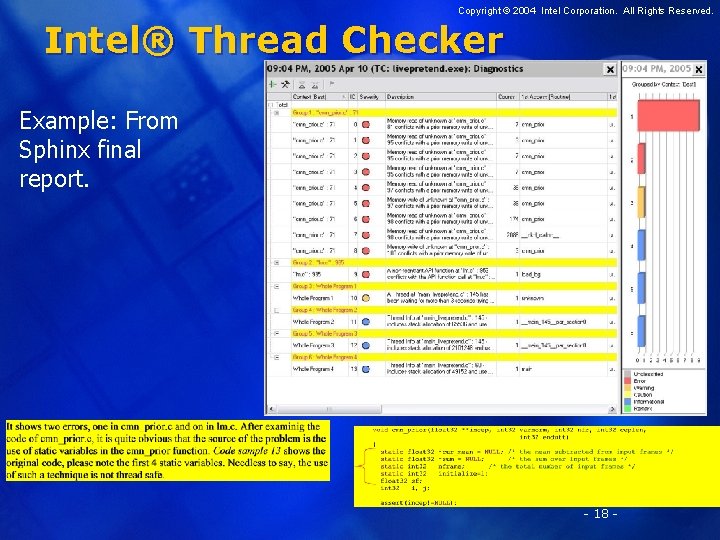
Copyright © 2004 Intel Corporation. All Rights Reserved. Intel® Thread Checker Example: From Sphinx final report. - 18 -

Copyright © 2004 Intel Corporation. All Rights Reserved. Threading, Performance n Check what percentage of the code is threaded. – Setting the upper bound for potential performance. – Can use VTune™ analyzer to see how much time each thread runs. – Check if the total instruction count of the threaded app is equal to the instruction count of the original app. • In many cases there is a huge overhead for threading, or just a bug (doing some work twice). n Evaluate the amount of parallel work. – Even if both threads spend the same amount of time, they may not be doing it at the same time. – If a (already debugged) threaded app runs much slower than the scalar app, look for false sharing issues: • “No, converting each local variable to an array of 2 variables is not a good idea for threading efficiency. ” From one of my meetings, trying to explain how come threaded app is 14 X slower than the original app. n Check the critical path. – Intel ® Thread profiler is great for the job after you figure out how to use it and its cryptic terminology. – Note that Win 32 API Thread Profiler is not the same tool as the Open. MP Thread Profiler. - 19 -

Intel® Threading Tools Copyright © 2004 Intel Corporation. All Rights Reserved. The Thread Profiler Feature n Pinpoints threading performance bottlenecks in apps threaded with: – Microsoft* Windows* threads on Microsoft* Windows* systems – POSIX* pthreads on Linux* systems – Open. MP* on Microsoft* Windows* and Linux* systems n Plugs into VTune™ environment – Microsoft* Windows* for IA-32 systems – Linux* for IA-32 systems *Other names and brands may be claimed as the property of others. - 20 -

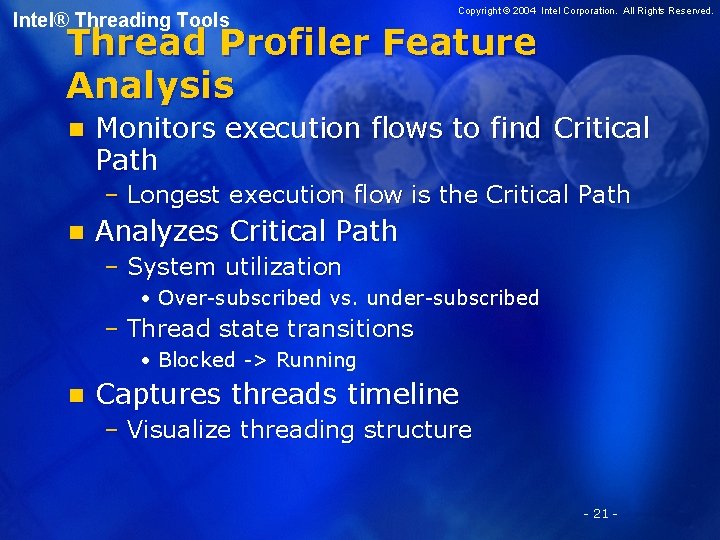
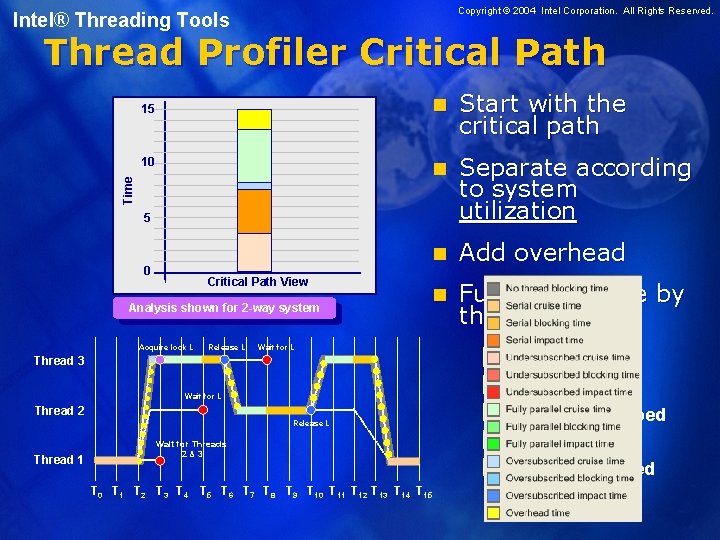
Intel® Threading Tools Copyright © 2004 Intel Corporation. All Rights Reserved. Thread Profiler Feature Analysis n Monitors execution flows to find Critical Path – Longest execution flow is the Critical Path n Analyzes Critical Path – System utilization • Over-subscribed vs. under-subscribed – Thread state transitions • Blocked -> Running n Captures threads timeline – Visualize threading structure - 21 -

Copyright © 2004 Intel Corporation. All Rights Reserved. Intel® Threading Tools Thread Profiler Critical Path 15 Time 10 n Start with the critical path n Separate according to system utilization n Add overhead n Further analyze by thread state 5 0 Critical Path View Analysis shown for 2 -way system Acquire lock L Release L Wait for L Thread 3 Wait for L Thread 2 Release L Thread 1 Wait for Threads 2&3 Cruise time Idle Overhead Serial Blocking time Under-subscribed Impact time Parallel Over-subscribed T 0 T 1 T 2 T 3 T 4 T 5 T 6 T 7 T 8 T 9 T 10 T 11 T 12 T 13 T 14 T 15 - 22 -

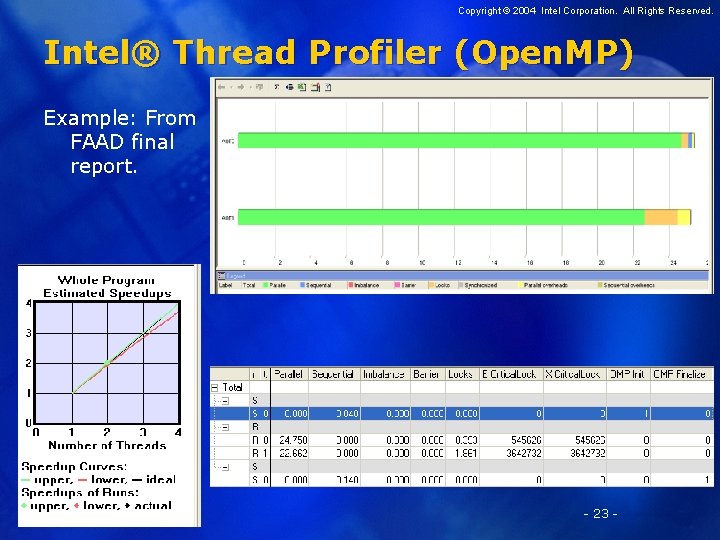
Copyright © 2004 Intel Corporation. All Rights Reserved. Intel® Thread Profiler (Open. MP) Example: From FAAD final report. - 23 -

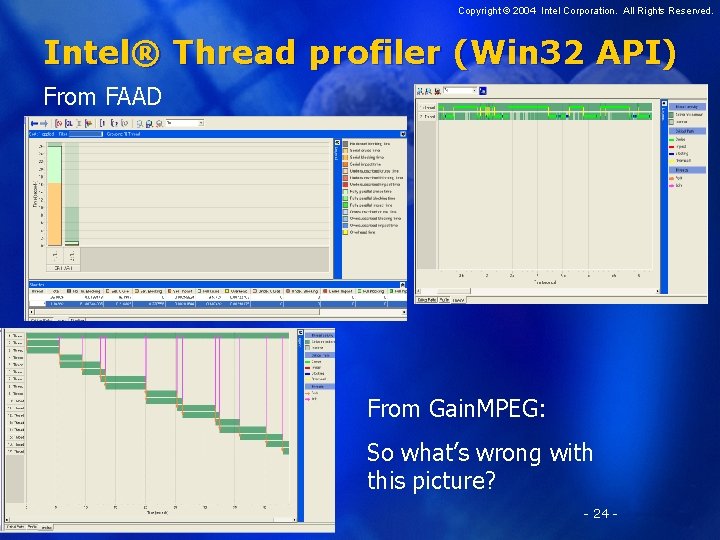
Copyright © 2004 Intel Corporation. All Rights Reserved. Intel® Thread profiler (Win 32 API) From FAAD From Gain. MPEG: So what’s wrong with this picture? - 24 -

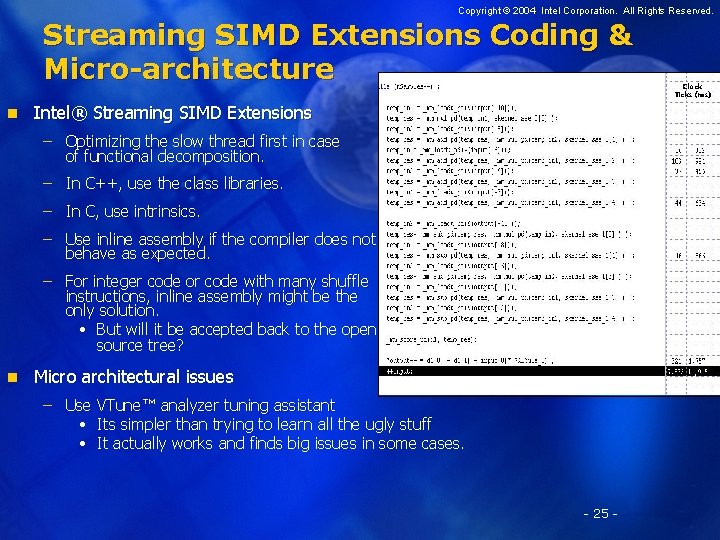
Copyright © 2004 Intel Corporation. All Rights Reserved. Streaming SIMD Extensions Coding & Micro-architecture n Intel® Streaming SIMD Extensions – Optimizing the slow thread first in case of functional decomposition. – In C++, use the class libraries. – In C, use intrinsics. – Use inline assembly if the compiler does not behave as expected. – For integer code or code with many shuffle instructions, inline assembly might be the only solution. • But will it be accepted back to the open source tree? n Micro architectural issues – Use VTune™ analyzer tuning assistant • Its simpler than trying to learn all the ugly stuff • It actually works and finds big issues in some cases. - 25 - Clock Ticks (ms)

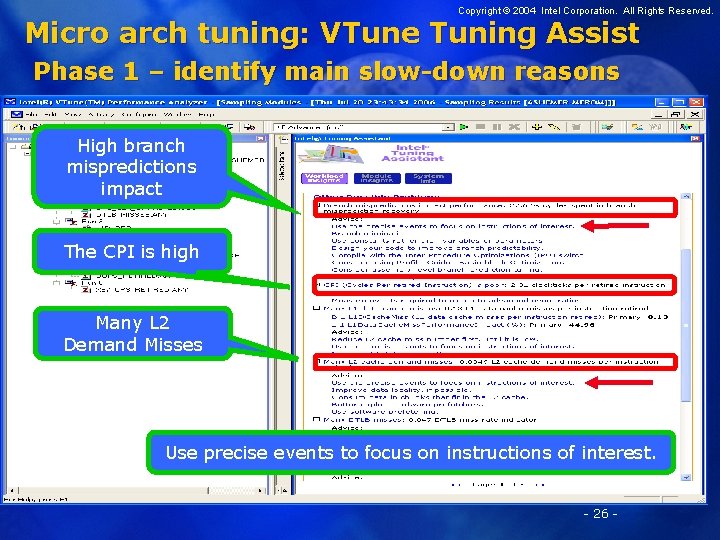
Copyright © 2004 Intel Corporation. All Rights Reserved. Micro arch tuning: VTune Tuning Assist Phase 1 – identify main slow-down reasons High branch mispredictions impact The CPI is high Many L 2 Demand Misses Use precise events to focus on instructions of interest. - 26 -

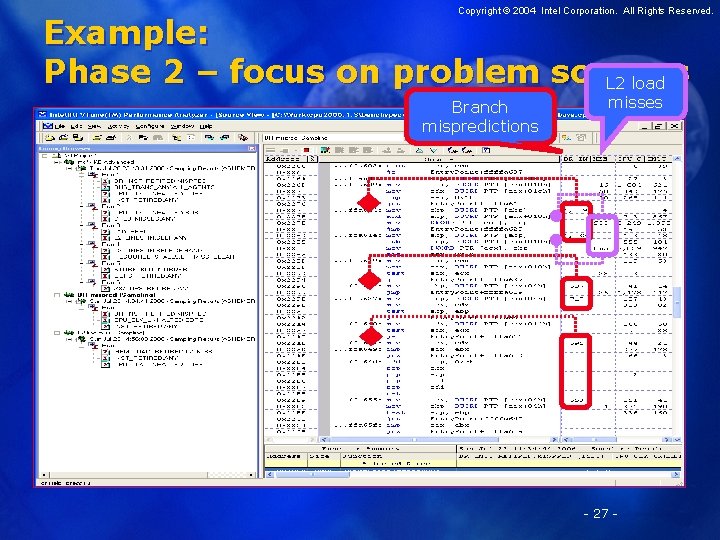
Copyright © 2004 Intel Corporation. All Rights Reserved. Example: Phase 2 – focus on problem sources L 2 load Branch mispredictions misses - 27 -

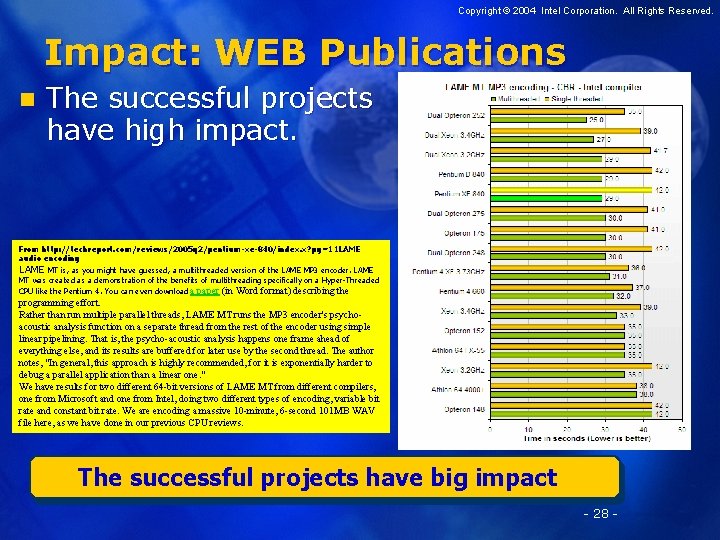
Copyright © 2004 Intel Corporation. All Rights Reserved. Impact: WEB Publications n The successful projects have high impact. From http: //techreport. com/reviews/2005 q 2/pentium-xe-840/index. x? pg=11 LAME audio encoding LAME MT is, as you might have guessed, a multithreaded version of the LAME MP 3 encoder. LAME MT was created as a demonstration of the benefits of multithreading specifically on a Hyper-Threaded CPU like the Pentium 4. You can even download a paper (in Word format) describing the programming effort. Rather than run multiple parallel threads, LAME MT runs the MP 3 encoder's psychoacoustic analysis function on a separate thread from the rest of the encoder using simple linear pipelining. That is, the psycho-acoustic analysis happens one frame ahead of everything else, and its results are buffered for later use by the second thread. The author notes, "In general, this approach is highly recommended, for it is exponentially harder to debug a parallel application than a linear one. " We have results for two different 64 -bit versions of LAME MT from different compilers, one from Microsoft and one from Intel, doing two different types of encoding, variable bit rate and constant bit rate. We are encoding a massive 10 -minute, 6 -second 101 MB WAV file here, as we have done in our previous CPU reviews. The successful projects have big impact - 28 -

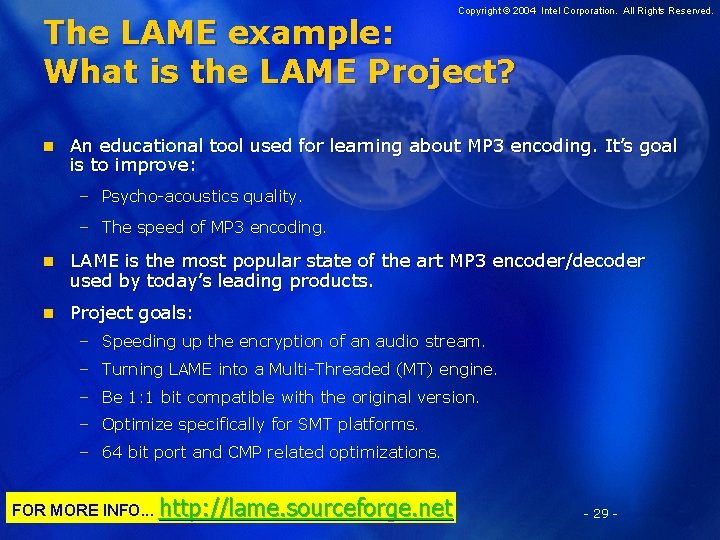
Copyright © 2004 Intel Corporation. All Rights Reserved. The LAME example: What is the LAME Project? n An educational tool used for learning about MP 3 encoding. It’s goal is to improve: – Psycho-acoustics quality. – The speed of MP 3 encoding. n LAME is the most popular state of the art MP 3 encoder/decoder used by today’s leading products. n Project goals: – Speeding up the encryption of an audio stream. – Turning LAME into a Multi-Threaded (MT) engine. – Be 1: 1 bit compatible with the original version. – Optimize specifically for SMT platforms. – 64 bit port and CMP related optimizations. FOR MORE INFO. . . http: //lame. sourceforge. net - 29 -

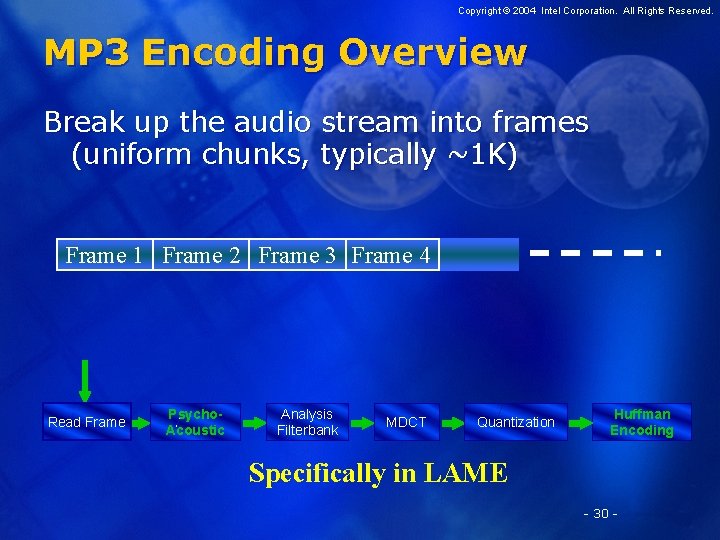
Copyright © 2004 Intel Corporation. All Rights Reserved. MP 3 Encoding Overview Break up the audio stream into frames (uniform chunks, typically ~1 K) Frame 1 Frame. Audio 2 Frame Stream 3 Frame 4 Read Frame Perceptual Psycho. Acoustic Model Analysis Filterbank MDCT Quantization Bitstream Huffman Encoding Encode Specifically in LAME - 30 -

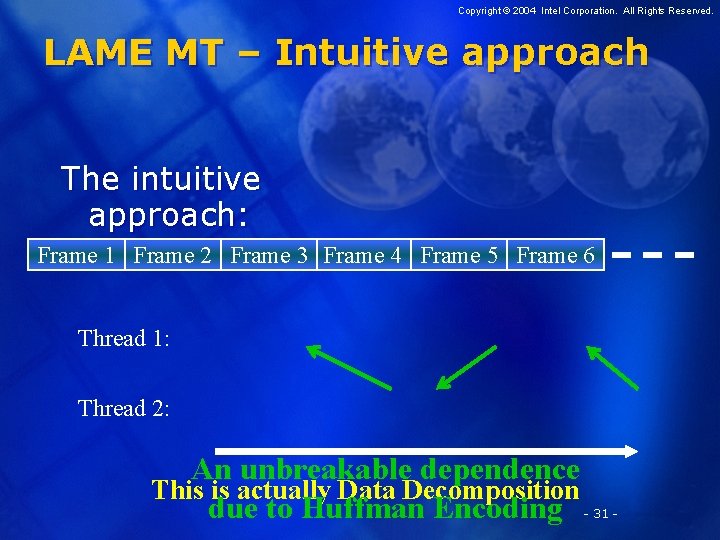
Copyright © 2004 Intel Corporation. All Rights Reserved. LAME MT – Intuitive approach The intuitive approach: Frame 1 Frame 2 Frame 3 Frame 4 Frame 5 Frame 6 Thread 1: Thread 2: An unbreakable dependence This is actually Data Decomposition due to Huffman Encoding - 31 -

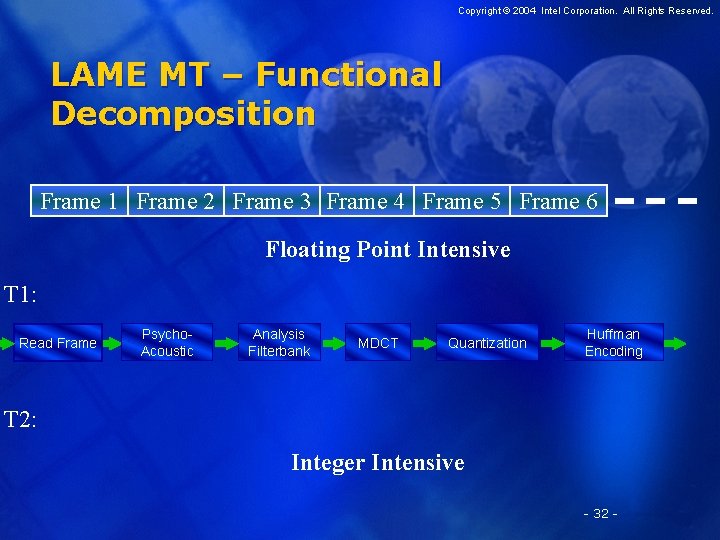
Copyright © 2004 Intel Corporation. All Rights Reserved. LAME MT – Functional Decomposition Frame 1 Frame 2 Frame 3 Frame 4 Frame 5 Frame 6 Floating Point Intensive T 1: Read Frame Psycho. Acoustic Analysis Filterbank MDCT Quantization Huffman Encoding T 2: Integer Intensive - 32 -

Copyright © 2004 Intel Corporation. All Rights Reserved. Results - 33 -

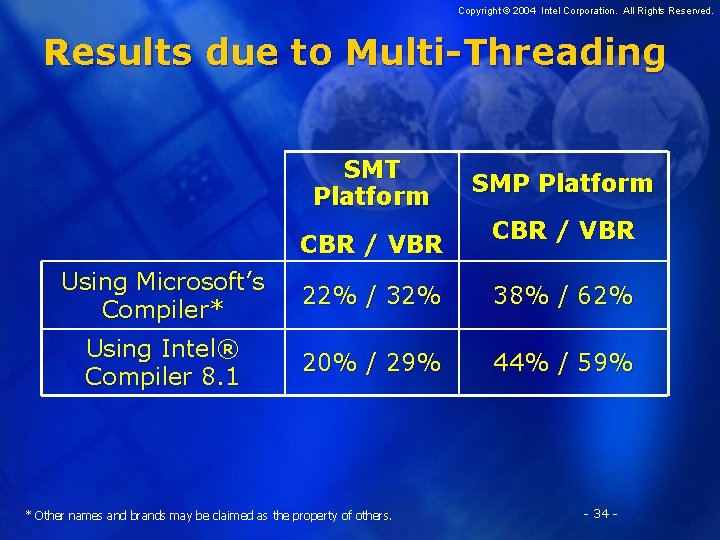
Copyright © 2004 Intel Corporation. All Rights Reserved. Results due to Multi-Threading SMT Platform CBR / VBR SMP Platform CBR / VBR Using Microsoft’s Compiler* 22% / 32% 38% / 62% Using Intel® Compiler 8. 1 20% / 29% 44% / 59% * Other names and brands may be claimed as the property of others. - 34 -

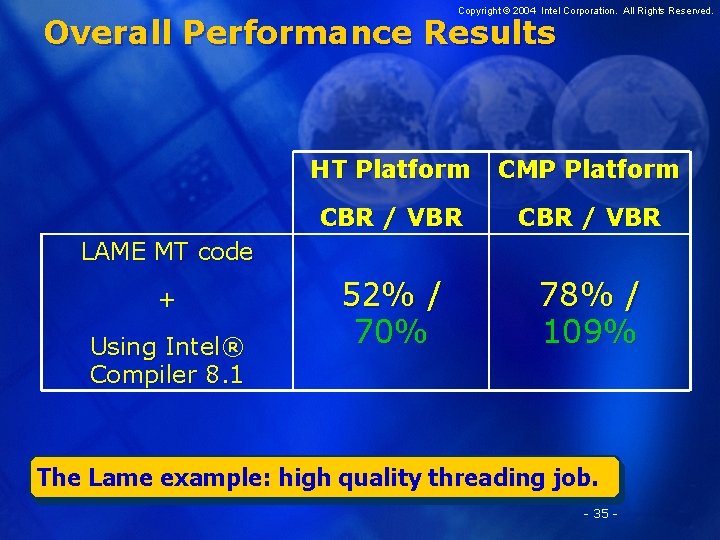
Copyright © 2004 Intel Corporation. All Rights Reserved. Overall Performance Results HT Platform CMP Platform CBR / VBR 52% / 70% 78% / 109% LAME MT code + Using Intel® Compiler 8. 1 The Lame example: high quality threading job. - 35 -

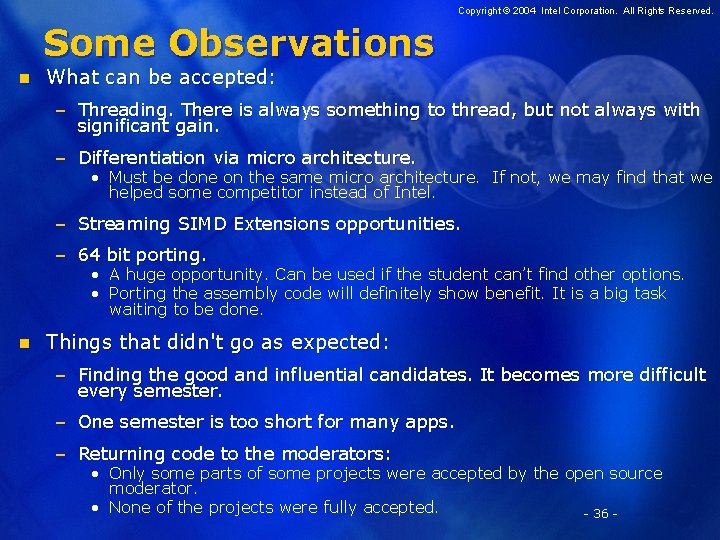
Copyright © 2004 Intel Corporation. All Rights Reserved. Some Observations n What can be accepted: – Threading. There is always something to thread, but not always with significant gain. – Differentiation via micro architecture. • Must be done on the same micro architecture. If not, we may find that we helped some competitor instead of Intel. – Streaming SIMD Extensions opportunities. – 64 bit porting. • A huge opportunity. Can be used if the student can’t find other options. • Porting the assembly code will definitely show benefit. It is a big task waiting to be done. n Things that didn't go as expected: – Finding the good and influential candidates. It becomes more difficult every semester. – One semester is too short for many apps. – Returning code to the moderators: • Only some parts of some projects were accepted by the open source moderator. • None of the projects were fully accepted. - 36 -

Copyright © 2004 Intel Corporation. All Rights Reserved. Backup - 37 -