Coordinated experiments to identify roles of different factors


 wind forcing in")
![Freshwater content (m, colors and thin blue lines) from EWG atlas [1997, 1998] calculated](https://slidetodoc.com/presentation_image_h2/a35f71b6bd640cda1210fcc84c7c3fa1/image-13.jpg "Freshwater content (m, colors and thin blue lines) from EWG atlas [1997, 1998] calculated")
 FWC (m, thin lines and colors) and SLP")
 and ICMMG (right) model results for Beaufort Gyre")
 wind forcing in")
 and J. Morison")

: Surface circulation 0 m RAS model")
: COCO model 2007 300 m circulation 300 m RAS model")
: 20 years UW model results (2007): 20 years Freshwater content")
: 20 years COCO model results (1989): 20 years Flux of")


- Slides: 30
Coordinated experiments to identify roles of different factors in the ocean dynamics and hydrography Andrey Proshutinsky 1, Eiji Watanabe 2, Elena Golubeva 3, Christophe Herbaut 4, Marie-Noelle Houssais 4, Jiayan Yang 1, Jinlun Zhang 5, Yevgeny Aksenov 6 and Beverly de Cuevas 6 1 Woods Hole Oceanographic Institution, Woods Hole, MA, USA 2 Tokyo University of Marine Science and Technology, Tokyo, Japan. 3 Institute of Computational Mathematics and Mathematical Geophysics, Novosibirsk, Russia 4 Université Pierre et Marie Curie, Paris, France 5 University of Washington, Seattle, USA 6 National Oceanography Centre, Southampton, UK
Motivation for coordinated idealized circulation experiments • Theory, observations and model results allow us to conclude that both thermohaline and wind-driven forcing are important to the Arctic Ocean’s dynamics and thermodynamics (hydrography and circulation). • But unfortunately, the role of individual factors in the circulation and hydrographic fields cannot be easily evaluated because observed temperature and salinity distributions reflect the combined effects of wind, baroclinicity, and topographic interaction. • Through numerical modeling, however, the relative strengths of the circulations and major features of hydrographic fields arising from atmospheric driving and thermohaline driving can be assessed and compared
Ø Role of wind forcing Ø Role of thermal forcing Ø Role of fast ice
Wind experiment Major idea is to investigate the role of wind forcing in the processes of freshwater, circulation and hydrography shaping Anticyclonic wind Sea surface Ekman transport Conditions: ocean is a closed domain without fluxes via ocean boundaries, no river runoff, precipitation and evaporation. There is no sea ice and only wind is a driving force Densi ty 400 m Initial conditions: horizontally uniform water temperature and salinity fields with a vertical stratification corresponding to mean parameters Forcing: Annual wind stresses calculated based corresponding to a) upper mixed layer, on annual SLPs for a) 1989 and b) 2007 (AOMIP b) Pacific water layer, c) Atlantic water layer and d) deep waters. recommended algorithm) Run model for 20 years and analyze T, S, circulation, FWC and HC
To investigate the roles of wind and thermal forcing driving the Arctic Ocean changes we have designed several idealized experiments minimizing effects of secondary factors as much as possible and sometimes simply neglecting their influences. Arctic Ocean model domain (common grid) used for idealized experiment analysis. Solid black line shows 55⁰N latitude where closed boundary conditions (vertical wall) were applied. Idealized (blue) temperature (left) and salinity (right) profiles used as initial conditions for model runs. Black and red lines show winter T and S profiles from observations (EWG, 1997) in the Eurasian and Canadian Basins, respectively
Forcing for WIND experiment H L L H L In wind-only experiments we forced the ice free ocean for 20 years by the 2007 (anticyclonic) and 1989 (cyclonic) annual mean wind stresses derived from NCAR/NCEP SLP fields (Figure 4) following the AOMIP-recommended algorithm described on the AOMIP web site (www. whoi. edu/projects/AOMIP).
“ Thermo” experiment Major idea is to investigate a role of thermal forcing (air temperature drives variability of freshwater content and water circulation via sea ice and ocean hydrography transformations) Conditions: ocean is a closed domain without fluxes via ocean boundaries, no river runoff, precipitation and evaporation. There is no wind. Clouds are annual mean, and wind speed for calculation of heat fluxes is 5 m/s. Humidity is annual mean. Initial conditions: horizontally uniform water temperature and salinity fields with a vertical stratification corresponding to mean: a) upper mixed layer, Pacific waters, Atlantic water layer and deep waters. Forcing: Monthly air temperatures for a) 1989 and b) 2007 conditions
Thermodynamic: Cooling/warming Non-uniform seasonally and interannually changing and salt release Freshening Arctic cooling and warming Sea surface ICE accompanied by ice Mixing formation and melting y results in the formation of Densit horizontal water density and sea surface gradients and 400 m system of currents. Fresh water transformations due to this processes can drive “thermodynamic” or “baroclinic” circulation Cooling, ice formation Freshening.
Forcing for THERMO experiment This experiment was designed to evaluate the role of air temperature forcing, assuming that all other factors are negligible. Model domain and all other initial and forcing conditions were similar to the “wind” experiment except that in the “thermo” experiment there was no wind and the ocean was only forced by monthly mean surface air temperatures for 2007 and 1989 derived from NCAR/NCEP reanalysis product. The experiment was started with an initially ice-free ocean.
WIND experiment results Freshwater content after 20 years of 2007 (anticyclonic) wind forcing in four AOMIP models.
Freshwater content (m, colors and thin blue lines) from EWG atlas [1997, 1998] calculated relative to reference salinity of 34. 8 for 1950 s, 1960 s, 1970 s, and 1980 s and decadal SLP (h. Pa, black thick lines) from NCAR/NCEP reanalysis for the same decades, respectively.
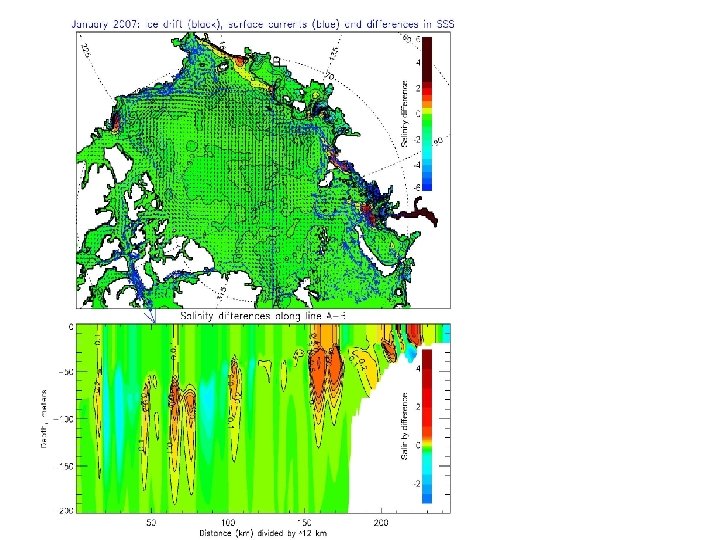
Top panel shows observed (EWG, 1997) FWC (m, thin lines and colors) and SLP (h. Pa, black thick lines) for 1970 s. Bottom panel shows distribution of salinity at section A-B (upper panel). Dotted horizontal lines in bottom panels depict vertical salinity distribution at the moment of model initializations. Right panels are similar to left ones but show parameters from the COCO model after 20 years of run under 2007 wind forcing.
WIND experiment results Top: COCO (left) and ICMMG (right) model results for Beaufort Gyre showing SLP (h. Pa, thick black lines) and FWC (m, colors and thin lines) under 2007 wind forcing. Bottom panels show salinity distributions along A-B section depicted in upper panels. Dotted horizontal lines in bottom panels depict vertical salinity distribution at the moment of model initializations.
WIND experiment results Freshwater content after 20 years of 1989 (cyclonic) wind forcing in four AOMIP models.
NOTE: significant halocline changes were reported by Steele and Boyd (1998) and J. Morison reported a shift in the front between Pacific and Atlantic waters Top: COCO (left) and ICMMG (right) model results for Beaufort Gyre showing SLP (h. Pa, thick black lines) and FWC (m, colors and thin lines) under 1989 wind forcing. Bottom panels show salinity distributions along A-B section depicted in upper panels.
Temporal evolution of freshwater accumulation and role of Ekman Pumping. Evolution of V velocity in the vicinity of BG center. After one month (solid black line): practically pure velocity profile showing Ekman layer. Then due to accumulation of potential energy and deformation of T-S structure the velocity is a combination of Ekman one and a component associated with TS field deformation Left: Simulated currents at 20 m after 1 month of wind forcing and trajectories of “particles” driven by these currents. All trajectories indicate freshwater accumulation in the center of BG. Right: same as in left panel but after 20 years. Particle trajectories are closed and the BG FW content is saturated and no more FW accumulation is possible under this forcing.
Anticyclonic wind UW model 2007 (2007): Surface circulation 0 m RAS model
Anticyclonic wind (2007): COCO model 2007 300 m circulation 300 m RAS model
COCO model results (2007): 20 years UW model results (2007): 20 years Freshwater content (m) and surface circulation SAT, Ice thickness, FWC and SSH along A-B Salinity along A-B
RAS model results (1989): 20 years COCO model results (1989): 20 years Flux of Atlantic water inflow west of Spitsbergen is well developed. There is a lot of heat of AW layer in the RAS model but most of heat in COCO model is disappeared and ice is much thicker in the COCO model Note AW boundary flow west of Spitsbergen
Mean currents in the upper 200 m layer: COCO model, 2007 thermoexperiment
Mean currents in the upper 200 m layer: COCO model, 1989 thermoexperiment
“Fast ice” experiment: In order to better understand the role of sea ice dynamics in the simulated sea ice thickness in the regions of prevailing immobile fast ice conditions, we conducted two numerical experiments with ORCA model. All parameters and forcing conditions in these experiments were identical except that in our second experiment we introduced an empirical algorithm to parameterize immobile fast ice. In this algorithm, we assumed that in the regions with depths less than 28 m (typical observed fast-ice edge locations) and for times after 1 November and until 1 May, sea ice does not move and therefore cannot be deformed and/or ridged. Differences in sea ice thickness between control and experimental model runs after 10 years of simulation (1983– 1992)
Experimental model run started in 1983 with initial conditions corresponding to conditions of the control model run which started in 1957 after model initiation. Sea ice thickness differences (m) in December 1992 between ORCA model run with algorithmically introduced fast ice formation and break up and corresponding control run. Both control and experimental model setups and forcing were identical except fast ice presence in the experimental model run. Negative values show decrease of ice thickness in fast ice simulations. Position of the fast ice edge marked with thick gray line. Duration of model integrations is 10 years (1983– 1992).
Concluding remarks 1. Wind plays a very strong role in the formation of the Arctic Ocean hydrographic fields and their temporal and spatial variability (major hydrography, circulation, heat and freshwater content). 2. Variability of thermal forcing drives convection, responsible for sea ice seasonal and interannual variations but also plays a role in the variability of Atlantic water inflow via Fram Strait: it drives more Atlantic water in the Arctic during cold seasons (years) and less during Arctic atmosphere warming.
Concluding remarks 3. Fast ice edge is a source of numerous eddies generated by winds because of significant wind stress gradients at the edge at boundary of immobile fast ice and open water of pack ice. These eddies propagate from the ice edge in all directions following to the major flow of the wind-driven and geostrophic circulation.