Cooling Tower Performance The Experiment Design and Rubric

Cooling Tower Performance : The Experiment Design and Rubric Standard Expectation

Outline • • Objectives Design of experiment Graph Example Rubric Standard Expectation (How to meet the expectation on rubric)

Objectives • Understand how the cooling tower works • Use the psychrometric chart properly • Calculate effectiveness, cooling range, approach • Create proper graphs for taking the conclusion (effect of air flowrate, effect of water flowrate)

Design of Experiment • 1 st objective: student learn performance of cooling tower from sensible and latent heat processes (different number of effectiveness) and effects of air flowrate and water flowrate • 2 nd objective : student learn how to use the psychrometric chart properly (searching for the specific humidity, specific volume, specific entalphy)

Design of Experiment • 3 rd objective : student calculate from their data, effectiveness, cooling range and approach • 4 th objective : student learn how to create graphs for seeking the conclusion (plot of water flowrates vs cooling range and effectiveness, and plot of air flowrates vs cooling range and effectiveness). The student have to be carefull in selecting their results (searching for equal treatments except the independent variable)
 Water flowrate (I)/Effectiveness and Cooling Range 2) Air flowrate")
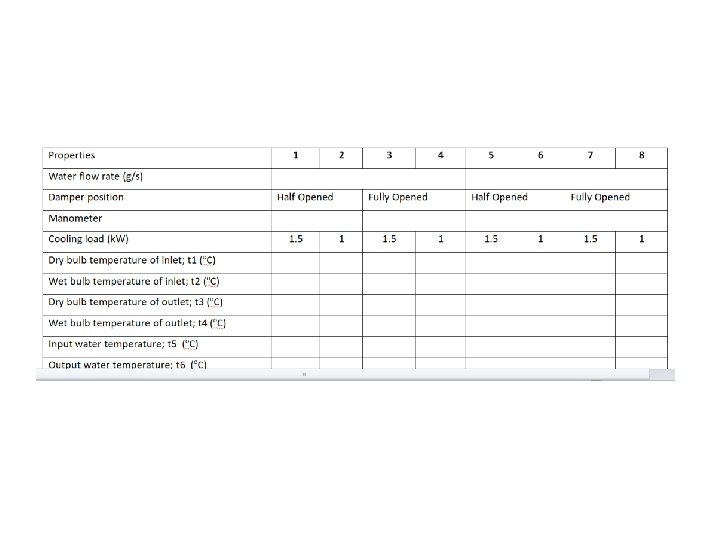
4 th Graphs : 1) Water flowrate (I)/Effectiveness and Cooling Range 2) Air flowrate (I)/Effectiveness and cooling range set variables : Water flowrate (I, T), Air pressure (T), Load (T) experiment Data : T 1, T 2, T 3, T 4, T 5, T 6 2 nd Effectiveness (D), Cooling Range (D) Approach (D) Air flowrate (I) 3 rd theory 1 st Conclusion, Effect of air flowrate Effect of water flowarate psychrometric discussion

Effect of water flowrate

Effect of air flowrate

Rubric Standard Expectation

Rubric Standard Expectation

Rubric Standard Expectation

Rubric Standard Expectation
- Slides: 13