
Cook County Health Hospitals System Strategic Planning Stakeholders



- Slides: 32
Cook County Health & Hospitals System: Strategic Planning Stakeholders Forum November 14, 2008 UIC Student Center West 828 South Wolcott, 3: 00 p. m.
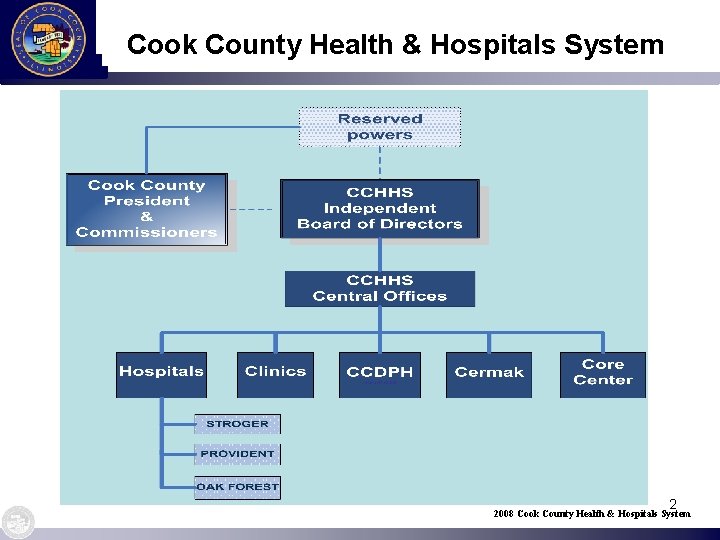
Cook County Health & Hospitals System 2 2008 Cook County Health & Hospitals System
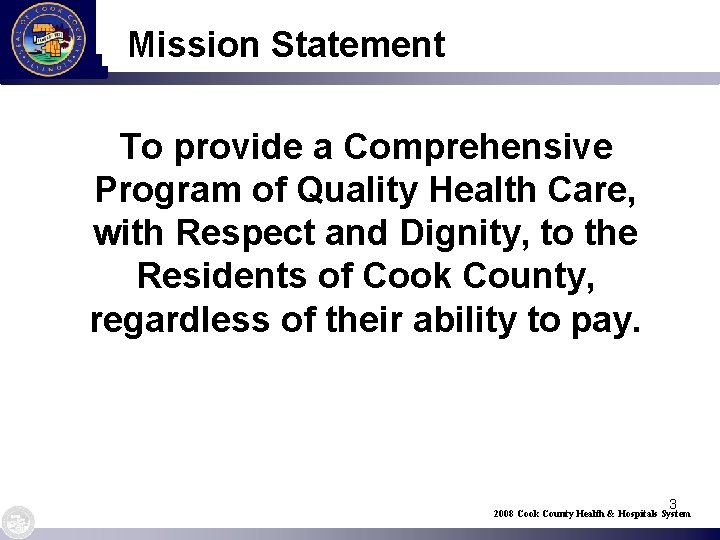
Mission Statement To provide a Comprehensive Program of Quality Health Care, with Respect and Dignity, to the Residents of Cook County, regardless of their ability to pay. 3 2008 Cook County Health & Hospitals System
Today’s Goals • An overview of the strategic planning process and objectives. • An overview of our preliminary findings on the current environment. 4 2008 Cook County Health & Hospitals System
Planning Process Strategic Goals • Securing the operational stability of the CCHHS. • Developing more specific long term goals (in spite of immediate challenges). 5 2008 Cook County Health & Hospitals System
Planning Process First Steps • Gathering, analyzing and interpreting data from the external environment. • Community participation in the planning process to solicit feedback and ensure transparency. 6 2008 Cook County Health & Hospitals System
Initial Findings • Changes in the surrounding communitypopulation shifts, economic changes, birth rates • Changes in Cook County Health & Hospitals System (CCHHS) • Changing external forces will affect the future. • Existing internal forces will affect the future. 7 2008 Cook County Health & Hospitals System
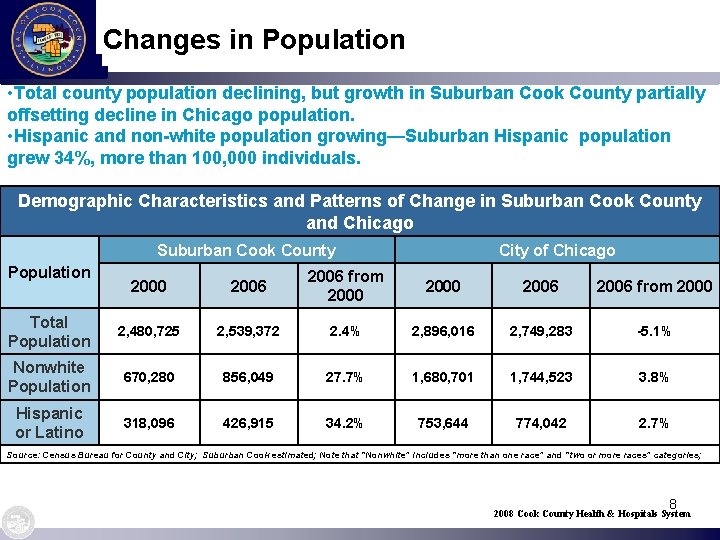
Changes in Population • Total county population declining, but growth in Suburban Cook County partially offsetting decline in Chicago population. • Hispanic and non-white population growing—Suburban Hispanic population grew 34%, more than 100, 000 individuals. Demographic Characteristics and Patterns of Change in Suburban Cook County and Chicago Suburban Cook County Population Total Population 2000 2006 from 2000 2, 480, 725 2, 539, 372 2. 4% 2, 896, 016 2, 749, 283 -5. 1% 856, 049 27. 7% 1, 680, 701 1, 744, 523 3. 8% 426, 915 34. 2% 753, 644 774, 042 2. 7% Nonwhite 670, 280 Population Hispanic or Latino City of Chicago 318, 096 Source: Census Bureau for County and City; Suburban Cook estimated; Note that “Nonwhite” includes “more than one race” and “two or more races” categories; 8 2008 Cook County Health & Hospitals System
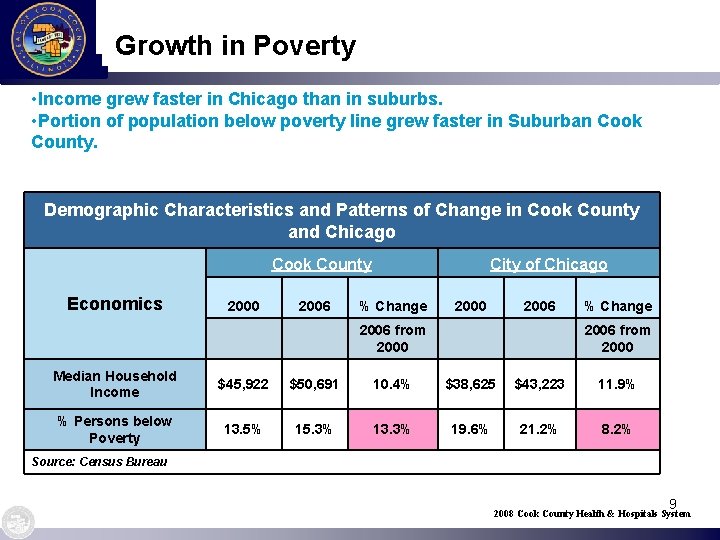
Growth in Poverty • Income grew faster in Chicago than in suburbs. • Portion of population below poverty line grew faster in Suburban Cook County. Demographic Characteristics and Patterns of Change in Cook County and Chicago Cook County Economics City of Chicago 2000 2006 % Change 2006 from 2000 Median Household Income $45, 922 $50, 691 10. 4% $38, 625 $43, 223 11. 9% % Persons below Poverty 13. 5% 15. 3% 13. 3% 19. 6% 21. 2% 8. 2% Source: Census Bureau 9 2008 Cook County Health & Hospitals System
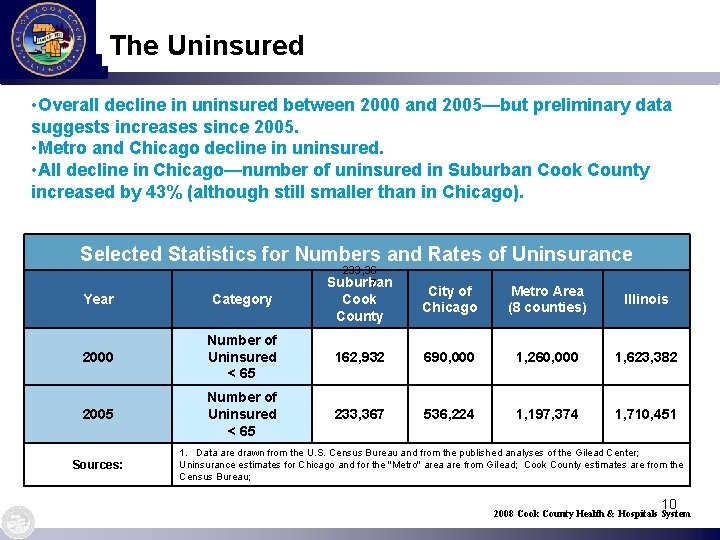
The Uninsured • Overall decline in uninsured between 2000 and 2005—but preliminary data suggests increases since 2005. • Metro and Chicago decline in uninsured. • All decline in Chicago—number of uninsured in Suburban Cook County increased by 43% (although still smaller than in Chicago). Selected Statistics for Numbers and Rates of Uninsurance 233, 36 Year Category 7 Suburban Cook County 2000 Number of Uninsured < 65 162, 932 690, 000 1, 260, 000 1, 623, 382 2005 Number of Uninsured < 65 233, 367 536, 224 1, 197, 374 1, 710, 451 Sources: City of Chicago Metro Area Illinois (8 counties) 1. Data are drawn from the U. S. Census Bureau and from the published analyses of the Gilead Center; Uninsurance estimates for Chicago and for the "Metro" area are from Gilead; Cook County estimates are from the Census Bureau; 10 2008 Cook County Health & Hospitals System
Births Declining – Faster in Chicago • Births are declining everywhere in the County • More slowly in Suburban Cook County Number of Live Births by Place and Township YEAR Place of Residence 2002 2005 % Change 20022005 Cook County 81, 567 77, 891 -4. 51% Chicago 47, 958 45, 218 -5. 71% Suburban Cook 33, 609 32, 673 -2. 78% Source: Cook County Department of Public Health 11 2008 Cook County Health & Hospitals System
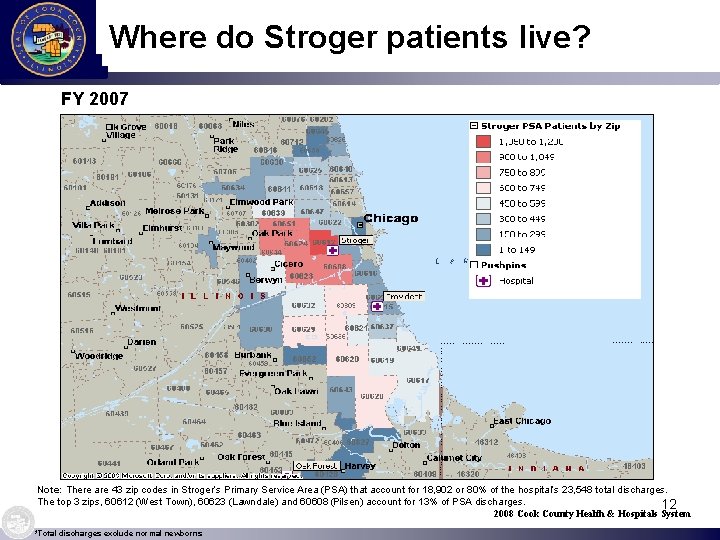
Where do Stroger patients live? FY 2007 Note: There are 43 zip codes in Stroger’s Primary Service Area (PSA) that account for 18, 902 or 80% of the hospital’s 23, 548 total discharges. The top 3 zips, 60612 (West Town), 60623 (Lawndale) and 60608 (Pilsen) account for 13% of PSA discharges. 12 2008 Cook County Health & Hospitals System *Total discharges exclude normal newborns
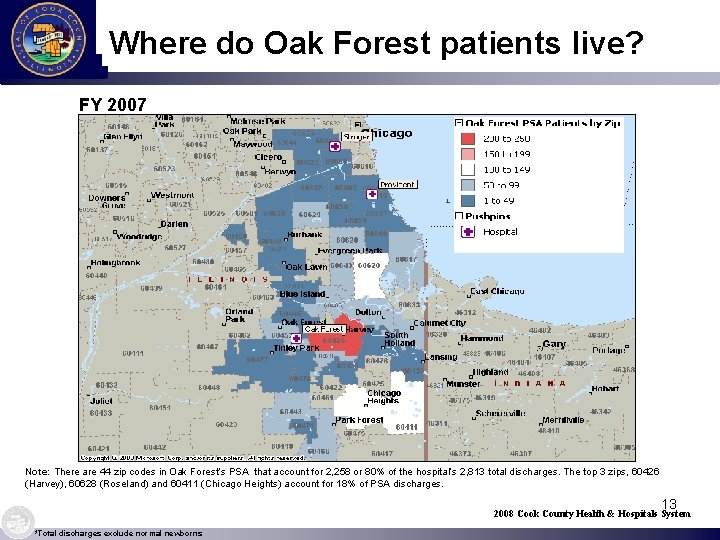
Where do Oak Forest patients live? FY 2007 Note: There are 44 zip codes in Oak Forest’s PSA that account for 2, 258 or 80% of the hospital’s 2, 813 total discharges. The top 3 zips, 60426 (Harvey), 60628 (Roseland) and 60411 (Chicago Heights) account for 18% of PSA discharges. 13 2008 Cook County Health & Hospitals System *Total discharges exclude normal newborns
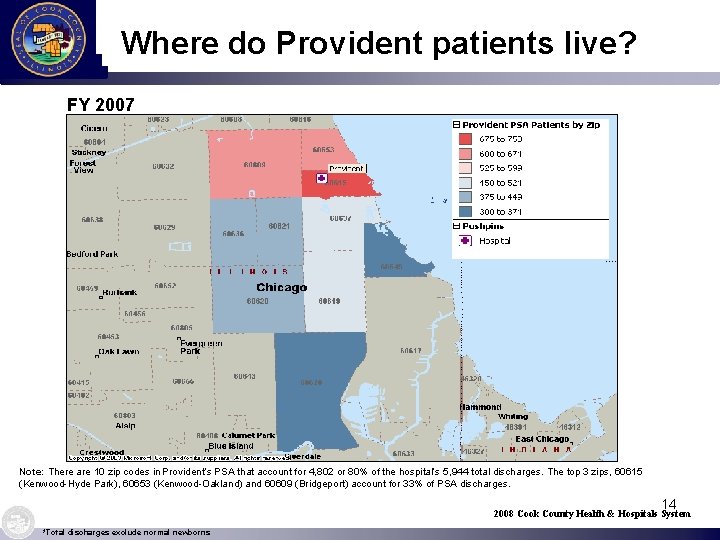
Where do Provident patients live? FY 2007 Note: There are 10 zip codes in Provident’s PSA that account for 4, 802 or 80% of the hospital’s 5, 944 total discharges. The top 3 zips, 60615 (Kenwood-Hyde Park), 60653 (Kenwood-Oakland) and 60609 (Bridgeport) account for 33% of PSA discharges. 14 2008 Cook County Health & Hospitals System *Total discharges exclude normal newborns
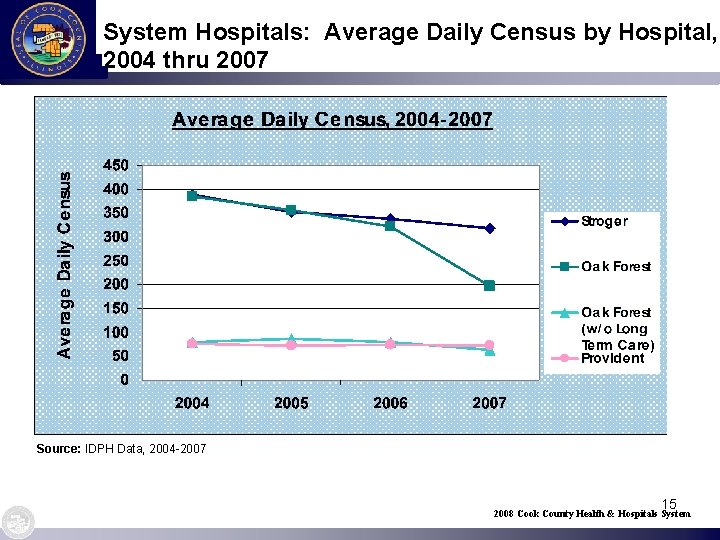
System Hospitals: Average Daily Census by Hospital, 2004 thru 2007 Source: IDPH Data, 2004 -2007 15 2008 Cook County Health & Hospitals System
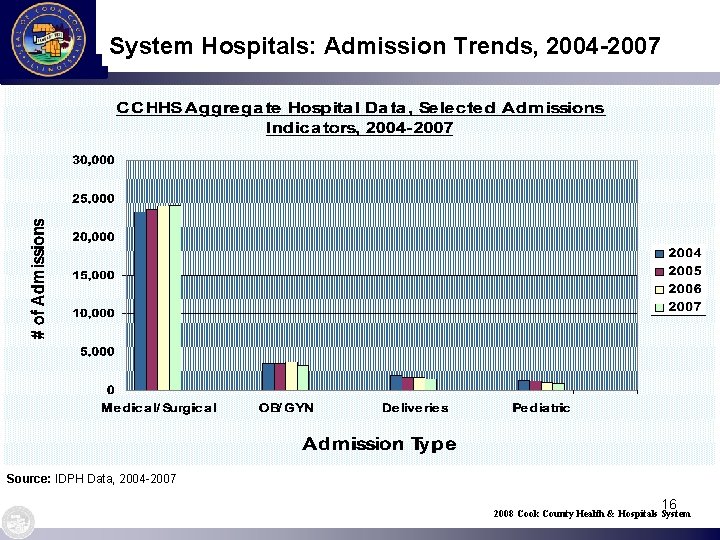
System Hospitals: Admission Trends, 2004 -2007 Source: IDPH Data, 2004 -2007 16 2008 Cook County Health & Hospitals System
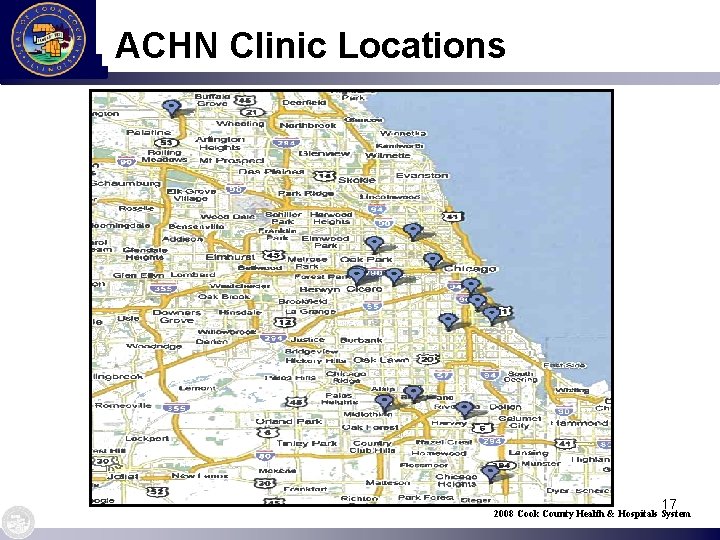
ACHN Clinic Locations 17 2008 Cook County Health & Hospitals System
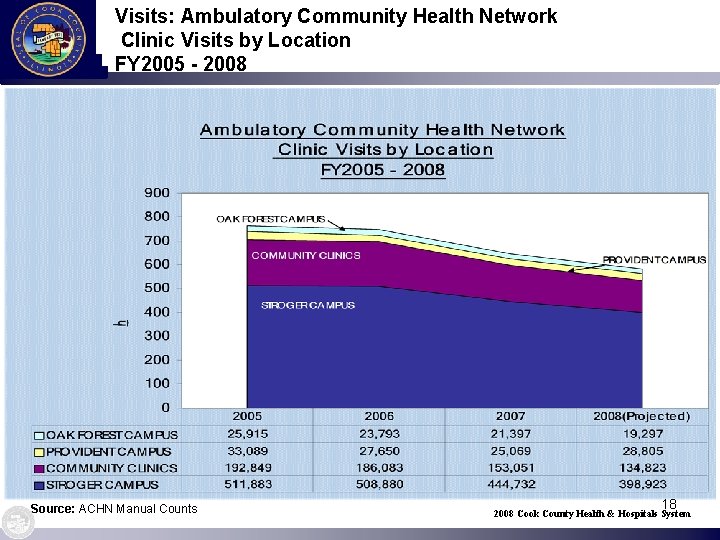
Visits: Ambulatory Community Health Network Clinic Visits by Location FY 2005 - 2008 Source: ACHN Manual Counts 18 2008 Cook County Health & Hospitals System
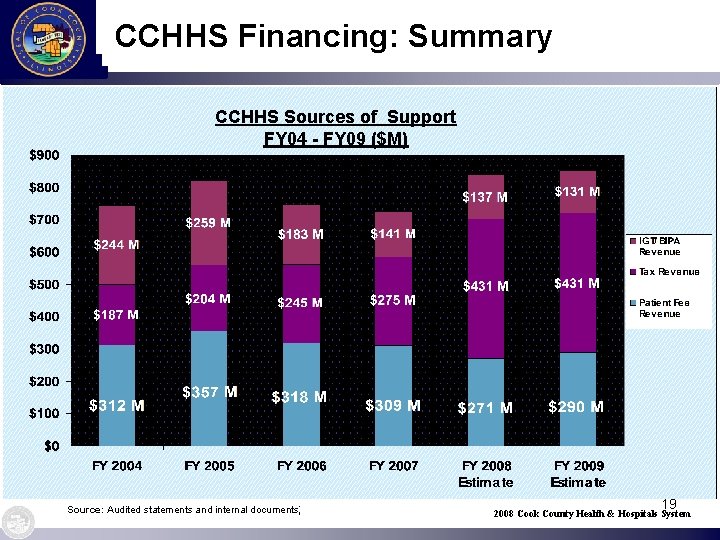
CCHHS Financing: Summary CCHHS Sources of Support FY 04 - FY 09 ($M) 1. 66 Bill 2. 02 Bill 1. 88 Bill 1. 74 Bill 1. 79 Bill 1. 71 Bill Source: Audited Financial Statements, FY 04 -08; Management estimate for FY 08 -FY 09 Source: Audited statements and internal documents; 19 2008 Cook County Health & Hospitals System
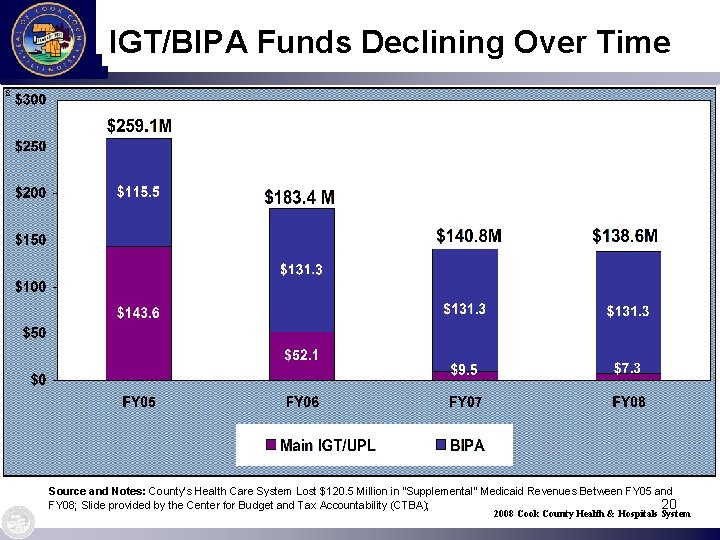
IGT/BIPA Funds Declining Over Time Source and Notes: County’s Health Care System Lost $120. 5 Million in “Supplemental” Medicaid Revenues Between FY 05 and FY 08; Slide provided by the Center for Budget and Tax Accountability (CTBA); 20 2008 Cook County Health & Hospitals System
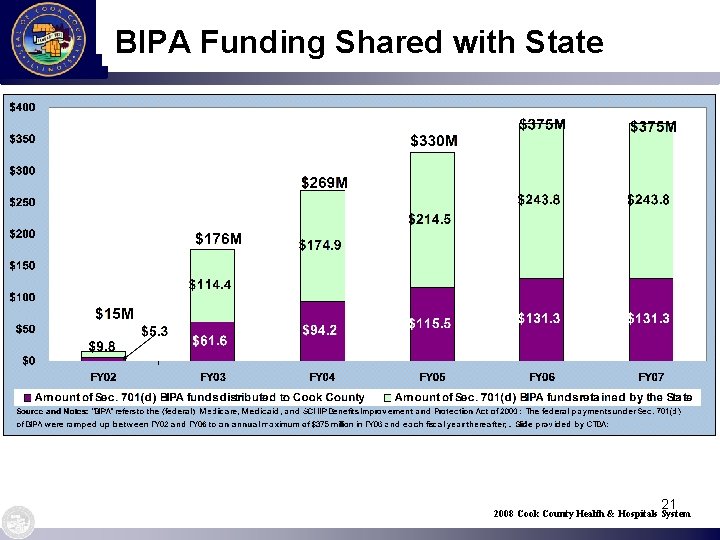
BIPA Funding Shared with State 21 2008 Cook County Health & Hospitals System
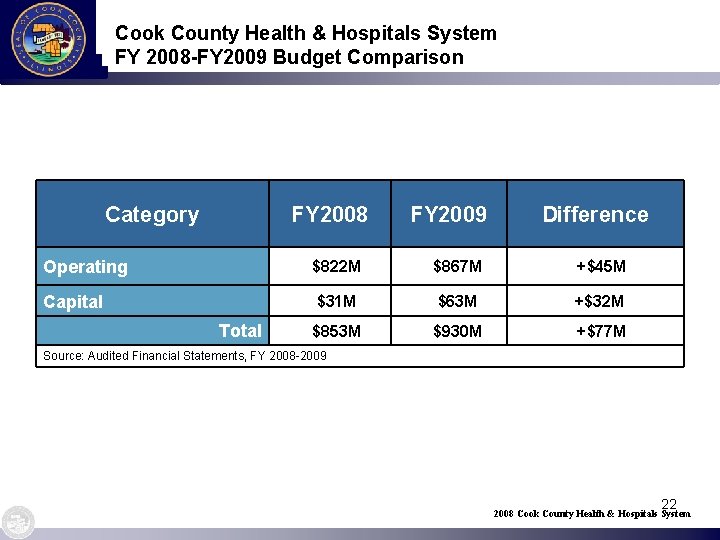
Cook County Health & Hospitals System FY 2008 -FY 2009 Budget Comparison Category FY 2008 FY 2009 Difference Operating $822 M $867 M +$45 M Capital $31 M $63 M +$32 M $853 M $930 M +$77 M Total Source: Audited Financial Statements, FY 2008 -2009 22 2008 Cook County Health & Hospitals System
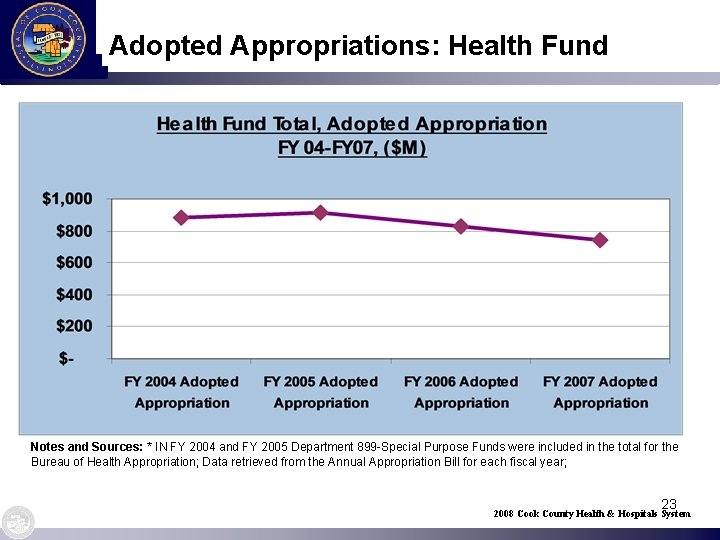
Adopted Appropriations: Health Fund Notes and Sources: * IN FY 2004 and FY 2005 Department 899 -Special Purpose Funds were included in the total for the Bureau of Health Appropriation; Data retrieved from the Annual Appropriation Bill for each fiscal year; 23 2008 Cook County Health & Hospitals System
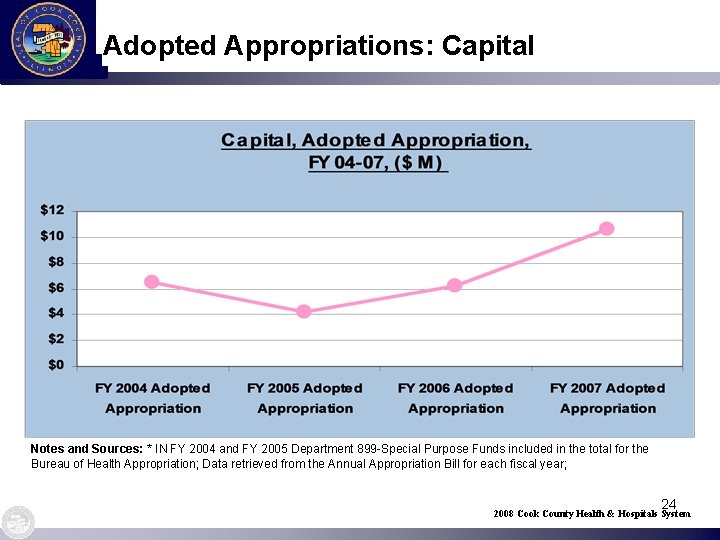
Adopted Appropriations: Capital Notes and Sources: * IN FY 2004 and FY 2005 Department 899 -Special Purpose Funds included in the total for the Bureau of Health Appropriation; Data retrieved from the Annual Appropriation Bill for each fiscal year; 24 2008 Cook County Health & Hospitals System
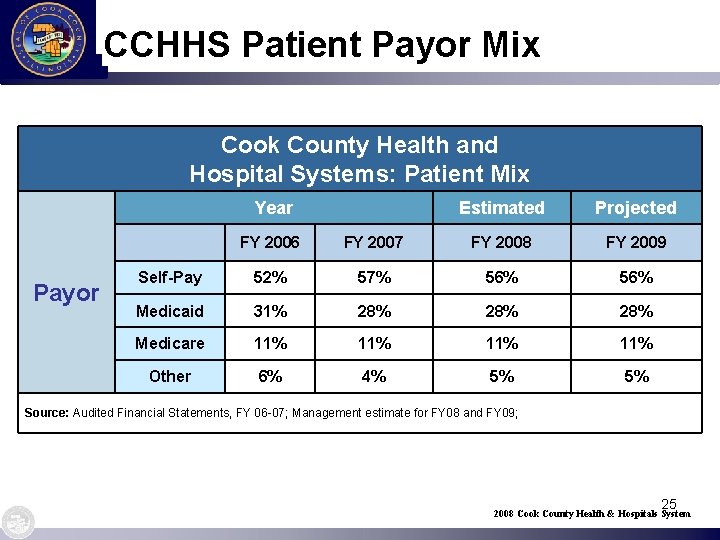
CCHHS Patient Payor Mix Cook County Health and Hospital Systems: Patient Mix Year Payor Estimated Projected FY 2006 FY 2007 FY 2008 FY 2009 Self-Pay 52% 57% 56% Medicaid 31% 28% 28% Medicare 11% 11% Other 6% 4% 5% 5% Source: Audited Financial Statements, FY 06 -07; Management estimate for FY 08 and FY 09; 25 2008 Cook County Health & Hospitals System
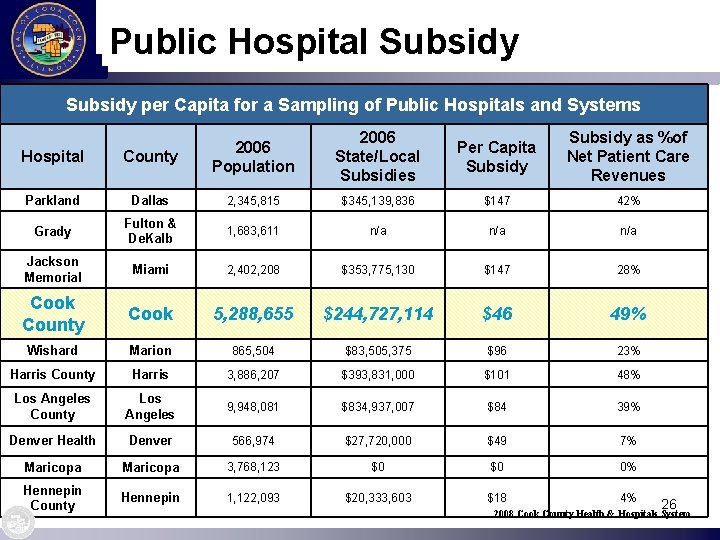
Public Hospital Subsidy per Capita for a Sampling of Public Hospitals and Systems 2006 State/Local Subsidies Per Capita Subsidy as %of Net Patient Care Revenues Hospital County 2006 Population Parkland Dallas 2, 345, 815 $345, 139, 836 $147 42% Grady Fulton & De. Kalb 1, 683, 611 n/a n/a Jackson Memorial Miami 2, 402, 208 $353, 775, 130 $147 28% Cook County Cook 5, 288, 655 $244, 727, 114 $46 49% Wishard Marion 865, 504 $83, 505, 375 $96 23% Harris County Harris 3, 886, 207 $393, 831, 000 $101 48% Los Angeles County Los Angeles 9, 948, 081 $834, 937, 007 $84 39% Denver Health Denver 566, 974 $27, 720, 000 $49 7% Maricopa 3, 768, 123 $0 $0 0% Hennepin County Hennepin 1, 122, 093 $20, 333, 603 $18 4% 26 2008 Cook County Health & Hospitals System
Policy Issues • National healthcare reform. • Charity care as government policy. • Patient Safety and Quality Measurement/Pay for Performance structures. • Proposed regulations that may constrain providers of healthcare to the poor. 27 2008 Cook County Health & Hospitals System
Regional/National Trends • Shifting City/County Demographics • ongoing city gentrification, inflow of uninsured immigrants. • Increasing out-of-pocket expenses. • Public Hospital financing issues in the U. S. • Insufficiency of specialty care access and resources for the poor. • Anticipated shifts/trends in healthcare delivery. • The overall economic downturn that threatens tax revenue shortages. 28 2008 Cook County Health & Hospitals System
Existing Internal Forces • Weakened infrastructure in IT and revenue cycle throughout the institution threatens our ability to move forward. • Tumultuous changes led to the loss of many critical human resources that need to be rebuilt in order to move forward. • Customer service scores display a gap that will keep us from succeeding. 29 2008 Cook County Health & Hospitals System
Positive Developments • Support from the County Board President and Commissioners for the creation of an independent CCHHS Board, and the opening up of the governance decision-making process. • The opening of the new John H. Stroger hospital facility. • The preliminary acceptance of the CCHHS’ recommended 2009 Budget. • Reduction of costs through the use of a Group Purchasing Organization (GPO). • The work with the Revenue Cycle consultants is showing progress and positive returns. 30 2008 Cook County Health & Hospitals System
Next Steps – Your Input What are the Hard Decisions? You tell us. § What are three most important services CCHHS delivers to the people of Cook County? § What are three services you are willing to give up in order to assure the most important services? § What questions do we need to answer in order to develop an actionable Strategic Plan? 31 2008 Cook County Health & Hospitals System
Questions ? 32 2008 Cook County Health & Hospitals System