Conversion Graphs Worksheet A Printing To print handouts


 This graph shows the conversion rate from degrees Fahrenheit to degrees")
 This graph shows the conversion rate from degrees Fahrenheit to degrees")

- Slides: 7
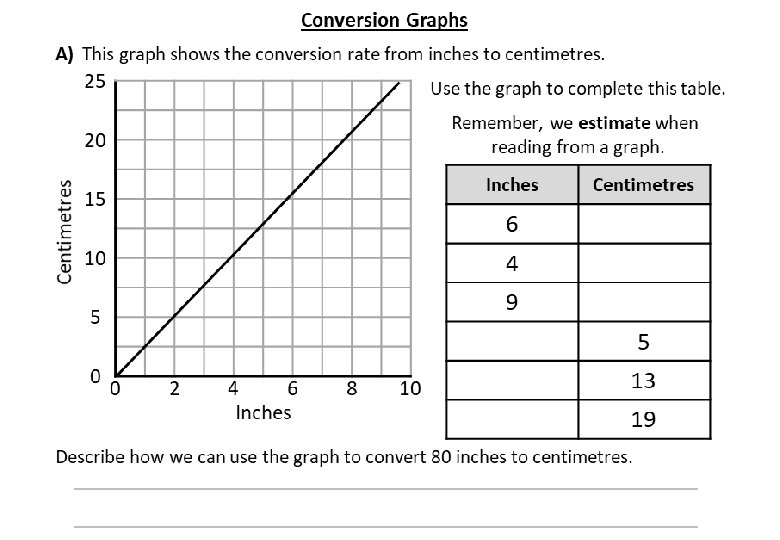
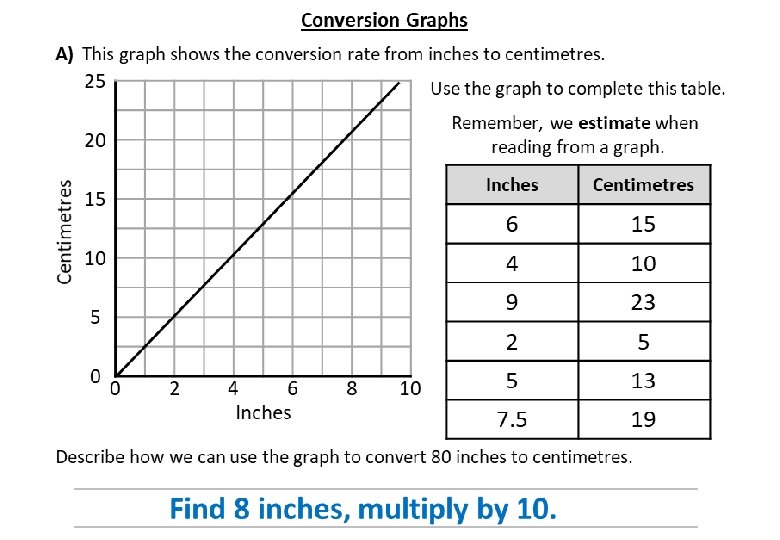
Conversion Graphs – Worksheet A
Printing To print handouts from slides Select the slide from the left. Then click: File > Print > ‘Print Current Slide’ To print multiple slides Click on a section title to highlight all those slides, or press ‘Ctrl’ at the same time as selecting slides to highlight more than one. Then click: File > Print > ‘Print Selection’ To print double-sided handouts Highlight both slides before using ‘Print Selection’. Choose ‘Print on Both Sides’ and ‘Flip on Short Edge’.
Conversion Graphs C) This graph shows the conversion rate from degrees Fahrenheit to degrees Celsius. 40 25 Use the graph to complete this table. 20 Remember, we estimate when reading from a graph. 15 10 5 0 0 2 4 6 Inches 8 10 Inches Centimetres 6 15 4 10 9 23 2 5 5 13 7. 5 19 Describe how we can use the graph to convert 80 inches to centimetres. Kilometres °C 20 10 0 30 40 50 60 °F 70 90 80 What is different about this conversion graph? 1) 70°F ≈ 21°C 2) 47°F ≈ 8°C Does not cross (0, 0) 3) 24°C ≈ 74°F 4) When water is frozen, what is approximate temperature in °F? Find 8 inches, multiply by 10. B) 30 32°F (85 − 32) = 53 85 + 53 = 137°F 5) Use this fact to convert 60°C to °F. 10 5 miles ≈ 8 kilometres 0 miles = ? kilometres 8 Use these data points to plot a conversion graph. 10 6 Use this line to complete the table. 8 A different car costs £ 5 to go 13 miles. Draw the conversion line for this car. 6 Approximately how much does it cost each car to travel 40 miles? 0 4 2 0 0 2 4 6 Miles 8 10 Miles Kilometres 2 3 3 5 12 18 -20 6 10 4. 1 -4. 4 7 41 -44 70 30°C = 85°F D) Cost £ Centimetres A) This graph shows the conversion rate from inches to centimetres. Car 1 Car 2 4 2 0 0 5 10 15 Miles 20 25 This graph shows the cost of running a car (petrol + maintenance). Car 1 £ 34 Car 2 £ 15 How much cheaper is it to travel 50 miles in Car 1 compared to Car 2? £ 43 vs. £ 19 = £ 24
Conversion Graphs C) This graph shows the conversion rate from degrees Fahrenheit to degrees Celsius. 40 Centimetres A) This graph shows the conversion rate from inches to centimetres. 25 Use the graph to complete this table. 20 Remember, we estimate when reading from a graph. Inches 15 Centimetres °C 20 6 10 4 10 9 5 0 30 0 5 0 2 4 6 Inches 8 13 10 19 Describe how we can use the graph to convert 80 inches to centimetres. 30 40 50 60 °F 70 80 90 What is different about this conversion graph? 1) 70°F ≈ 21°C 2) 47°F ≈ 8°C 3) 24°C ≈ 74°F 4) When water is frozen, what is approximate temperature in °F? 5) Use this fact to convert 60°C to °F. 10 5 miles ≈ 8 kilometres 0 miles = ? kilometres 8 Use these data points to plot a conversion graph. 10 6 Use this line to complete the table. 8 A different car costs £ 5 to go 13 miles. Draw the conversion line for this car. 6 Approximately how much does it cost each car to travel 40 miles? Miles 4 2 3 2 0 Kilometres 2 4 6 Miles 8 10 This graph shows the cost of running a car (petrol + maintenance). Car 1 4 Car 2 12 0 D) Cost £ Kilometres B) 10 7 70 2 0 0 5 10 15 Miles 20 25 How much cheaper is it to travel 50 miles in Car 1 compared to Car 2?
Questions? Comments? Suggestions? …or have you found a mistake!? Any feedback would be appreciated . Please feel free to email: tom@goteachmaths. co. uk