
Controlling QCLs for Frequency Metrology from the MidIR
- Slides: 48
Controlling QCLs for Frequency Metrology from the Mid-IR to the THz range Paolo De Natale IQCLSW 2018 www. ino. cnr. it
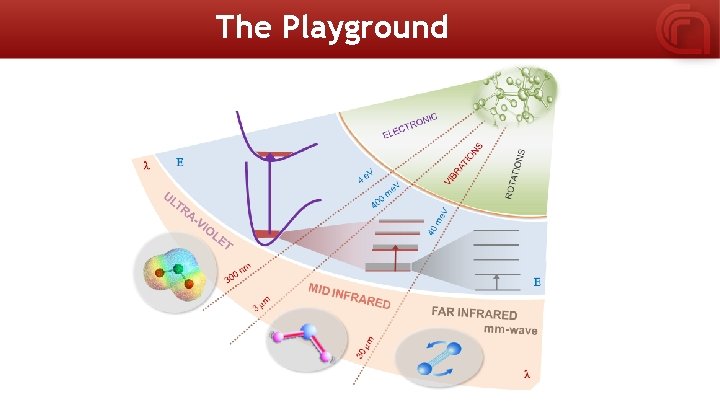
The Playground Relatore: Nome relatore Evento: Nome evento
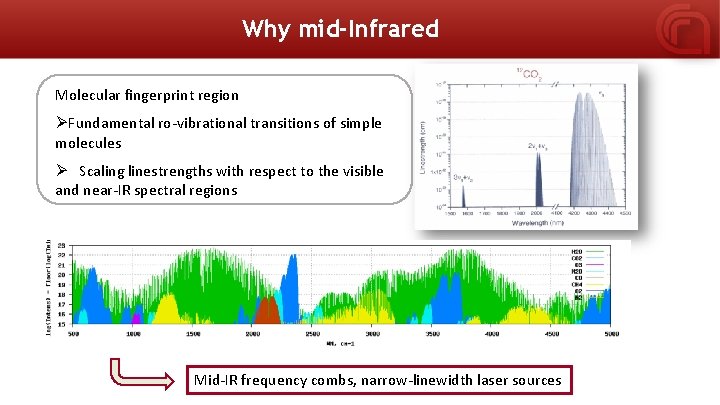
Why mid-Infrared Molecular fingerprint region ØFundamental ro-vibrational transitions of simple molecules Ø Scaling linestrengths with respect to the visible and near-IR spectral regions Mid-IR frequency combs, narrow-linewidth laser sources
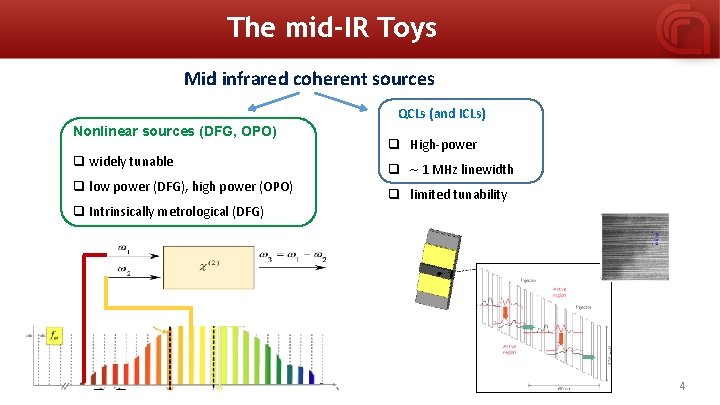
The mid-IR Toys Mid infrared coherent sources QCLs (and ICLs) Nonlinear sources (DFG, OPO) q widely tunable q low power (DFG), high power (OPO) q Intrinsically metrological (DFG) q High-power q ~ 1 MHz linewidth q limited tunability 4
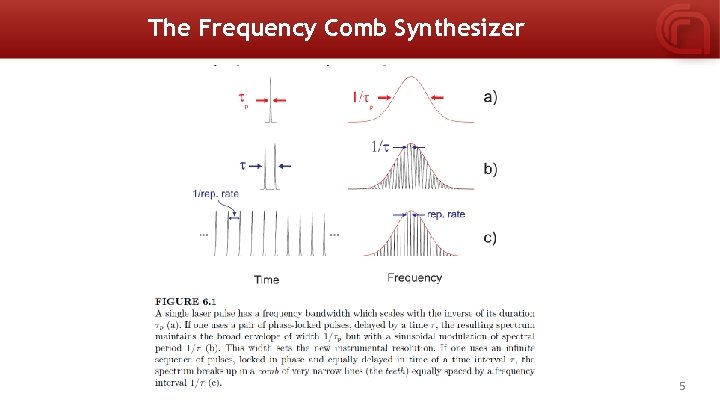
The Frequency Comb Synthesizer 5
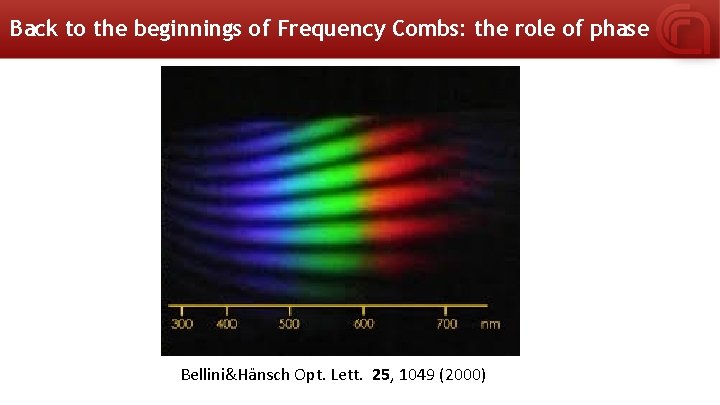
Back to the beginnings of Frequency Combs: the role of phase Bellini&Hänsch Opt. Lett. 25, 1049 (2000)
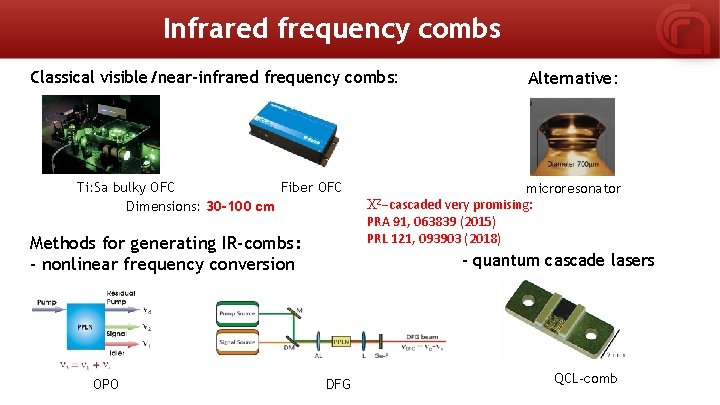
Infrared frequency combs Classical visible/near-infrared frequency combs: Ti: Sa bulky OFC Fiber OFC Dimensions: 30 -100 cm Alternative: microresonator Relatore: Nome relatore PRA 91, 063839 (2015) C 2 -cascaded very promising: PRL 121, 093903 (2018) Methods for generating IR-combs: - nonlinear frequency conversion - quantum cascade lasers Evento: OPO DFG QCL-comb
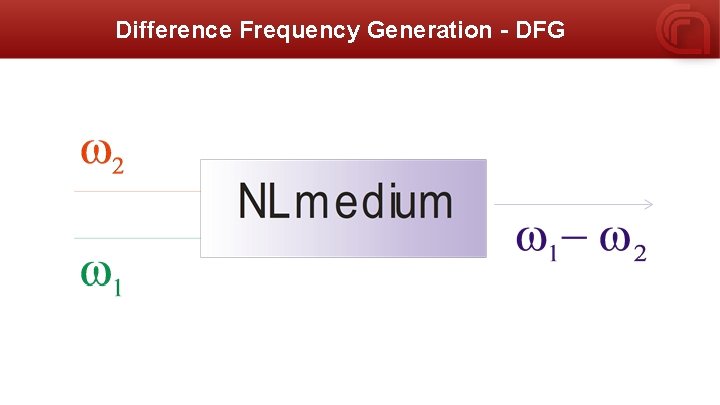
Difference Frequency Generation - DFG
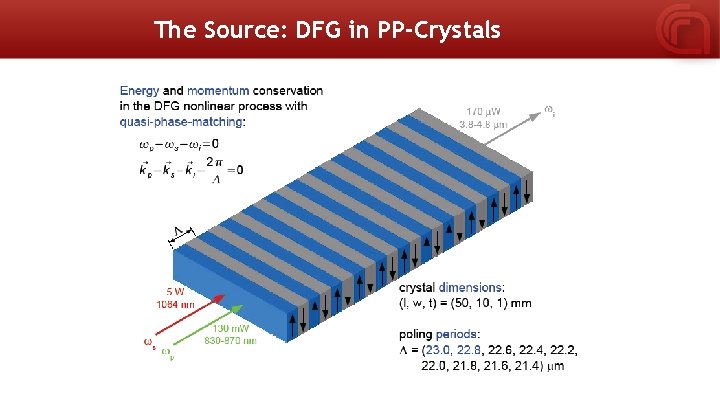
The Source: DFG in PP-Crystals
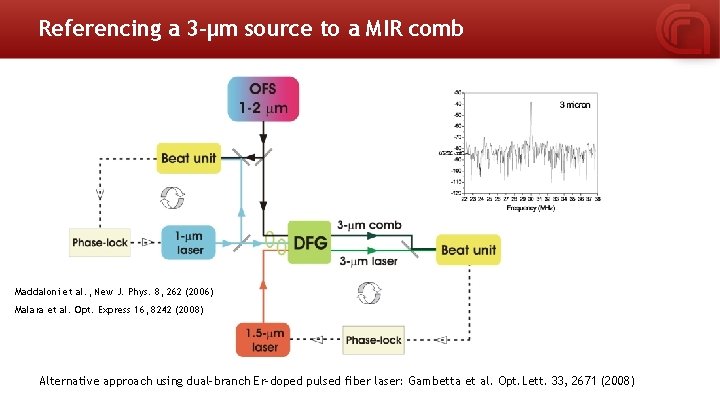
Referencing a 3 -μm source to a MIR comb Maddaloni et al. , New J. Phys. 8, 262 (2006) Malara et al. Opt. Express 16, 8242 (2008) Alternative approach using dual-branch Er-doped pulsed fiber laser: Gambetta et al. Opt. Lett. 33, 2671 (2008)
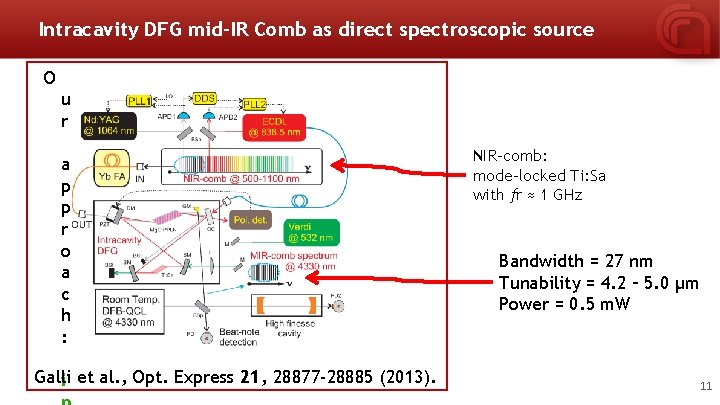
Intracavity DFG mid-IR Comb as direct spectroscopic source O u r a p p r o a c h : Galli i et al. , Opt. Express 21, 28877 -28885 (2013). NIR-comb: mode-locked Ti: Sa with fr ≈ 1 GHz Bandwidth = 27 nm Tunability = 4. 2 – 5. 0 μm Power = 0. 5 m. W 11
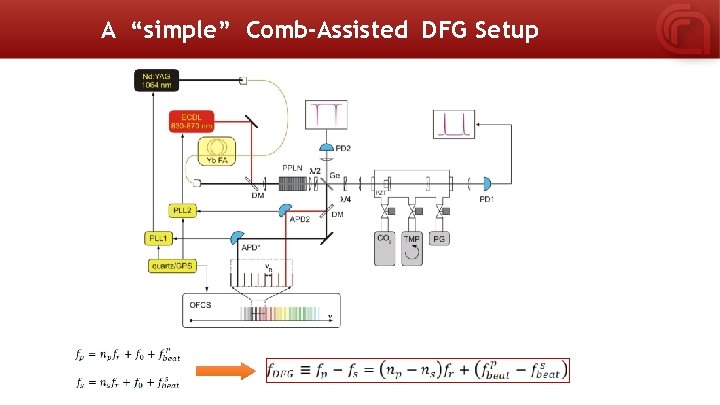
A “simple” Comb-Assisted DFG Setup
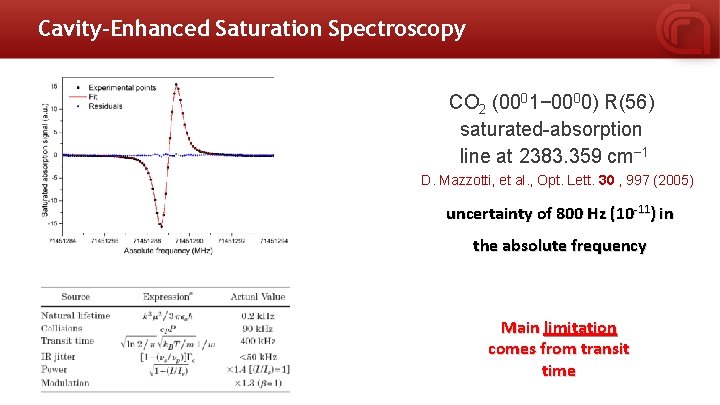
Cavity-Enhanced Saturation Spectroscopy CO 2 (0001− 0000) R(56) saturated-absorption line at 2383. 359 cm− 1 D. Mazzotti, et al. , Opt. Lett. 30 , 997 (2005) uncertainty of 800 Hz (10 -11) in the absolute frequency Main limitation comes from transit time
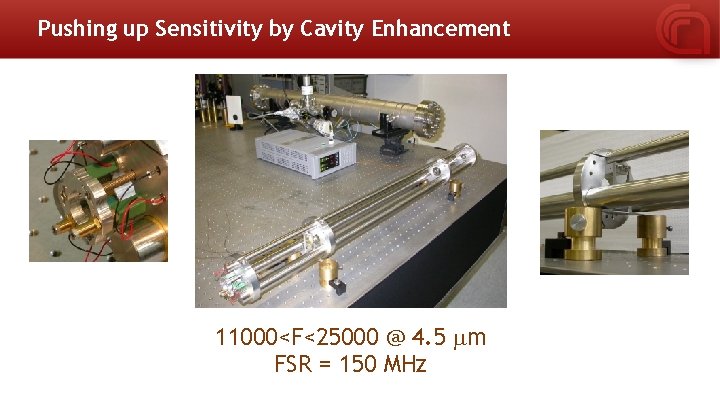
Pushing up Sensitivity by Cavity Enhancement 11000<F<25000 @ 4. 5 mm FSR = 150 MHz
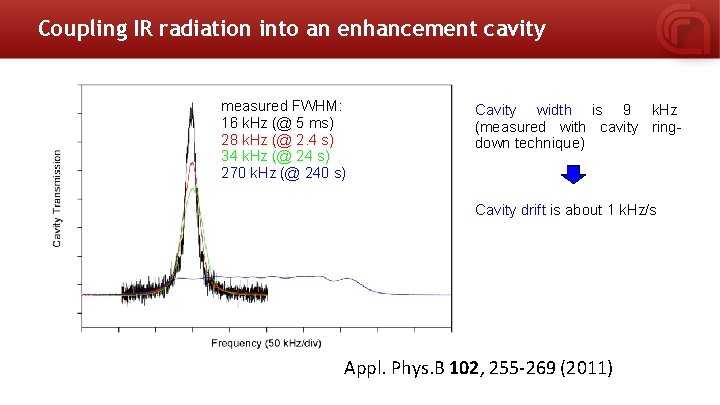
Coupling IR radiation into an enhancement cavity measured FWHM: 16 k. Hz (@ 5 ms) 28 k. Hz (@ 2. 4 s) 34 k. Hz (@ 24 s) 270 k. Hz (@ 240 s) Cavity width is 9 k. Hz (measured with cavity ringdown technique) Cavity drift is about 1 k. Hz/s Appl. Phys. B 102, 255 -269 (2011)
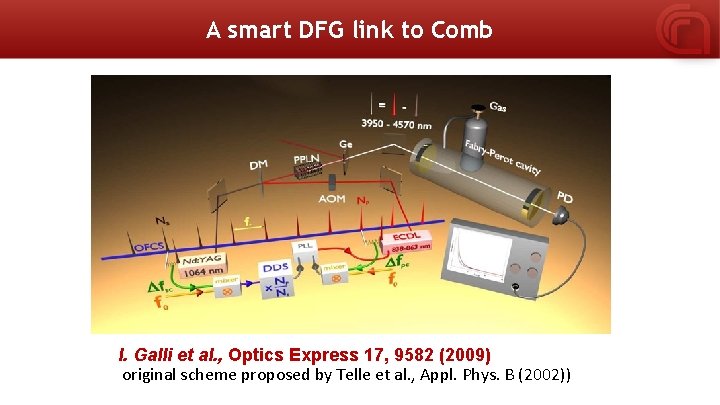
A smart DFG link to Comb I. Galli et al. , Optics Express 17, 9582 (2009) original scheme proposed by Telle et al. , Appl. Phys. B (2002))
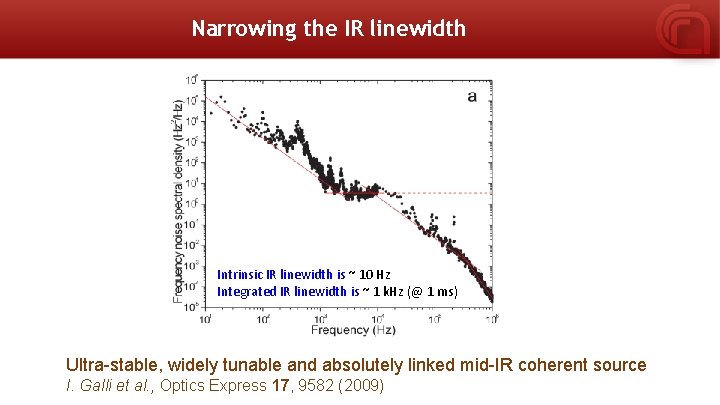
Narrowing the IR linewidth Intrinsic IR linewidth is ~ 10 Hz Integrated IR linewidth is ~ 1 k. Hz (@ 1 ms) Ultra-stable, widely tunable and absolutely linked mid-IR coherent source I. Galli et al. , Optics Express 17, 9582 (2009)
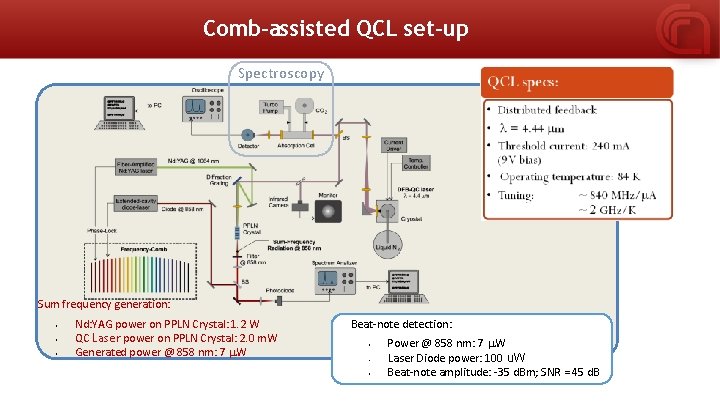
Comb-assisted QCL set-up Spectroscopy Sum frequency generation: • • • Nd: YAG power on PPLN Crystal: 1. 2 W QC Laser power on PPLN Crystal: 2. 0 m. W Generated power @ 858 nm: 7 m. W Beat-note detection: • • • Power @ 858 nm: 7 m. W Laser Diode power: 100 u. W Beat-note amplitude: -35 d. Bm; SNR = 45 d. B
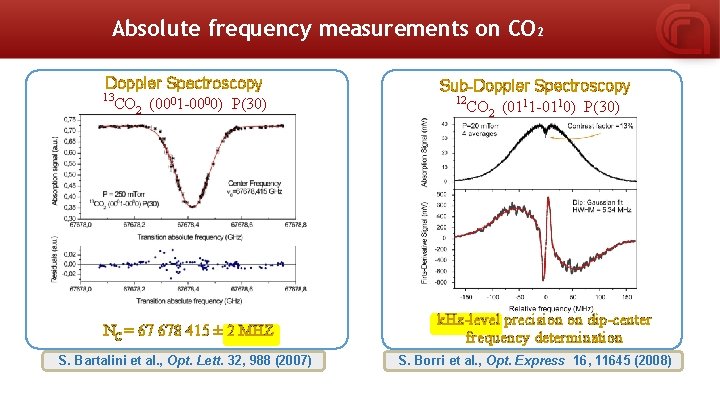
Absolute frequency measurements on CO 2 13 Doppler Spectroscopy CO 2 (0001 -0000) P(30) Sub-Doppler Spectroscopy 12 CO 2 (0111 -0110) P(30) NC = 67 678 415 ± 2 MHZ k. Hz-level precision on dip-center frequency determination S. Bartalini et al. , Opt. Lett. 32, 988 (2007) S. Borri et al. , Opt. Express 16, 11645 (2008)
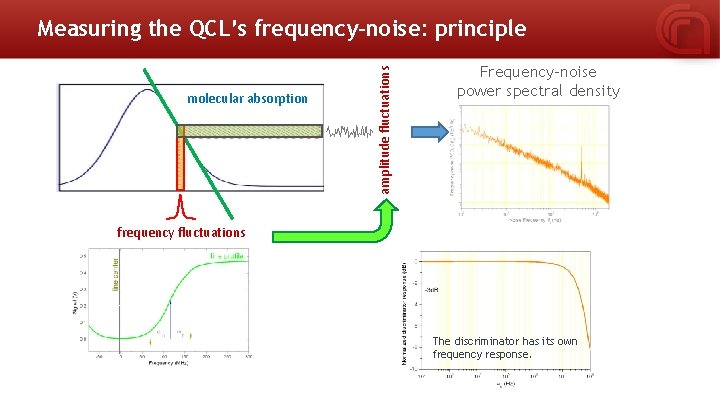
molecular absorption amplitude fluctuations Measuring the QCL’s frequency-noise: principle Frequency-noise power spectral density frequency fluctuations The discriminator has its own frequency response.
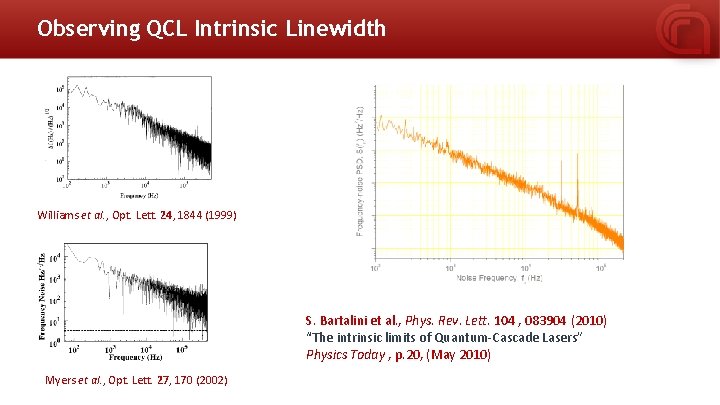
Observing QCL Intrinsic Linewidth Williams et al. , Opt. Lett. 24, 1844 (1999) S. Bartalini et al. , Phys. Rev. Lett. 104 , 083904 (2010) “The intrinsic limits of Quantum-Cascade Lasers” Physics Today , p. 20, (May 2010) Myers et al. , Opt. Lett. 27, 170 (2002)
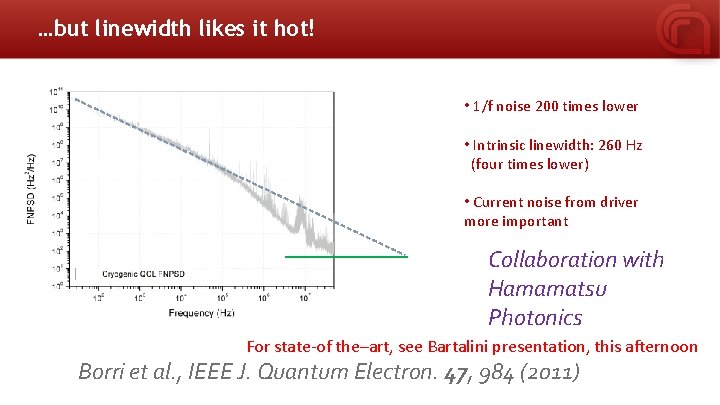
…but linewidth likes it hot! • 1/f noise 200 times lower • Intrinsic linewidth: 260 Hz (four times lower) • Current noise from driver more important Collaboration with Hamamatsu Photonics For state-of the–art, see Bartalini presentation, this afternoon Borri et al. , IEEE J. Quantum Electron. 47, 984 (2011)
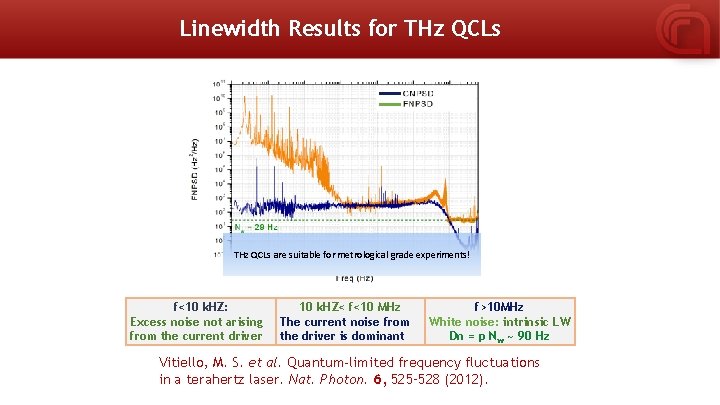
Linewidth Results for THz QCLs are suitable for metrological grade experiments! f<10 k. HZ: Excess noise not arising from the current driver 10 k. HZ< f<10 MHz The current noise from the driver is dominant f>10 MHz White noise: intrinsic LW Dn = p Nw ~ 90 Hz Vitiello, M. S. et al. Quantum-limited frequency fluctuations in a terahertz laser. Nat. Photon. 6, 525– 528 (2012).
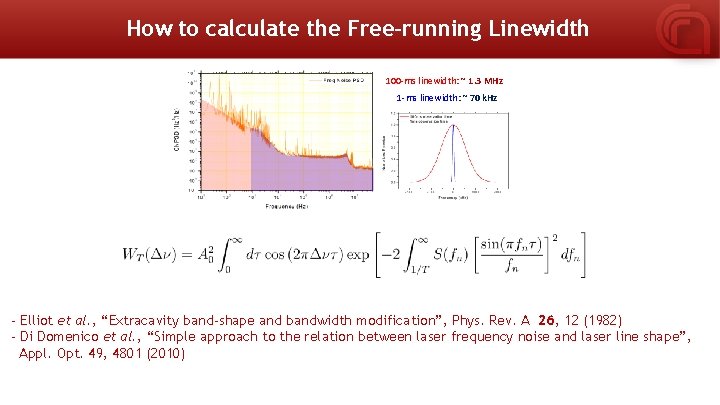
How to calculate the Free-running Linewidth 100 -ms linewidth: ~ 1. 3 MHz 1 -ms linewidth: ~ 70 k. Hz - Elliot et al. , “Extracavity band-shape and bandwidth modification”, Phys. Rev. A 26, 12 (1982) - Di Domenico et al. , “Simple approach to the relation between laser frequency noise and laser line shape”, Appl. Opt. 49, 4801 (2010)
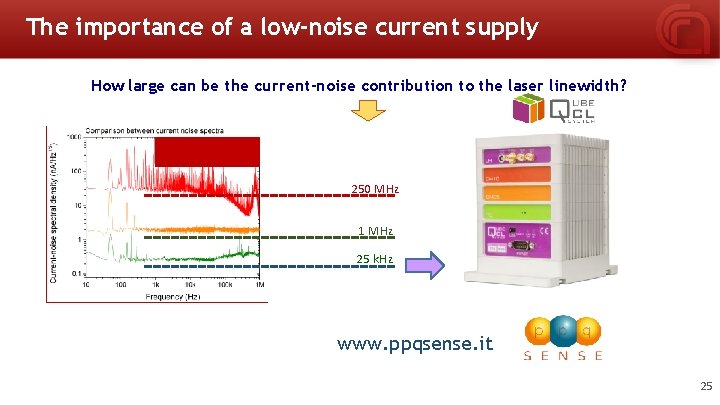
The importance of a low-noise current supply How large can be the current-noise contribution to the laser linewidth? Relatore: Nome relatore 250 MHz 1 MHz 25 k. Hz Evento: Nome evento www. ppqsense. it 25
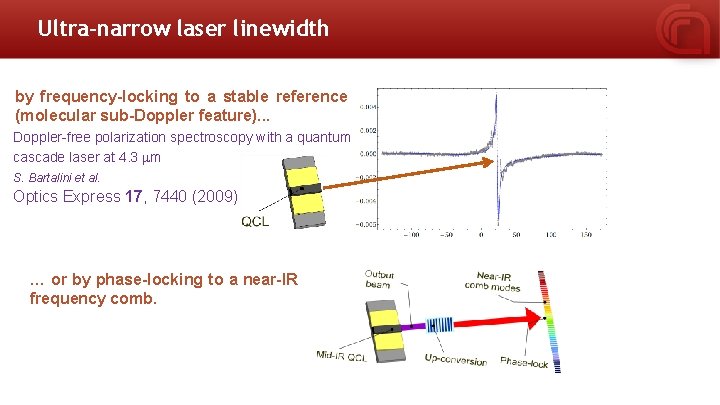
Ultra-narrow laser linewidth by frequency-locking to a stable reference (molecular sub-Doppler feature). . . Doppler-free polarization spectroscopy with a quantum cascade laser at 4. 3 mm S. Bartalini et al. Optics Express 17, 7440 (2009) … or by phase-locking to a near-IR frequency comb.
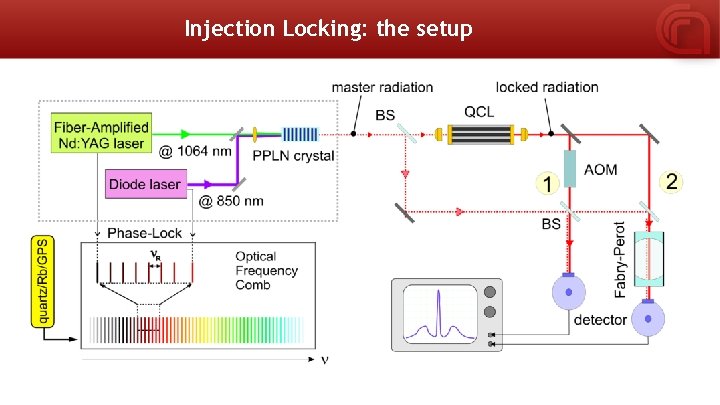
Injection Locking: the setup
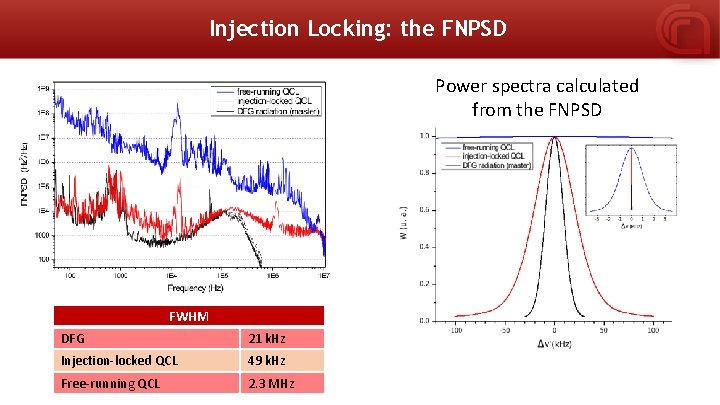
Injection Locking: the FNPSD Power spectra calculated from the FNPSD FWHM DFG 21 k. Hz Injection-locked QCL 49 k. Hz Free-running QCL 2. 3 MHz
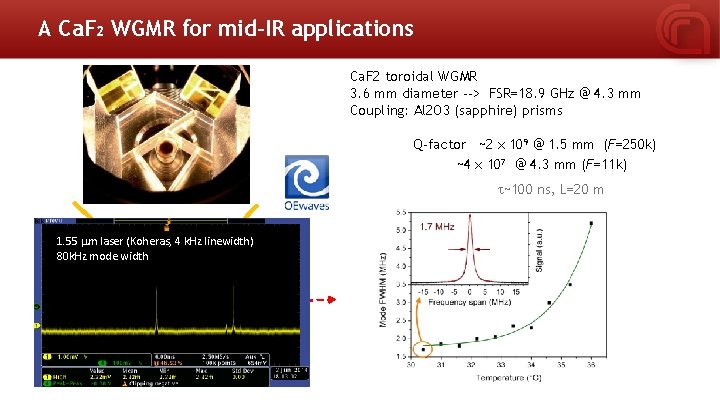
A Ca. F 2 WGMR for mid-IR applications Ca. F 2 toroidal WGMR 3. 6 mm diameter --> FSR=18. 9 GHz @ 4. 3 mm Coupling: Al 2 O 3 (sapphire) prisms Q-factor ~2 x 10⁹ @ 1. 5 mm (F=250 k) ~4 x 10⁷ @ 4. 3 mm (F=11 k) ~100 ns, L=20 m 1. 55 mm laser (Koheras, 4 k. Hz linewidth) 80 k. Hz mode width
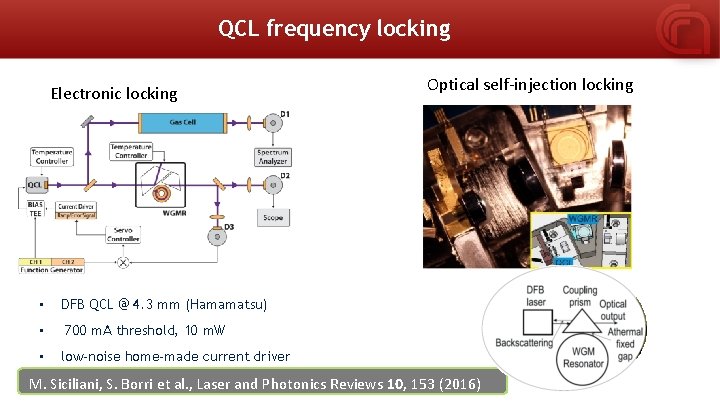
QCL frequency locking Electronic locking • • • Optical self-injection locking DFB QCL @ 4. 3 mm (Hamamatsu) 700 m. A threshold, 10 m. W low-noise home-made current driver M. Siciliani, S. Borri et al. , Laser and Photonics Reviews 10, 153 (2016)
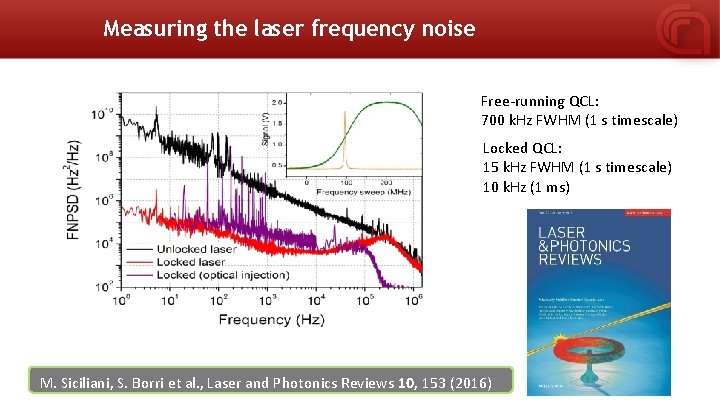
Measuring the laser frequency noise Free-running QCL: 700 k. Hz FWHM (1 s timescale) Locked QCL: 15 k. Hz FWHM (1 s timescale) 10 k. Hz (1 ms) M. Siciliani, S. Borri et al. , Laser and Photonics Reviews 10, 153 (2016)
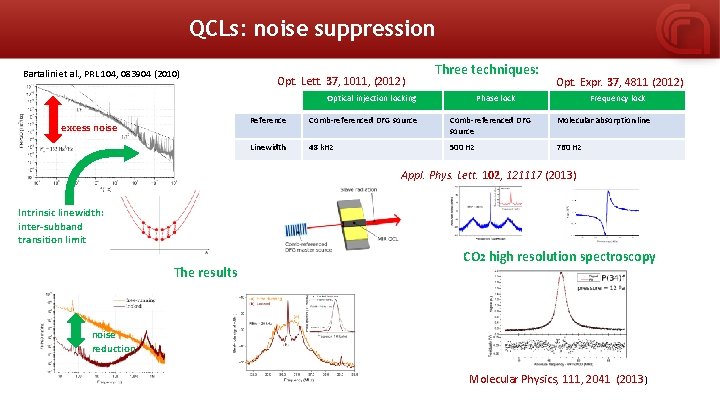
QCLs: noise suppression Bartalini et al. , PRL 104, 083904 (2010) Opt. Lett. 37, 1011, (2012) Three techniques: Optical injection locking excess noise Opt. Expr. 37, 4811 (2012) Phase lock Frequency lock Reference Comb-referenced DFG source Molecular absorption line Linewidth 48 k. Hz 500 Hz 760 Hz Appl. Phys. Lett. 102, 121117 (2013) Intrinsic linewidth: inter-subband transition limit The results CO 2 high resolution spectroscopy noise reduction Molecular Physics, 111, 2041 (2013 )
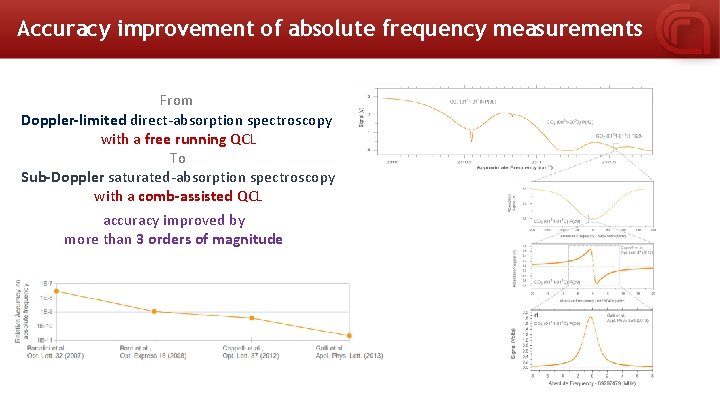
Accuracy improvement of absolute frequency measurements From Doppler-limited direct-absorption spectroscopy with a free running QCL To Sub-Doppler saturated-absorption spectroscopy with a comb-assisted QCL accuracy improved by more than 3 orders of magnitude
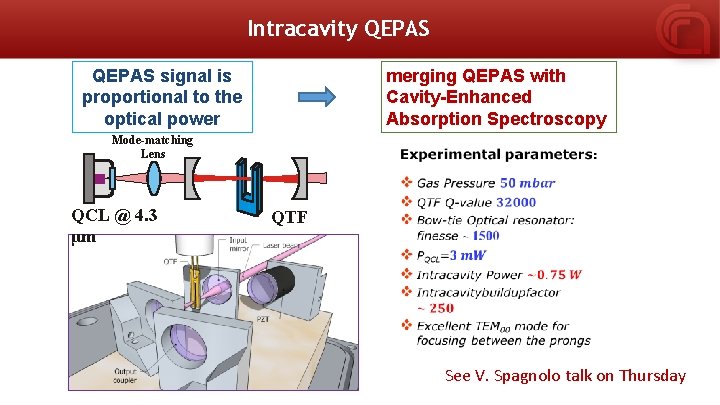
Intracavity QEPAS signal is proportional to the optical power merging QEPAS with Cavity-Enhanced Absorption Spectroscopy Mode-matching Lens QCL @ 4. 3 μm QTF See V. Spagnolo talk on Thursday
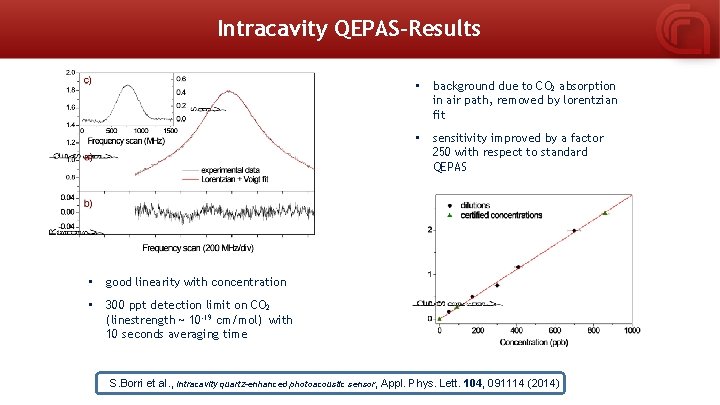
Intracavity QEPAS-Results • background due to CO 2 absorption in air path, removed by lorentzian fit • sensitivity improved by a factor 250 with respect to standard QEPAS • good linearity with concentration • 300 ppt detection limit on CO 2 (linestrength ~ 10 -19 cm/mol) with 10 seconds averaging time S. Borri et al. , Intracavity quartz-enhanced photoacoustic sensor, Appl. Phys. Lett. 104, 091114 (2014)
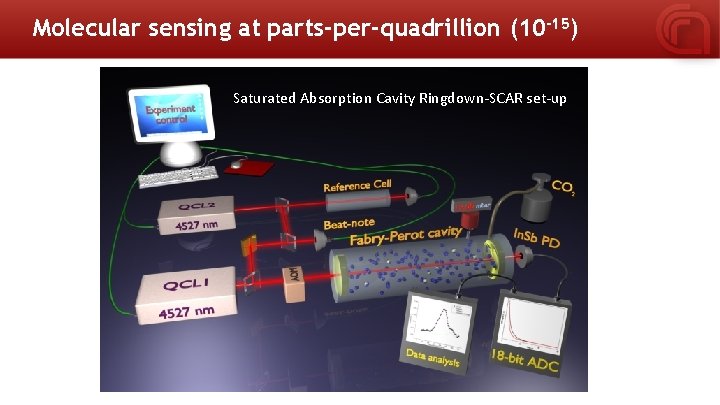
Molecular sensing at parts-per-quadrillion (10 -15) Saturated Absorption Cavity Ringdown-SCAR set-up
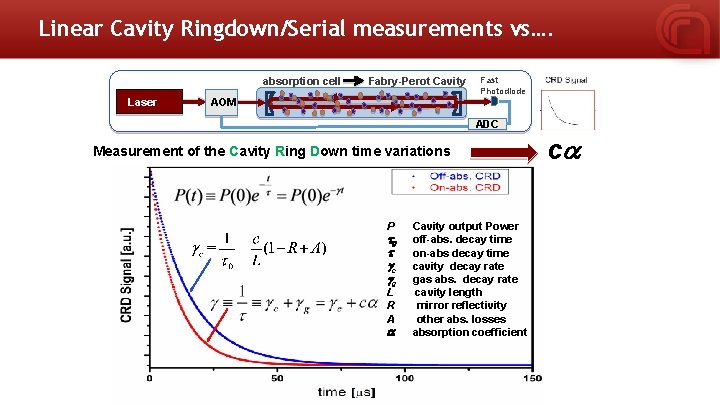
Linear Cavity Ringdown/Serial measurements vs…. absorption cell Laser Fabry-Perot Cavity Fast Photodiode AOM ADC Measurement of the Cavity Ring Down time variations P t 0 t gc gg L R A a Cavity output Power off-abs. decay time on-abs decay time cavity decay rate gas abs. decay rate cavity length mirror reflectivity other abs. losses absorption coefficient ca
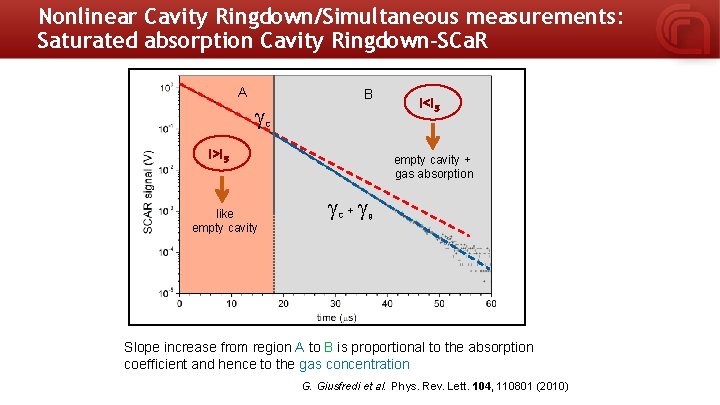
Nonlinear Cavity Ringdown/Simultaneous measurements: Saturated absorption Cavity Ringdown-SCa. R A g B C I>IS like empty cavity I<IS empty cavity + gas absorption g +g C g Slope increase from region A to B is proportional to the absorption coefficient and hence to the gas concentration G. Giusfredi et al. Phys. Rev. Lett. 104, 110801 (2010)
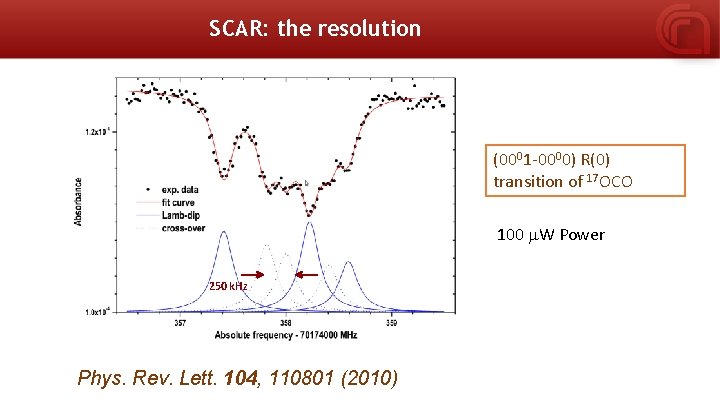
SCAR: the resolution (0001 -0000) R(0) transition of 17 OCO 100 m. W Power 250 k. Hz Phys. Rev. Lett. 104, 110801 (2010)
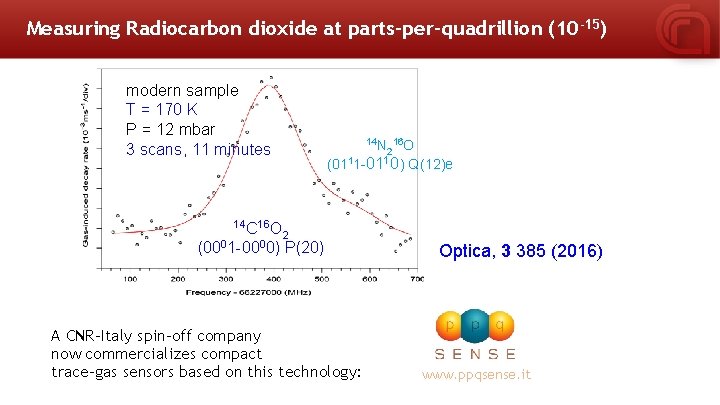
Measuring Radiocarbon dioxide at parts-per-quadrillion (10 -15) modern sample T = 170 K P = 12 mbar 3 scans, 11 minutes 14 C 16 O 0 0 14 N 216 O (0111 -0110) Q(12)e 2 (00 1 -00 0) P(20) A CNR-Italy spin-off company now commercializes compact trace-gas sensors based on this technology: Optica, 3 385 (2016) www. ppqsense. it
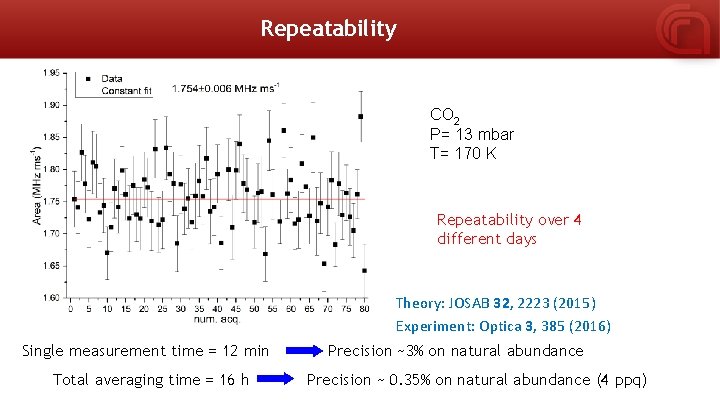
Repeatability CO 2 P= 13 mbar T= 170 K Repeatability over 4 different days Theory: JOSAB 32, 2223 (2015) Experiment: Optica 3, 385 (2016) Single measurement time = 12 min Total averaging time = 16 h Precision ~3% on natural abundance Precision ~ 0. 35% on natural abundance (4 ppq)
Moving deeper into the (Far) Infrared
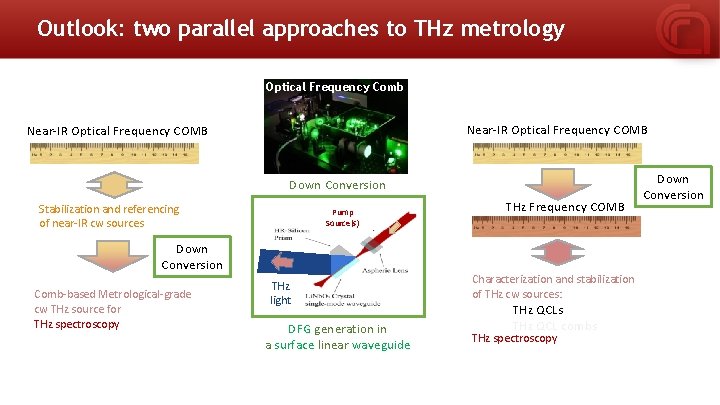
Outlook: two parallel approaches to THz metrology Optical Frequency Comb Near-IR Optical Frequency COMB Down Conversion Stabilization and referencing of near-IR cw sources Pump Source(s) Down Conversion Comb-based Metrological-grade cw THz source for THz spectroscopy THz light DFG generation in a surface linear waveguide THz Frequency COMB Characterization and stabilization of THz cw sources: THz QCLs THz QCL combs THz spectroscopy Down Conversion
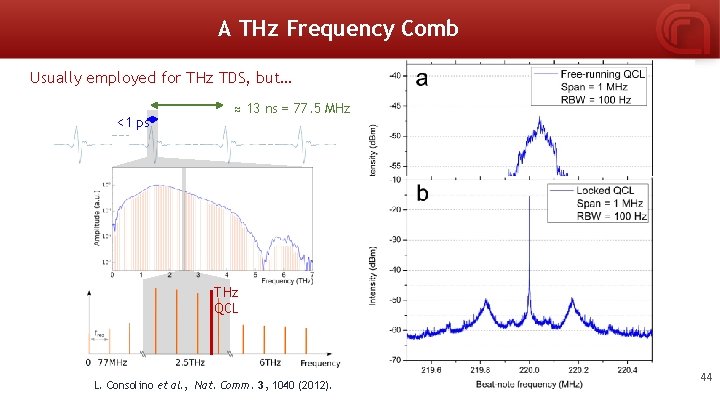
A THz Frequency Comb Usually employed for THz TDS, but… <1 ps ≈ 13 ns = 77. 5 MHz About 70 -80% of the QCL power Pump effectively laser: phase-locked P = 250 m. W S/N = 50 d. Bm (1 Hz – RBW) Electronic Bandwidth = 200 k. Hz Nome relatore THz QCL L. Consolino et al. , Nat. Comm. 3, 1040 (2012). Total power = 1 m. W Evento: Power per tooth = 30 p. W Nome evento zero-CEO frequency 6 -octaves-spanning COMB (more than 60000 teeth) 44
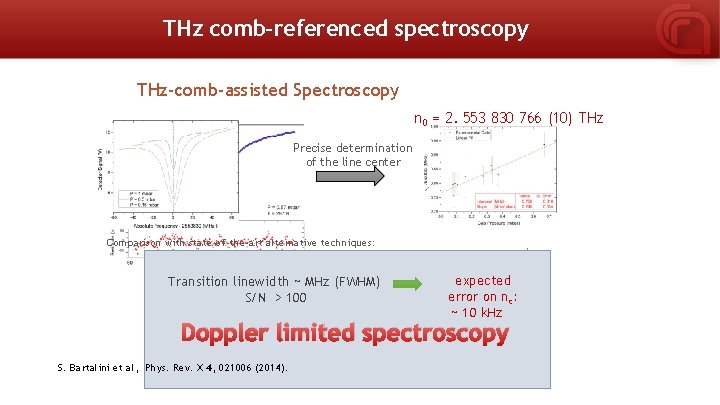
THz comb-referenced spectroscopy THz-comb-assisted Spectroscopy n 0 = 2. 553 830 766 (10) THz Precise determination of the line center Comparison with state-of-the-art alternative techniques: Transition linewidth ~ MHz (FWHM) S/N > 100 expected error on nc: ~ 10 k. Hz Doppler limited spectroscopy S. Bartalini et al, Phys. Rev. X 4, 021006 (2014).
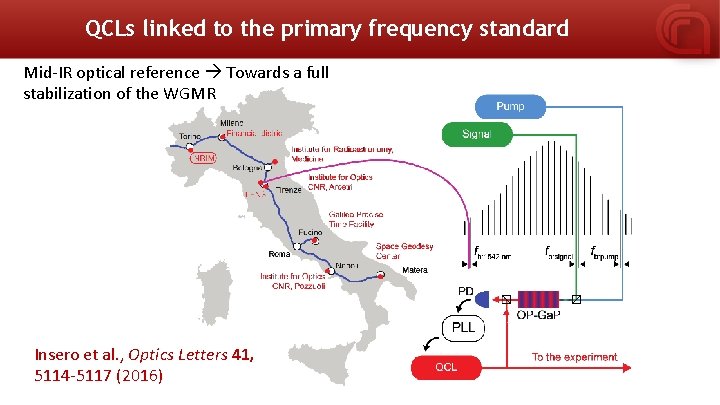
QCLs linked to the primary frequency standard Mid-IR optical reference Towards a full stabilization of the WGMR Insero et al. , Optics Letters 41, 5114 -5117 (2016)
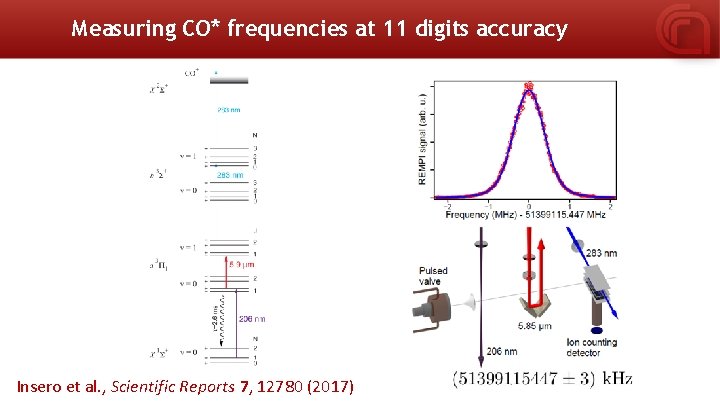
Measuring CO* frequencies at 11 digits accuracy Insero et al. , Scientific Reports 7, 12780 (2017)
The Team FIRENZE Paolo De Natale NAPOLI Saverio Bartalini Saverio Avino Simone Borri Maurizio De Rosa Gianluca Gagliardi Pasquale Maddaloni Giulio Campo Francesco Cappelli Luigi Consolino Pietro Malara Michele De Regis Simona Mosca Maria Parisi Iolanda Ricciardi Iacopo Galli Giovanni Giusfredi Davide Mazzotti Pablo Cancio Pastor The CNR-INO startup company (www. ppqsense. it) that provided the Ultralow-noise current drivers for powering the QCLs