CONTROLLING BASIC PROCESS IN CONTROLLING CONTROLLING The basic

CONTROLLING

BASIC PROCESS IN CONTROLLING

CONTROLLING The basic control process involves three steps: 1. Establishing Standards 2. Measuring performance against these standards 3. Correcting variations from standards and plans

Critical Point Standards

Critical Point Standards a. Physical Standards where materials are used, labor is employed, services are rendered & goods are produced – – – Labor hours per unit of output Pounds of fuel per horse power produced Ton-miles of freight traffic carried Units of production per machine hour Feet of wire per tone of copper

COST STANDARDS • Direct & Indirect cost produced per unit • Labor cost per unit or per hour • Material cost per unit, machine hour cost • Selling costs per rupee or unit of sales

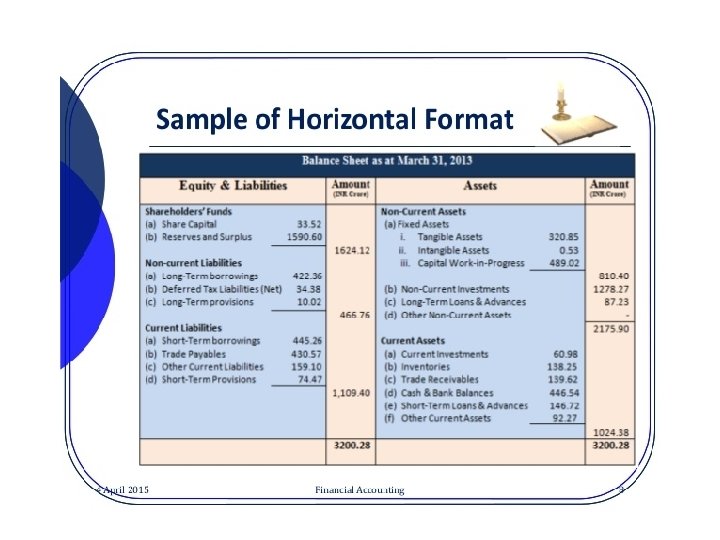
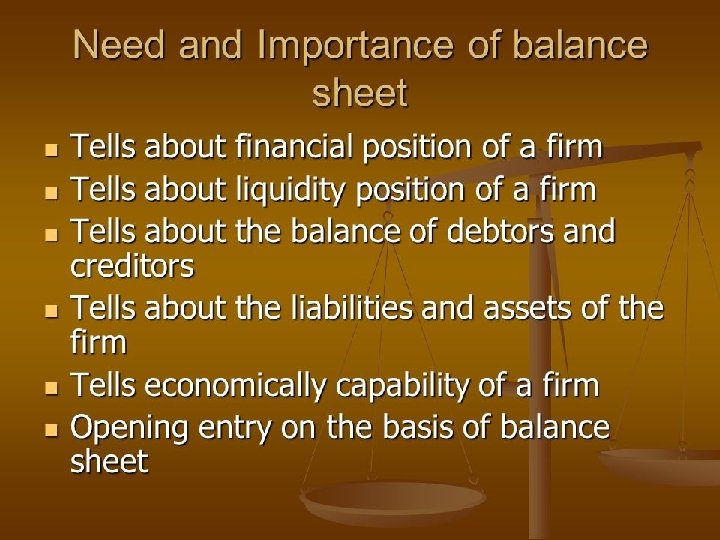
CAPITAL STANDARDS The typical Balance sheet disclose capital standards o Standard for New Investment o Standard for overall control o Standard for ROI o Standard for current Assets to current liabilities o Standard for debt to net worth o Standard for fixed investment to total Investment Case receivables & payables, notes or bonds to stock, size and turnover of inventories

Revenue Standards – Revenue per bus passenger – mile – Average sale per customer – Sales per capita in a given market Program Standards – To install a variable budget program – A program for the development of new products – Program for improving the quality of sales force

Intangible Standards What standard can a manager use for determining the competence of the divisional purchasing agent or personnel director? – Whether public relation program is successful – Whether the advertising program meets both short & Long term objectives – Are supervisors loyal to company objectives

Goal as standard • Goals can be used as performance standards

Real time Information and Control – Information about what is happening while it is happening – Vacant seat about airlines, super markets (Sales – data, inventory, gross profit), Production system – Real time data is used to measure performance

Future Directed Control – Forecasts based on latest available information Ex. Sales forecast indicating that sales will be lower than desirable, managers may develop new plans for advertising, sales promotion or the introduction of the new products, in order to improve the sales forecast.

Feed forward Vs Feedback Control Systems

Requirements for feed forward control 1. Make a through and careful analysis of the Planning and control system, and identify the more important input variables 2. Develop a model of the system 3. Take care to keep the model up to data 4. Collect the data on input variables regularly and put into the system 5. Regularly access the variations of actual input data from planned for inputs

Systems of Inputs for Feed Forward Control

Requirements for Effective Controls Ø Tailoring Controls to plans and Positions (Control of sales department will defer for finance department) – Use budgets, standard hours & costs & Financial ratios Ø Tailoring controls to Individual Manager Ø Designing controls to point up Exceptions at critical points Ø Seeking objectivity of controls Ø Ensuring flexibility of controls Ø Fitting the control system to the Organizational Culture Ø Achieving Economy of controls Ø Establishing controls that lead to corrective action

Controlling Techniques : BUDGET Budget is the device for accomplishing control – Budget is the formulation of plans for a given future period in numerical terms – Budgets are statements of anticipated results either in financial terms – Expense & Capital budgets or nonfinancial terms labor hours, materials, physical sales volume, units of Production

Types of Budgets

Types of Budgets 1. Revenue and expense budgets 2. Time, space, material and product budgets 3. Capital Expenditure budgets 4. Cash budgets

Dangers in Budgeting

Dangers in Budgeting o Budgets are used for planning and control o Unfortunately some budgetary control programs are so complete and detailed that they become cumbersome, meaningless, and unduly expensive.

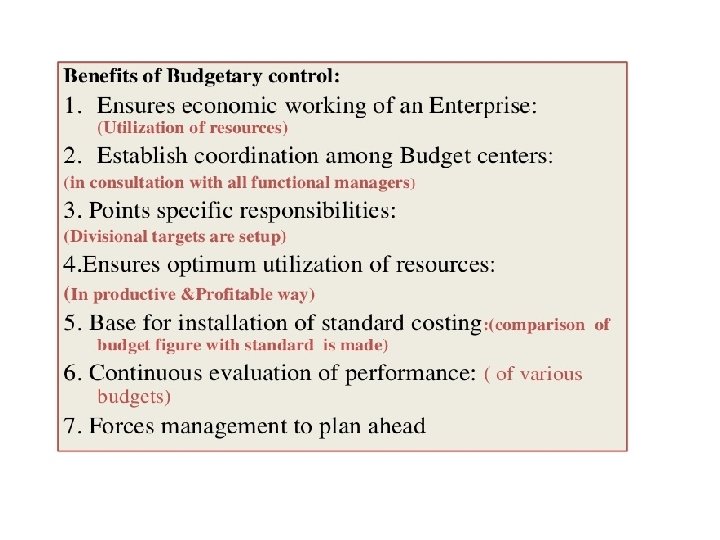
BUDGETRY CONTROL

Zero – Base Budgeting

Zero – Base Budgeting – It is also a type of budgeting – The idea is divide the enterprise into “Packages” composed of goals, activities and needed resources and then to calculate costs for each package from the group up. – It is useful for support areas rather than to production areas

Traditional Non budgetary control Devices v. Statistical data of operations v. Special reports analysis of specific areas v. Operational audit v. Independent appraisal by a staff of internal or external auditors v. Personal observation such as managing by walking around v. Break even analysis
 • Critical path method(CPM) •")
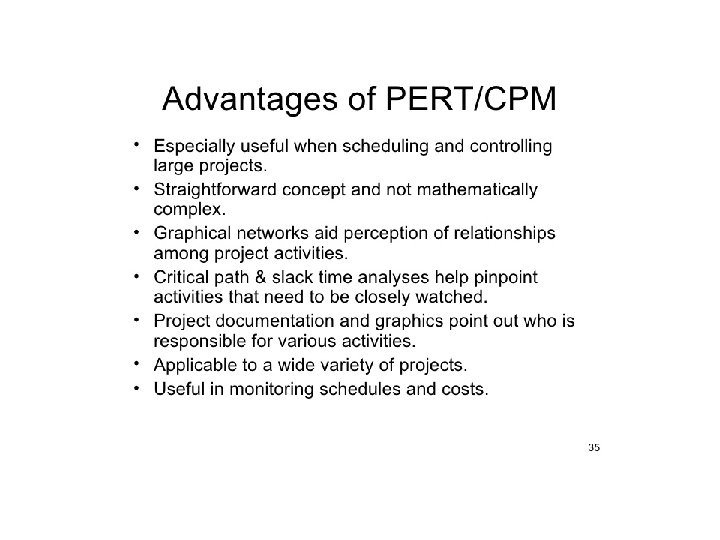
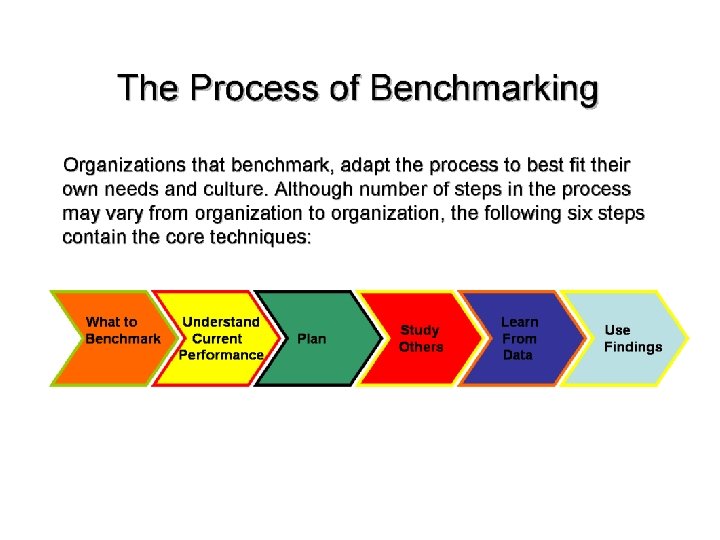
MODERN TECHNIQUES • Program Evaluation & Review Techniques (PERT) • Critical path method(CPM) • Gantt chart • benchmarking
")
Program Evaluation & Review Techniques (PERT)
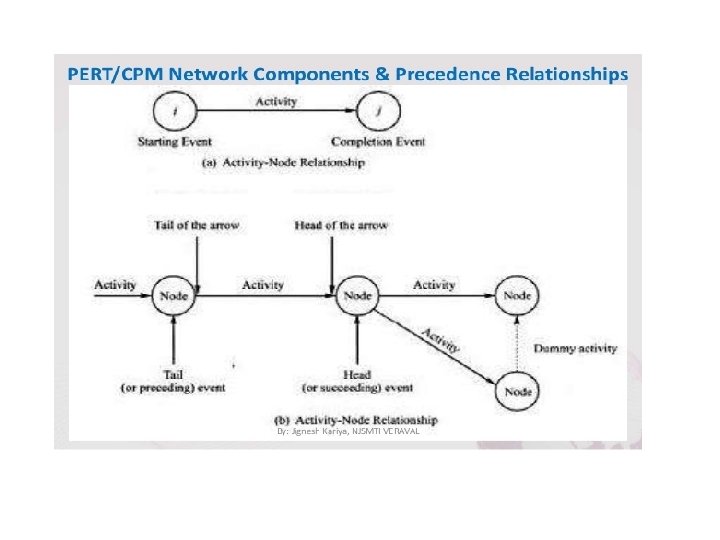

MAJOR CHARACTERISTICS • Optimistic time • Pessimistic time • Most likely time

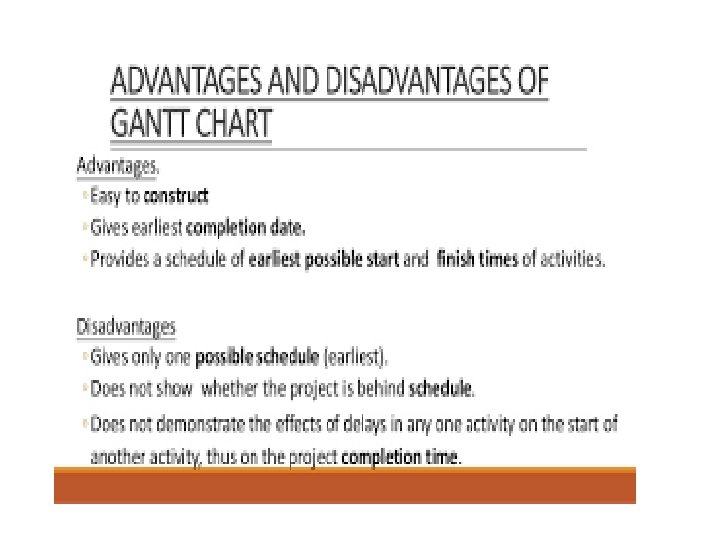
GANTT CHART

Information Technology • MIS provides the communication link that makes managing possible • MIS is defined as a formal system of gathering, integrating, comparing, analyzing and dispersing information internal and external to the enterprise in a timely, effective and efficient. • Electronic equipment permits fast and economical processing of huge amounts of data

Expansion of basic data • In traditional accounting information, aimed at calculation of profits, has been of limited value for control • Managers need all kinds of non accounting information above the external environmental such as social, economic, political and technical developments

Intelligent Services – To solve the problem of information overhead, the establishment of intelligent services and the development of a new profession of intelligence experts.

The use of Computers in Handling Information • Mainframe Computer • Mini Computer • Micro Computer

Business Applications § Material Requirements Planning § Manufacturing Resource Planning § Computer – aided control of Manufacturing machinery § Project costing § Inventory control § Purchasing § Design and Engineering (U. S. Space Program) § A/Cs receivable & Payable § Pay roll § Capital Budgeting § Financial Planning

Supervisory Level Scheduling, daily Planning & Controlling Middle level Managers Plant Managers Administration & Co-ordination Too Level Managers Strategy & Overall policy (Interaction between enterprise and environment)

Applications and Impacts of Microcomputers • • • Budget Preparation Graphic Presentation Electronic Spread Sheets Financial Analyses Word Processing Simulation Models Forecasting Electronic Mail Tapping into databases Time - sharing

Challenges created by IT – Resistance to Computer Applications – Speech Recognition Devices (then, than-to, too & two) – Telecommuting – Computer Networks – Internet

Digital Economy – The internet changing how business is conducted • e-mail, e- commerce, e-business, e-cash, e-travel, e-finance, e-loan, e-music, e-books & many eactivities. (Deleting intermediaries, reducing distribution costs)
 – Flyers can bid for airline tickets")
1. Consumer to Business (C 2 B) – Flyers can bid for airline tickets through priceline. com 2. Business to Consumers (B 2 C) – One can order books or other items from amazon. com 3. Consumer to Consumer (C 2 C) – Individual can sell items over the web through e. Bay 4. Business to Business (B 2 B) – These transactions are probably going to have the greatest impact on the economy – Ex. G. M & Ford plan to transfer all purchasing to the web with in next few years
( Palm")
M- Commerce • Development of WAP (Devices like cell phone, Personal Digital Assistance)( Palm Pilot)

Productivity – It is the input –output ratio with in a time period with due consideration for quality

Production Management – It is used to refer to those activities necessary to manufacture products. [purchasing, warehousing, transportation] Operations Management refers to activities necessary to produce and deliver a service as well as a physical product.

FACTORS AFFECTING PRODUCTIVITY • • • Technology Human resources Government policy Machinery and equipment design Skill of the workers Capital Research and development Trade unions Raw materials Job layout

PRODUCTIVITY MEASURES • Physical productivity • Functional productivity • Economic productivity

PROBLEMS IN MEASUREMENT OF PRODUCTIVITY • • Difficulty in measuring output Difficulty in measuring inputs Factorial productivity Changing conditions Service sector Different periods Difficulty in measuring man hours Technological change

Operations Management System

Product and Production Design

Product and Production Design • Create product ideas by searching for consumer needs and searching the various alternatives • Select the product on the basis of various considerations including data from market and economic analyses and make a general feasibility study • Prepare a preliminary design by evaluating various alternatives, taking into consideration reliability, quality and maintenance requirements.

• Reach a final decision by developing, testing and simulating the process to see if they work • Decide whether the enterprise’s current facilities are adequate or if new or modified facilities are required • Select the process for producing the product, consider the technology and the methods available • After the product is designed, prepare the layout of the facilities to be used, plan the system of production, and schedule the various things that must be done.

System Design 1. Layout in the order in which the product is produced or assembled 2. Layout according to the process employed (E. g. Clinic) 3. Fixed Position layout Ex. Printing Press, Ships 4. According to the nature of the project Ex. Bridge – Building or Tunnel 5. Arranged to facilitate the sale of products Ex. Super market 6. Layout facilitates storage or movement of products

PRODUCTION CONTROL • Process that keeps an eye on the production flow and size of resources along with the location of any deviation from the present action and to arrange for the prompt adjustment.

REASONS • • Increasing production Coordinating plant activity Cost control Rationalization of production activities.
 Inventory Planning and Control = Eo. Q")
Tools and Techniques for improving Productivity a) Inventory Planning and Control = Eo. Q D = Demand Per year S = Setup Costs H = Inventory holding cost per item, per year Goal: Optimal Total cost for purchasing or manufacturing, inventory holding and shortages
")
Inputs Purchasing / manufacturing cost per unit Goal Inputs Feedback measures Outputs (Planned events) Inventory cost per unit Purchasing / manufacturing Schedule Demand for product Shipping Schedule Distribution of product Reorder lead time Shipping costs and lead time Inventory Model Inventory Schedule Shortage probabilities
 Just – in – Time Inventory System (Japan) – Zero Inventory & stockless")
b) Just – in – Time Inventory System (Japan) – Zero Inventory & stockless Production Requirements • The quality of the parts must be very high • Dependable relationship & smooth cooperation with suppliers • Supplier should be located near the company
 Outsourcing USA & Europe – Products and operations are contracted to outside vendors")
c) Outsourcing USA & Europe – Products and operations are contracted to outside vendors that have expertise in a particular area
 Operations Research It is the application of scientific methods to the study of")
d) Operations Research It is the application of scientific methods to the study of alternatives in a problem situation, with a view to obtaining a quantitative basis for arriving at a best solution
 Value Engineering Analyzing the operations of the product/ service, estimating the value of")
e) Value Engineering Analyzing the operations of the product/ service, estimating the value of each operation, and attempting to improve that operation by trying to keep costs low at each step or part
 Work Simplification Process of obtaining the participation of workers in simplifying their work")
f) Work Simplification Process of obtaining the participation of workers in simplifying their work Training sessions are conducted to teach Time & motion studies Work flow analyses Layout of workstation
 Quality Circles It is a group of people from the same organizational area,")
g) Quality Circles It is a group of people from the same organizational area, who meet regularly to solve problems they experience at work
 Total Quality Management TQM involves the organization’s long term commitment to the continuous")
h) Total Quality Management TQM involves the organization’s long term commitment to the continuous improvement of quality – throughout the organization, and with the active participation of all members at all levels-to meet and exceed customers’ expectations. i) Learn Manufacturing Kaizen, Zero defects, JIT, Team Management j) Computer Aided Techniques – CAD, CAM
 Break Even Analysis It is a graphical method of analyzing and understand the")
k) Break Even Analysis It is a graphical method of analyzing and understand the relationships among sales volume, costs and revenues in any organization.

BEP : – The level of sales volume to which TR=TC – After the BEP, the organization begins to make profits Margin of safety = Actual Sales – Sales at BEP – Large angle of incidence means higher profits

Scope of BEA 1. It shows profit & losses at various levels of production 2. It gives relationship between revenue and output 3. Helps in budgeting and profit planning 4. It is a decision making tool in the hands of Management

Productivity It measures how well an organization is using its resources in producing its goods and services – It is defined as the ratio of output to input – Greater Productivity profitability leads to greater

Productivity Problems Causes of low productivity 1. Less skilled labor force 2. Less importance to R & D 3. Less ambitious workers 4. Worker’s attitude and loyalty 5. Government policies and regulation

Approaches to improve Productivity 1. Formulation of objectives 2. Performance against these objective 3. Effective reporting system 4. Reinforcing good performance 5. Knowledge workers 6. Principles and guidelines 7. Recognition of good performance 8. Preparing work modules 9. Emphasizing goals 10. Developing ability to work with people

Cost Control • Cost control can bring immediate savings and ensure that business remain competitive in the long term • Cost control is a continuous process that begins with the proposed annual budget. The budget helps • To organize and coordinate production and the selling, distribution, service and administrative functions • To take maximum advantage of available opportunities

For effective cost control, most organizations use standard cost systems, in which the actual costs are compared against standard cost for performance evaluation and the deviations are investigated for remedial actions.

Steps involved in cost control • Investigate procedures to detect variance of actual costs from budgeted costs • Diagnostic procedures to ascertain the causes of variance • Corrective procedures to effect realignment between actual and budgeted costs

Purchase Control – It provides link between inventory control system and the accounts payable system – It provides a means of recording purchase orders placed with the vendors and tracking the orders through the different phases of the receiving the product, back ordering and invoicing

Quality Control • It is concerned with checking and reviewing work that has been done • The basic goal of quality control is to ensure that the products, services or processes provided meet specific requirements and are dependable, satisfactory and fiscally sound.

QC system is designed to – Provide routine and consistent checks to ensure data integrity, correctness and completeness – Identify and address errors and omissions – Document and archive inventory material and record all QC activities

QC Tools

QC Tools – To improve the quality of the product a. Check Sheet : It is used to easily collect data. Decision making and actions are taken from the data b. Pareto Chart : It is used to define problems, to set their priority, to illustrate the problems detected and determine their frequency in process c. Cause & Effect Diagram : (Fishbone diagram) is used to figure out any possible causes of a problem. After the major causes are known, we can solve the problem accurately.
 Histogram : Shows a bar chart of accumulated data and provides the easiest")
d) Histogram : Shows a bar chart of accumulated data and provides the easiest way to evaluate the distribution of data e) Scatter Diagram : Is a graphical tool that plots many data points and shows a pattern of correlation between two variables
 Flow Chart : shows the process step by step and can sometimes identify")
f) Flow Chart : shows the process step by step and can sometimes identify an unnecessary procedure g) Control Chart : provides control limits which are generally three standard deviations above and below average, whether or not our process is in control

International Management – International business engage in transactions across national boundaries – These transactions include transfer of goods, services, technology, managerial knowledge and capital to other countries – [Exportation, Licensing Agreement, Management Contracts, Joint Ventures and strategic alliances & subsidiaries]

Advantages of MNC • Advantages of business opportunities in many countries • Raise money for its operations, throughout the world • Better access to national resources and materials may not be available to domestic firms • Recruit managers & other personnel from a world wide labor pool.

Challenges in Multinationals – Increasing nationalism in many countries – Years ago, developing countries lacked managerial marketing & technical skills. Now people in developing countries acquiring those skills – Government frequently change & corporations must deal with and adapt to these changes

France • Government planning on a national scale i. e helps coordinate the plans of individual industries and companies • The government aim is to utilize most effectively the country’s resources and to avoid expansion in uneconomic areas • At times, the plan becomes a global strategy helping specific industries(Electronic)
 • In the past benevolent authoritarianism • Codetermination which require")
Germany (Authority & Codetermination) • In the past benevolent authoritarianism • Codetermination which require labor membership in the supervisory board and the executive committee of certain large corporations • Labor director is elected as a member of the executive committee

Korean Management – It is simply an extension of Japanese Management – Korean Organizations are quite hierarchical, with family members occupying key positions – Beyond blood relationships the factors affecting hiring decisions often include the school attended it being from the same geographic region as the top person – The lead ship style can best be described as topdown, or autocratic/ Paternalistic – So the firm adjust quickly to the demands in the environment – Life time employment does not prevail – Labor turnover rates are high

Japanese Management • Life time Employment • Consensus decision making (Change & new ideas come primarily from below) • Theory X – Emphasis on interpersonal skills needed for group interaction – Emphasis on group decision making, responsibility remains with the individual – Emphasis on informal and democratic relationships based on trust. – (Now IBM, HP, Dayton – Hudon followed this)

Porter’s competitive advantages of Nations – He suggests four sets of factors that contribute to a nation’s well being First Set : Nation’s resources, its labor costs & the skills and education of its people Second set : Demand conditions of a nation • Market size, the way product may be advertized • Degree of consumer sophistication

Third Set : – Concern for suppliers – A company prospers when supporting companies are located in the same area Fourth Set : – Firm’s strategy and structure as well as rivalry among the competitors

Australia Country’s moralistic stance and its emphasis on political and social values, achievement & risk taking Italians • In the environment of low tolerance for risks • Very competitive & group decision making

Austria • Self realization and leadership • Independence & competitiveness are valued • Tolerance for risk taking is low Britain § Security, resourcefulness, adaptability and logic

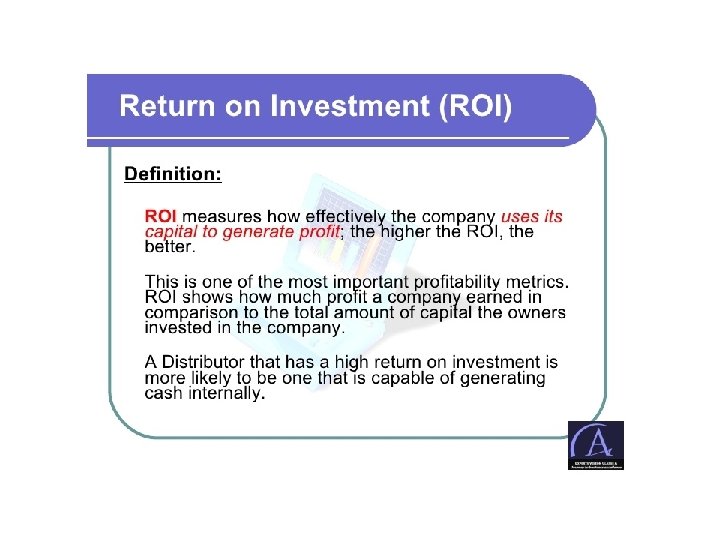
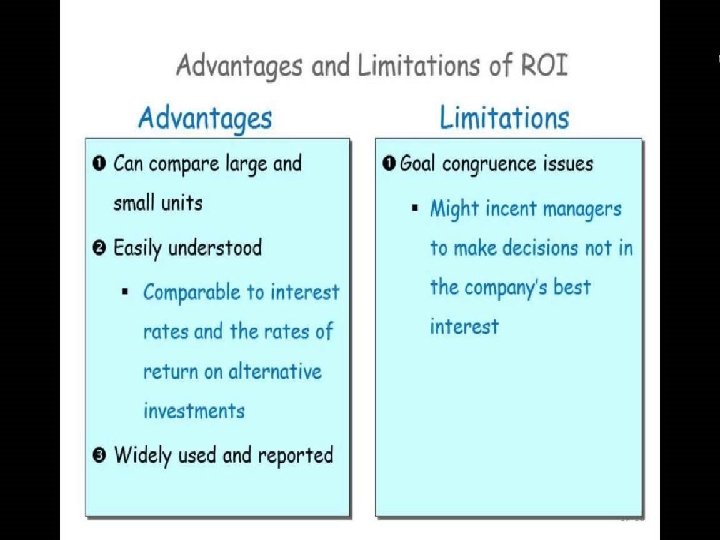
Control of overall Performance – Profit and loss control – Control through ROI Direct Control To compare the actual output of goods or services in terms of quantity, quality, time & cost with plans

Cause of Negative Deviations from standards • Uncertainty • Lack of knowledge, experience or judgment Preventive Control The higher the quality of managers and their subordinates, the less will be the need for direct controls

Developing Excellent Managers Ø Instilling a willingness to learn Ø Accelerating Management Development Ø Planning for Innovation Ø Measuring and Rewarding Management Ø Tailoring Information Ø Expanding Research & Development in Tools & Techniques Ø Developing more Managerial Inventions Ø Creating strong Intellectual leadership
- Slides: 114