Control System Instrumentation Standard Instrument Signals Pneumatic air

: 3 – 15 psig • Electrical: 4")


 hysteresis, (b) dead band.")


 energy")

")


")


- Slides: 37
Control System Instrumentation
Standard Instrument Signals • Pneumatic (air pressure): 3 – 15 psig • Electrical: 4 – 20 m. A • I/P or E/P transducer
Chapter 9 Transducers and Transmitters • Figure 9. 3 illustrates the general configuration of a measurement transducer; it typically consists of a sensing element combined with a driving element (transmitter). • Since about 1960, electronic instrumentation has come into widespread use.
Sensors Chapter 9 The book briefly discusses commonly used sensors for the most important process variables. (See text. ) Transmitters • A transmitter usually converts the sensor output to a signal level appropriate for input to a controller, such as 4 to 20 m. A. • Transmitters are generally designed to be direct acting. • In addition, most commercial transmitters have an adjustable input range (or span). • For example, a temperature transmitter might be adjusted so that the input range of a platinum resistance element (the sensor) is 50 to 150 °C.
Chapter 9
Chapter 9
Range and Scale Factor
Transfer Function – Nonlinear Case
Chapter 9
Measurement / Transmission Lags Chapter 9 • Temperature sensor make as small as possible (location, materials for thermowell) • Pneumatic transmission lines usually pure time delay, measure experimentally (no time delays for electronic lines); less common today compared to electronic transmissions.
Chapter 9 Transmitter/Controller May need additional transducers for Gm if its output is in m. A or psi. In the above case, Gc is dimensionless (volts/volts).
Measurement Errors • Systematic errors – Drift: slowly changing instrument output when input is constant. – Nonlinearity – Hysteresis or backlash – Dead band – Dynamic error • Random errors
Chapter 9 Figure 9. 15 Nonideal instrument behavior: (a) hysteresis, (b) dead band.
Chapter 9
Chapter 9
Precision, Resolution, Accuracy and Repeatability • Precision can be interpreted as the number of significant digits in measurement, but more accurately it refers to the least significant digit which contains valid information, e. g. , 0. 01 in the present case. Therefore, 0. 33 is more precise than 0. 3. • Resolution is defined as the smallest change in the input that will result in a significant change in the transducer output. • Repeatability is +/- 0. 02 in the present case. • Accuracy is 0. 39 -0. 25=0. 14, i. e. , maximum error.
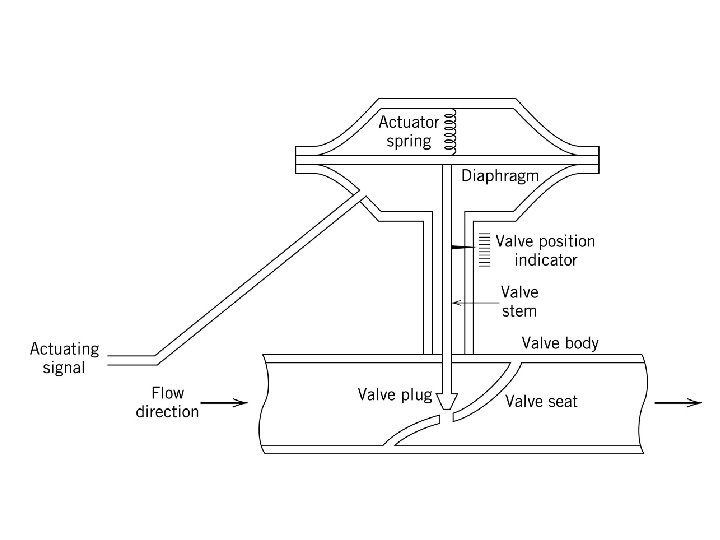
Final Control Elements • The most-common manipulated variables to be adjusted are: (1) energy flow rates, and (2) material flow rates. • Type (1): transducer + heating element • Type (2): transducer + control valve (pump drive, screw conveyer, blower, etc. )
Chapter 9
Control Valve Characteristics (Inherent)
Chapter 9
Chapter 9
Pressure Drop Across Control Valve Installed On-Line In practical applications, one must take other flow obstructions into account for actual valve performance.
Design Guideline
Chapter 9
Design Calculation for a Linear Valve
Rangeability (Turn-Down Ratio)
Example
Installed Valve Characteristics • Desired behavior: the flow rate is a linear function of valve lift. • Let us assume that the control valve has linear trim and it is necessary to increase the flow rate. If p through exchanger did not change, then valve would behave linearly (true for low flow rates), since it takes most of p. For higher flow rates, p through exchanger will be important, changing effective valve characteristics (valve must open more than expected nonlinear behavior).
Linear Valve Behavior
Equal-Percentage Valve Characteristics
Chapter 9
Chapter 9
Control Valve Transfer Function