Control Charts for Count of Nonconformities q The


:")


 Number of pin holes in enamel wire, the length (m)")
 Number of pin holes in enamel wire, the length (m)")
 The defects per square meter of fabric UCL = 10.")
- Slides: 14
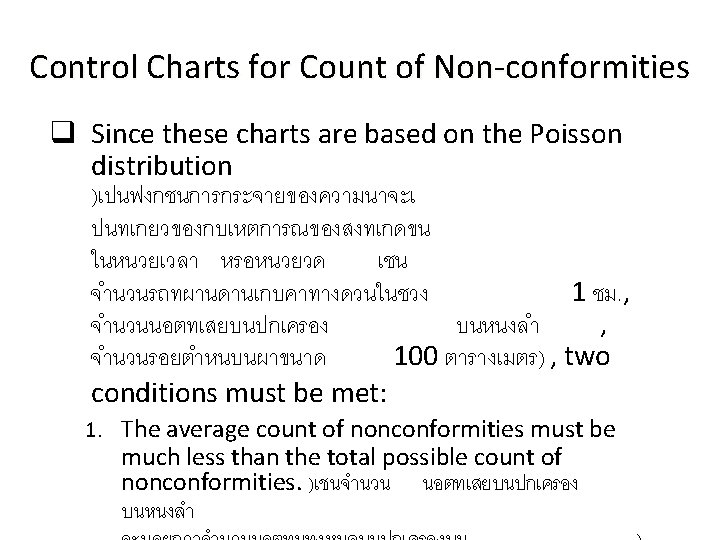
Control Charts for Count of Nonconformities q The nonconformities chart controls the count of nonconformities) ขอบกพรอง หรอตำหน ) within the product or service. q An item is classified as a nonconforming unit whether it has one or many nonconformities. q Count of nonconformities per unit (u) chart. )ใชตดตามและควบคมสดสวนของขอบกพร องตอหนวยตวอยาง โดยขนาดของหนวยตวอยาง (sample size) มขนาดเทากนหรอไมกได ( q Count of nonconformities (c) chart. )ใชตดตามและควบคมจำนวนของขอบกพรองตอตวอยาง โดยขนาดของหนวยตวอยาง (sample size) มขนาดเทากน (
Control Charts for Count of Non-conformities Objectives: 1. Determine the average quality level: This information gives the initial process capability. 2. Bring to the attention of management any changes in the average. 3. Improve the product quality: Ideas for quality improvement.
Control Charts for Count of Non-conformities Objectives cont’d. : 4. Evaluate the quality performance of operating and management personnel. 5. Suggest places to use X bar and R chart. 6. Determine acceptance criteria of a product before shipment to the customer.
Control Charts for Count of Non-conformities/unit u Chart construction: 1. Select the quality characteristic(s): a) Single quality characteristic. b) Group of quality characteristics. c) A part. d) An entire product. e) A number of products. f) It can be established for performance control of an: operator, work center, department, shift, plant, or corporation
Control Charts for Count of Non-conformities/unit C Chart construction cont’d: 2. Determine the subgroup size and method: 3. Collect the data: q At least 25 subgroups.
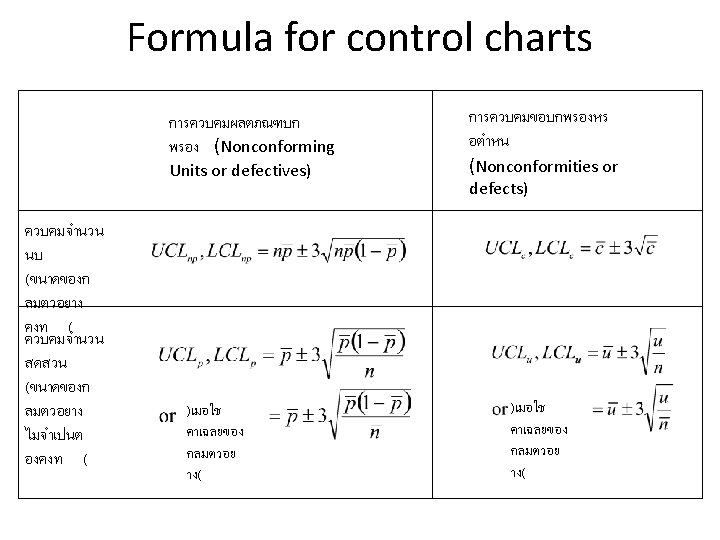
Control Charts for Count of Non-conformities/unit c-Chart Construction cont’d: 4. Calculate the trial central line and the control limits: )เมอใช คาเฉลยของ กลมตวอย าง(
Control Charts for Count of Non-conformities C chart construction cont’d: 5. Establish the revised central line and control limits
Control Charts for Count of Non-conformities C chart construction cont’d: 6. Achieve the objectives: The reason for the control chart is to achieve one or more of the previously stated objectives.
Control Charts for Count of Non-conformities/Unit c Chart for Count of Nonconformities
Control chart (example 3) Number of pin holes in enamel wire, the length (m) of samples varies
Control chart (example 3) Number of pin holes in enamel wire, the length (m) of samples varies
Control chart (example 4) The defects per square meter of fabric UCL = 10. 2 LCL = 0