control chart The control chart is a graph


")


 List Technical Descriptors (How’s) Develop")


 A company-wide team-based effort to build quality into equipment and")
 TPM combines the traditionally American practice of preventive maintenance with")

 Improve existing planned maintenance systems The")


 Train the operators")
 7 steps are")


 The tools of")
 Typical membership of")


 The principle of designing")
 Existing machines: ◦ analyze")


- Slides: 64
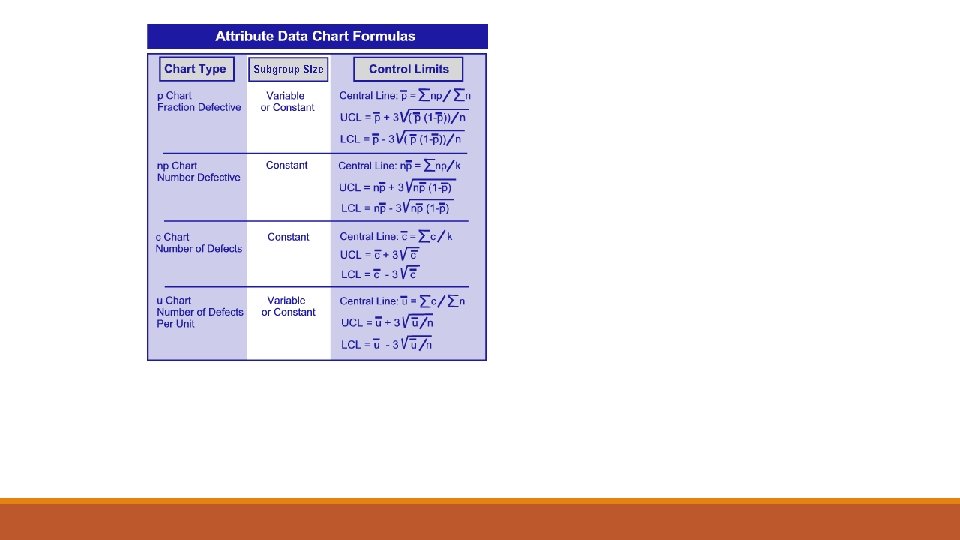
control chart The control chart is a graph used to study how a process changes over time. Data are plotted in time order. A control chart always has a central line for the average, an upper line for the upper control limit and a lower line for the lower control limit. These lines are determined from historical data.
Steps in Constructing a c Control Chart • Gather the data. a. Select the subgroup size. . • Plot the data. a. Select the scales for the control chart. . • Calculate the process average. a. Calculate the process average number of defects ( c): . . . • Calculate the control limits. a. . • Interpret the chart for statistical control. a.
Quality Function Deployment (QFD)
QFD Team Significant Amount Of Time ◦ Communication Two Types Of Teams ◦ New Product ◦ Improve Existing Product Marketing, Design, Quality, Finance, Production, Etc.
Benefits Of QFD Customer Driven Reduces Implementation Time Promotes Teamwork Provides Documentation
Voice Of The Customer Driving Force Behind QFD ◦ Customer Dictates Attributes Of Product Customer Satisfaction ◦ Meeting Or Exceeding Customer Expectations ◦ Customer Expectations Can Be Vague & General In Nature ◦ Customer Expectations Must Be Taken Literally, Not Translated Into What The Organization Desires
Collecting Customer Information What Does Customer Really Want ? What Are Customer’s Expectations ? Are Customer’s Expectations Used To Drive Design Process ? What Can Design Team Do To Achieve Customer Satisfaction?
House Of Quality 5. Interrelationship between Technical Descriptors 6. Relationship between Requirements and Descriptors 4. Prioritized Technical Descriptors 2. Prioritized Customer Requirements 1. Customer Requirements (Voice of the Customer) 3. Technical Descriptors (Voice of the organization)
Building A House Of Quality List Customer Requirements (What’s) List Technical Descriptors (How’s) Develop Relationship (What’s & How’s) Develop Interrelationship (How’s) Competitive Assessments Prioritize Customer Requirements Prioritize Technical Descriptors
Prioritized Customer Requirements Importance Rating Target Value Scale-Up Factor Sales Point Absolute Weight & Percent ◦ (Importance Rating) ◦ (Scale-Up Factor) ◦ (Sales Point)
QFD Summary Orderly Way Of Obtaining Information & Presenting It Shorter Product Development Cycle Considerably Reduced Start-Up Costs Fewer Engineering Changes Reduced Chance Of Oversights During Design Process Environment Of Teamwork Consensus Decisions Preserves Everything In Writing
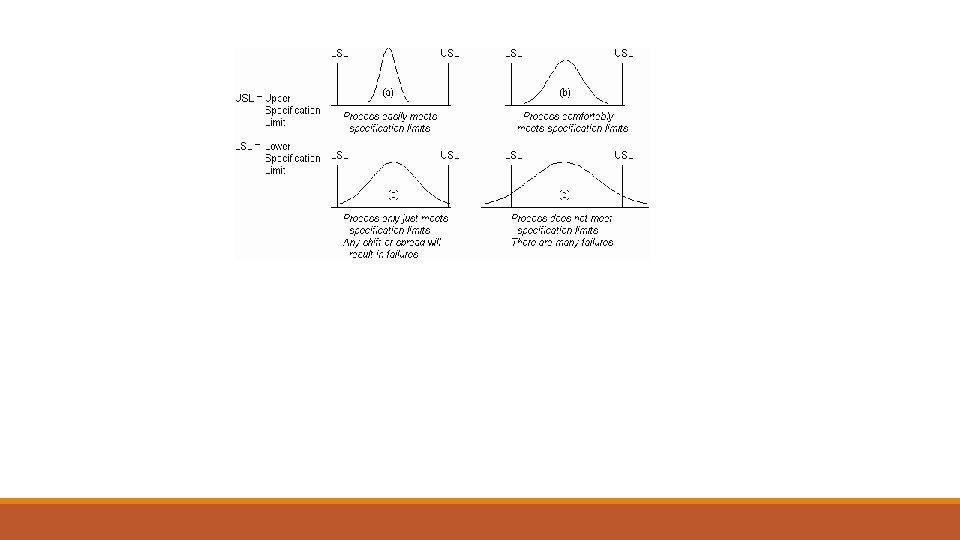
In process improvement efforts, the process capabilityindex or process capability ratio is a statistical measure ofprocess capability: the ability of a process to produce output within specification limits. The concept of process capability only holds meaning for processes that are in a state of statistical control.
he process capability is a measurable property of a process to the specification, expressed as a process capability index (e. g. , Cpk or Cpm) or as a process performance index(e. g. , Ppk or Ppm). The output of this measurement is usually illustrated by a histogram and calculations that predict how many parts will be produced out of specification (OOS). Two parts of process capability are: 1) measure the variability of the output of a process, and 2) compare that variability with a proposed specification or product tolerance.
Genichi Taguchi TAGUCHI’S QUALITY LOSS FUNCTI ON
INTRODUCTION Taguchi Methods is a statistical methods developed largely by GENICHI TAGUCHI to improve quality of manufactured goods. The philosophy of off-line quality control. Innovations in the design of experiments.
Taguchi Loss Function Definition Taguchi defines Quality as “the loss imparted by the product to society from the time the product is shipped. ” LOSS = Cost to operate, Failure to function, maintenance and repair cost, customer satisfaction, poor design. Product to be produced “being within specification”
Taguchi’s Vs Traditional Approach Taguch’s Traditional When a product There is Good or Bad moves from its Target Products only as per will cause the loss Limits even if the product lies or not within Limits
Taguchi’s Quadratic Quality Loss Function Quality Loss Occurs when a product’s deviates from target or nominal value. Deviation Grows, then Loss increases. Taguchi’s U-shaped loss Function Curve.
Taguchi’s U-shaped loss Function Curve. Taguchi loss Fn Scrap or Rework Cost. Loss Measured characteristic LTL Nominal UTL
Formula to find Taguchi’s Loss Fn Taguchi uses Quadratic Equation to determine loss Curve L (x) = k (x-N)² Where L (x) = Loss Function, k = C/d² = Constant of proportionality, where C – Loss associated with sp limit value d - Deviation of specification x = Quality Features of selected product, N = Nominal Value of the product and (x-N) = Tolerance from target
Problem A part dimension on a power tool is specified as 32. 25± 0. 25. Company records show± 0. 25 exceeded & 75% of the returned fo replacement. Cost of replacement is Rs. 12, 500. Determine k & QLF. Solution : Expected Cost of repair C = 0. 75(12500) = Rs 9, 375 k = C/d²= 9375/(90. 25)² = Rs 1, 50, 000 QLF =L (x) 1, 50, 00(x-N)
1. TPM definition (1) A company-wide team-based effort to build quality into equipment and to improve overall equipment effectiveness Total ◦ all employees are involved ◦ it aims to eliminate all accidents, defects and breakdowns Productive ◦ actions are performed while production goes on ◦ troubles for production are minimized Maintenance ◦ keep in good condition ◦ repair, clean, lubricate © Imants BVBA http: //www. managementsupport. com
1. TPM definition (2) TPM combines the traditionally American practice of preventive maintenance with Total Quality Control and Total Employee Involvement, to create a culture where operators develop ownership of their equipment, and become full partners with Maintenance, Engineering and Management to assure equipment operates properly everyday. © Imants BVBA http: //www. managementsupport. com
2. Origins of TPM Dr. Deming introduced statistical analysis and used the resulting data to control quality during manufacturing (TQM) Some general concepts of TQM did not work well in the maintenance environment The need to go further than preventive maintenance was quickly recognized by those companies who were committed to TQM Maintenance became an integral part of TQM in the early 90’s © Imants BVBA http: //www. managementsupport. com
3. TPM principles Increase Overall Equipment Effectiveness (OEE) Improve existing planned maintenance systems The operator is the best condition monitor Provide training to upgrade operations and maintenance skills Involve everyone and utilize cross-functional teamwork © Imants BVBA http: //www. managementsupport. com
6. TPM Benefits Increased equipment productivity Reduced equipment downtime Increased plant capacity Lower maintenance and production costs Approaching zero equipment-caused defects Enhanced job satisfaction Increased Return On Investment © Imants BVBA http: //www. managementsupport. com
© Imants BVBA http: //www. managementsupport. com Education and training Safety and environmental management TPM in the office Process quality management Early management of new equipment Equipment and process improvement Planned Maintenance Autonomous Maintenance 4. Eight major pillars of TPM
4. Eight major pillars of TPM 4. 1. Autonomous Maintenance (1) Train the operators to close the gap between them and the maintenance staff, making it easier for both to work as one team Change the equipment so the operator can identify any abnormal conditions and measure deterioration before it affects the process or leads to a failure © Imants BVBA http: //www. managementsupport. com
4. Eight major pillars of TPM 4. 1. Autonomous Maintenance (2) 7 steps are implemented to progressively increase operators knowledge, participation and responsibility for their equipment ◦ ◦ ◦ ◦ 1. Perform initial cleaning and inspection 2. Countermeasures for the causes and effects of dirt and dust 3. Establish cleaning and lubrication standards 4. Conduct general inspection training 5. Carry out equipment inspection checks 6. Workplace management and control 7. Continuous improvement © Imants BVBA http: //www. managementsupport. com
4. Eight major pillars of TPM 4. 2. Equipment and process improvement Objective: maximize efficiency by eliminating waste and manufacturing losses Manufacturing losses are categorized into 13 big losses: ◦ Equipment losses (6) ◦ Manpower losses (4) ◦ Material losses (3) © Imants BVBA http: //www. managementsupport. com
4. Eight major pillars of TPM 4. 2. Equipment and process improvement 4. 2. 1. Equipment losses Downtime loss Equipment failure / breakdowns Set-up / adjustments Minor stopping / idling Speed loss Reduced speed Process errors Quality loss Rework / scrap © Imants BVBA http: //www. managementsupport. com
4. Eight major pillars of TPM 4. 2. Equipment and process improvement 4. 2. 2. Manpower and material losses Cleaning and checking Manpower losses Waiting materials Waiting instructions Waiting quality confirmation Material yield Material losses Energy losses Consumable material losses © Imants BVBA http: //www. managementsupport. com
4. Eight major pillars of TPM 4. 2. Equipment and process improvement 4. 2. 3 Overall Equipment Effectiveness (OEE) OEE figures are determined by combining the availability and performance of your equipment with the quality of parts made OEE measures the efficiency of the machine during its planned loading time. Planned downtime does not effect the OEE figure. © Imants BVBA http: //www. managementsupport. com
4. Eight major pillars of TPM 4. 2. Equipment and process improvement 4. 2. 3 Overall Equipment Effectiveness (OEE) Overall Equipment Effectiveness = Availability x Performance x Quality Yield Downtime loss Availability Performance Quality Yield © Imants BVBA http: //www. managementsupport. com Speed loss Quality loss
4. Eight major pillars of TPM 4. 2. Equipment and process improvement 4. 2. 3 Overall Equipment Effectiveness (OEE) Overall Equipment Effectiveness = Availability x Performance x Quality Yield Availability = time available for production - downtime available for production Performance = ideal cycle time x number of parts produced operating time Quality Yield = total number of parts produced - defect number total number of parts produced © Imants BVBA http: //www. managementsupport. com
4. Eight major pillars of TPM 4. 3. Planned maintenance Objective: establish Preventative and Predictive Maintenance systems for equipment and tooling Natural life cycle of individual machine elements must be achieved ◦ ◦ ◦ ◦ Correct operation Correct set-up Cleaning Lubrication Retightening Feedback and repair of minor defects Quality spare parts © Imants BVBA http: //www. managementsupport. com
4. Eight major pillars of TPM 4. 4. Early Management of new equipment Objective: establish systems to shorten ◦ new product or equipment development ◦ start-up, commissioning and stabilization time for quality and efficiency New equipment needs to be: ◦ ◦ ◦ easy to operate easy to clean easy to maintain and reliable have quick set-up times operate at the lowest life cycle cost © Imants BVBA http: //www. managementsupport. com
4. Eight major pillars of TPM 4. 5. Process Quality Management Definition: a process for controlling the condition of equipment components that affect variability in product quality Objective: to set and maintain conditions to accomplish zero defects Quality rate has a direct correlation with ◦ ◦ material conditions equipment precision production methods process parameters © Imants BVBA http: //www. managementsupport. com
4. Eight major pillars of TPM 4. 6. TPM in administrative and support departments Administrative and support departments can be seen as process plants whose principal tasks are to collect, process, and distribute information Process analysis should be applied to streamline information flow © Imants BVBA http: //www. managementsupport. com
4. Eight major pillars of TPM 4. 7. Education and training TPM is a continuous learning process. 2 major components ◦ soft skills training: how to work as teams, diversity training and communication skills ◦ technical training: upgrading problem-solving and equipment- related skills © Imants BVBA http: //www. managementsupport. com
4. Eight major pillars of TPM 4. 8. Safety and environmental management Assuring safety and preventing adverse environmental impacts are important priorities in any TPM effort © Imants BVBA http: //www. managementsupport. com
5. TPM implementation 3 requirements for fundamental improvement Increasing motivation: changing peoples attitudes Increasing competency and peoples skills Improving the work environment, so that it supports the establishment of a program for implementing TPM © Imants BVBA http: //www. managementsupport. com
5. TPM Implementation 12 steps Announcement to introduce TPM Introductory education campaign for the workforce Preparation TPM Promotion (special committees) Establish basic TPM policies and goals Preparation and Formulation of a master plan Kick-off Invite customers, affiliated companies and subcontractors Develop an equipment management program Develop a planned maintenance program Implementation Develop an autonomous maintenance program Increase skills of production and maintenance personnel Develop early equipment management program Stabilization © Imants BVBA http: //www. managementsupport. com Perfect TPM implementation and raise TPM levels
5. TPM Implementation 5. 1. Announce top management’s decision to introduce TPM State TPM objectives in a company newsletter Place articles on TPM in the company newspaper © Imants BVBA http: //www. managementsupport. com
5. TPM Implementation 5. 2. Introductory education campaign Seminars for managers Slide presentations for all employees © Imants BVBA http: //www. managementsupport. com
5. TPM Implementation 5. 3. TPM Promotion Special committees at every level to promote TPM Newsletters Articles Videos Posters © Imants BVBA http: //www. managementsupport. com
5. TPM Implementation 5. 4. Establish basic TPM policies and goals Analyze existing conditions Set goals Predict results © Imants BVBA http: //www. managementsupport. com
5. TPM Implementation 5. 5. Preparation and Formulation of a master plan A master plan lays out your goals, what you will do to achieve them and when you will achieve them Detailed plans for each pillar have to be prepared © Imants BVBA http: //www. managementsupport. com
5. TPM Implementation 5. 6. TPM kick-off The main kick-off to TPM should take the form of a formal presentation with all the employees attending This opportunity can be used to gain the full support of the employees Invite external customers, affiliated and subcontracting companies © Imants BVBA http: //www. managementsupport. com
5. TPM Implementation 5. 7. Develop an equipment management program (1) The tools of Total Quality Management and Continuous Improvement are applied to the management and improvement of equipment Form project teams Select model equipment ◦ identify equipment problems ◦ analyze equipment problems ◦ develop solutions and proposals for improvement © Imants BVBA http: //www. managementsupport. com
5. TPM Implementation 5. 7. Develop an equipment management program (2) Typical membership of a team ◦ five to seven operators ◦ a maintenance person ◦ a technical expert Tools ◦ ◦ Pareto Cause & effect Root cause Methods Analysis © Imants BVBA http: //www. managementsupport. com
5. TPM Implementation 5. 8. Develop a planned maintenance program Set up plans and schedules to carry out work on equipment before it breaks down, in order to extend the life of the equipment Include periodic and predictive maintenance Include management of spare parts and tools © Imants BVBA http: //www. managementsupport. com
5. TPM Implementation 5. 8. Develop a autonomous maintenance program A handing-over of maintenance tasks from specialized maintenance personnel to production operators Promote the seven steps Tasks to hand over ◦ ◦ cleaning lubricating inspecting set-up and adjustment © Imants BVBA http: //www. managementsupport. com
5. TPM Implementation 5. 10. Increase skills of production and maintenance personnel The training sessions must be planned shortly after the kick-off presentation. 2 major components ◦ soft skills training ◦ technical training Train leaders together Have leaders share information with group members © Imants BVBA http: //www. managementsupport. com
5. TPM Implementation 5. 11. Develop early equipment management program(1) The principle of designing for maintenance prevention can be applied to new products, and to new and existing machines. New products must be designed so that they can be easily produced on new or existing machines New machines must be designed for easier operations, changeover and maintenance © Imants BVBA http: //www. managementsupport. com
5. TPM Implementation 5. 11. Develop early equipment management program(2) Existing machines: ◦ analyze historical records for ◦ trends of types of failures ◦ frequency of component failures ◦ root causes of failures ◦ determine how to eliminate the problem and reduce maintenance through an equipment design change or by changing the process © Imants BVBA http: //www. managementsupport. com
Measurement Tools 1. Graphs show changes and/or trends qualitatively 2. Control chart: to show when there are problems in the system 3. Capability index, Cp > 1. 33 4. Loss function 5. Quality cost 6. Malcom Baldrige National Quality Award 7. Others.
Quality Cost 1. Preventive cost 2. Appraisal cost 3. Internal failure cost 4. External failure cost
Preventive Cost: Any Efforts to Help People “Do it right the first time and all the time. ” Marketing, customer/user interaction Product/service/design development Purchasing and vendor partnership Operations (manufacturing/services) Quality engineering Quality administration Other prevention costs
Appraisal Cost: Testing, inspection and related equipment/supplies Purchasing appraisal cost: incoming goods or products Appraisal operations: testing and inspection External appraisal: field test outside company Data review Cost supporting appraisal efforts.
Internal Failure Cost: Defects/problems prior to shipping Product design failure Service failure Purchasing failure: incoming part failure Defectives/rejects/scraps/downgrading Repair or rework Materials review Corrective actions
External Failure Cost: Problems after Shipping Complaint investigations Problem solving Failure analysis Returned goods Retrofit and recall Warranty claims Liability costs Penalties Others