Control Chart for Attributes 1 Control Charts Continuous

Control Chart for Attributes 1

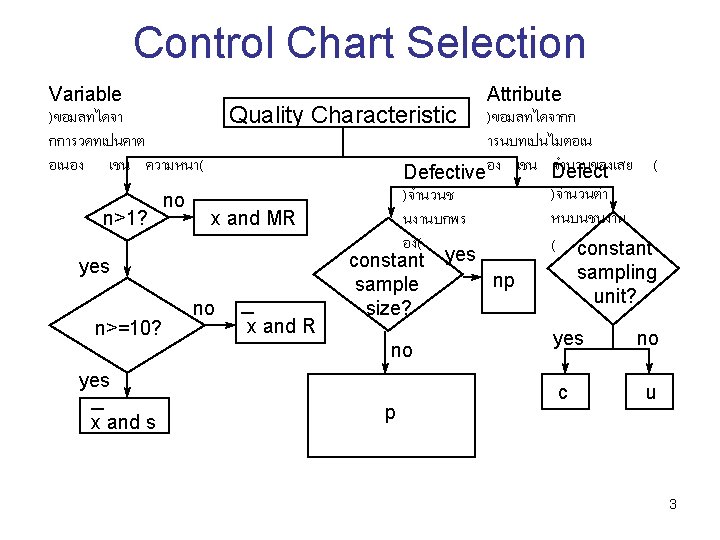
Control Charts Continuous Numerical Data Discrete Numerical Data Variables Charts R Chart X Chart Attributes Charts P Chart C Chart

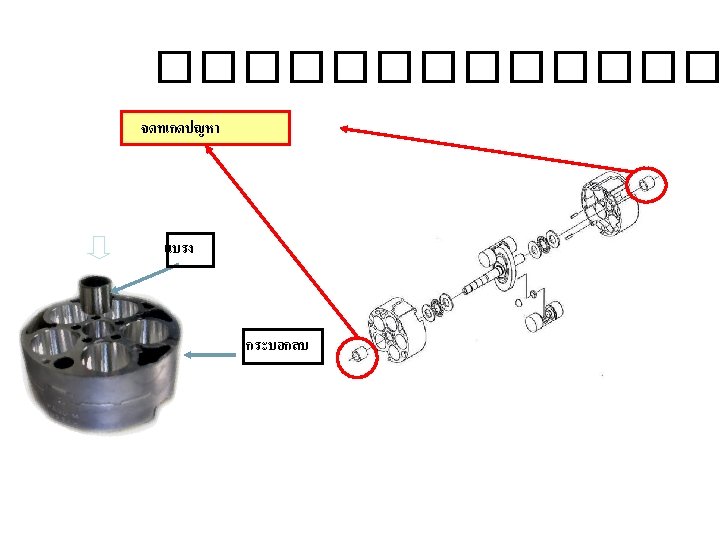
Good and Bad part GOOD BAD PART
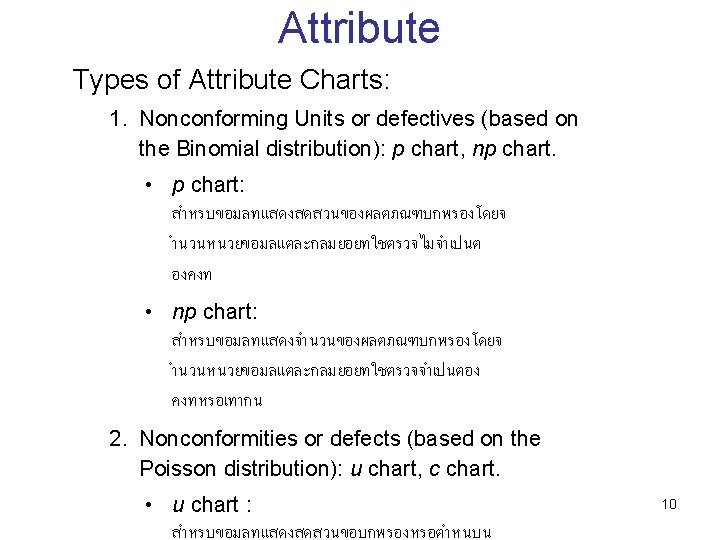

The P Chart Formula: q The fraction nonconforming, p, is usually small, say, 0. 10 or less. q Because the fraction nonconforming is very small, the subgroup sizes must be quite large to produce a meaningful chart.

The P Chart q It can be used to control one quality characteristic, as is done with X bar and R chart, q Or to control a group of quality characteristics of the same type or of the same part, q Or to control the entire product. q It can be established to measure the quality produced by a work center, by a department, by a shift, or by an entire plant.

The P Chart q It is frequently used to report the performance of an operator, group of operators, or management as a means of evaluating their quality performance. q The subgroup size of the P chart can be either variable or constant.

The P Chart Objectives of the P Chart: 1. Determine the average quality level: This information provides the process capability in terms of attributes. 2. Bring to the attention of management any changes in the average. 3. Improve the product quality: Ideas for quality improvement.

The P Chart Objectives of the P Chart cont’d: 4. Evaluate the quality performance of operating and management personnel. 5. Suggest places to use X bar and R chart: They are more sensitive to variation. 6. Determine acceptance criteria of a product before shipment to the customer.
:")
The P Chart P-Chart Construction for Constant Subgroup Size 1. Select the quality characteristic(s): a) b) c) d) e) f) Single quality characteristic. Group of quality characteristics. A part. An entire product. A number of products. It can be established for performance control of an operator, work center, department, shift, plant, or corporation

The P Chart Construction for Constant Subgroup Size. 2. Determine the subgroup size and method: q The size of the subgroup is a function of the proportion nonconforming. q A minimum size of 50 is suggested as a starting point.

The P Chart Construction for Constant Subgroup Size. 3. Collect the data: q At least 25 subgroups. q Different sources (Check sheet). q For each subgroup the proportion nonconforming is calculated by the formula P = np/n

The P Chart Construction for Constant Subgroup Size. 4. Calculate the trial central line and the control limits:

The P Chart Construction for Constant Subgroup Size cont’d. 5. Establish the revised central line and control limits.

The P Chart Construction for Variable Subgroup Size 1. Collect the data. 2. Determine the trial central line and control limits: Since the subgroup size changes each day, limits must be calculated for each day.

The P Chart Construction for Variable Subgroup Size. 2. As the subgroup size gets larger, the control limits are closer together. 3. Establish revised central line and control limits:

The P Chart Minimizing the Effect of Variable Subgroup Size 1. Control limits for an average subgroup size: By using an average subgroup size, one limit can be calculated and placed on the control chart.

The P Chart Minimizing the Effect of Variable Subgroup Size cont’d. Case I: This case occurs when a point (subgroup fraction nonconforming) falls inside the limits and its subgroup size is smaller than the average subgroup size. Case II: This case occurs when a point (subgroup fraction nonconforming) falls inside the average limits and its subgroup size is larger than the average subgroup size.

The P Chart Minimizing the Effect of Variable Subgroup Size cont’d. Case III: This case occurs when a point (subgroup fraction nonconforming) falls outside the limits and its subgroup size is larger than the average subgroup size. Case IV: This case occurs when a point (subgroup fraction nonconforming) falls outside limits and its subgroup size is less than the average subgroup size.
: q The np chart is easier for")
The np Chart Number Nonconforming Chart (np): q The np chart is easier for operating personnel to understand than the p chart. q The limitation that this chart has is that the subgroup size needs to be constant.
: q If the fraction nonconforming po is")
The np Chart Number Nonconforming Chart (np): q If the fraction nonconforming po is unknown, then it must be determine by collecting data, calculating trial control limits, and obtaining the best estimate of po.

Process Capability q For an attribute this process is much simpler. q The process capability is the central line of the control chart. q Management is responsible for the capability. q When the plotted point is outside the control limit, operating personnel are usually responsible.
 Fraction defective for electric machine part")
Control chart (example 1) Fraction defective for electric machine part
 The data of electroplating part defectives, the sample size =")
Control chart (example 2) The data of electroplating part defectives, the sample size = 100 UCL = 10. 39 LCL = 0
")
Control chart (example 2)
- Slides: 31