Contrast Echocardiography DR PRASANTH S Introduction US contrast


 Shell composition Gas content indication AI-700 2. 9")


- Slides: 71
Contrast Echocardiography • DR PRASANTH S
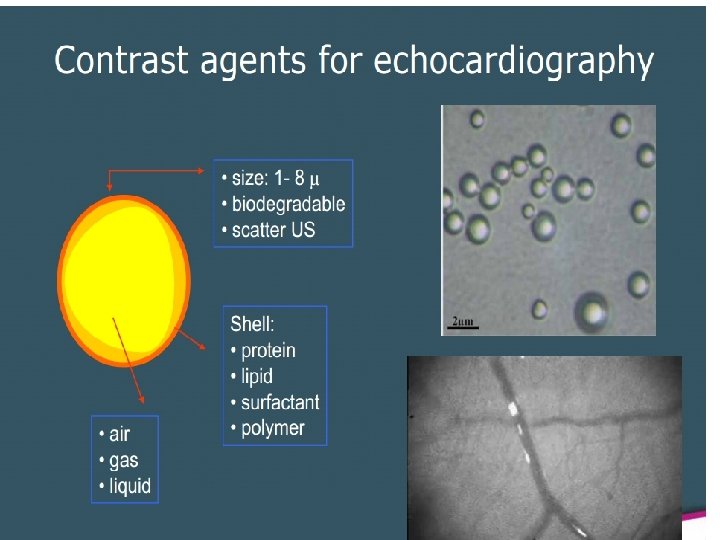
Introduction • US contrast agents first used- mid 1970 • Gas containing microbubbles. • First generation Contrast Agents: Agitated saline with or without Indocyanine green.
Agitated Saline • Agitating a solution of saline between two 10 -m. L syringes • Each of which contains 5 m. L of saline and 0. 1 to 0. 5 m. L of room air • Forceful agitation through a three-way stopcock creates a population of microbubbles • ‘Dose’- 1 - 5 ml
Ideal contrast agent Non-toxic Intravenously injectable Has to behave similarly to blood Crosses pulmonary filter Resistant to intravascular and intra-cardiac pressures • Stable throughout during the exam • Improve the Doppler signal-to-noise ratio • • •
Recent microbubble formulations Name Size (µm) Shell composition Gas content indication AI-700 2. 9 SYNTHETIC POLYMER PERFLUORO CARBON Myocardial perfusion CARDIOspere 4. 0 POLYMER BILAYER NITROGEN Myocardial perfusion DEFINITY (USA) 1. 1 -3. 3 Lipid encapsulated PERFLUOROPRO PANE LV opacification OPTISON 7 (USA) 2. 0 -4. 5 DENATURED ALBUMIN PERFLUOROPRO PANE LV opacification SONOVUE (EUROPE, ASIA) 2. 5 PHOSPHOLIPIDS SULPHUR HEXAFLUORIDE Myocardial perfusion, LV opacification
• Low surface tension. • Resistant to ultrasound destruction. • Slowly diffusing, insoluble, high molecular weight gases. • 1. 1 – 8 µm size, 5 х10⁸ to 1. 2 x 10¹⁰ microbubbles per millilitre • Single injection provide contrast effect for 3 - 10 min. • Safe – 4 deaths after 2 million use • Contra indications – Known Rt to Lt shunts – Known hypersensitivity
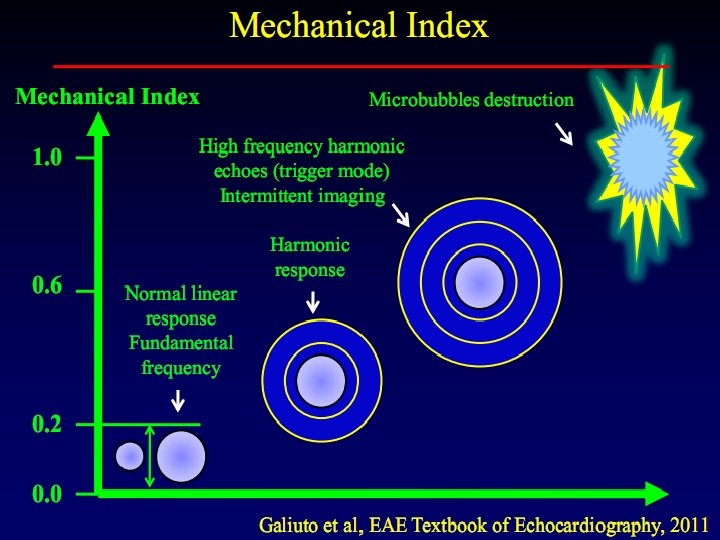
Ultrasound Interaction with Contrast Agent >0. 3 MI <0. 3 MI
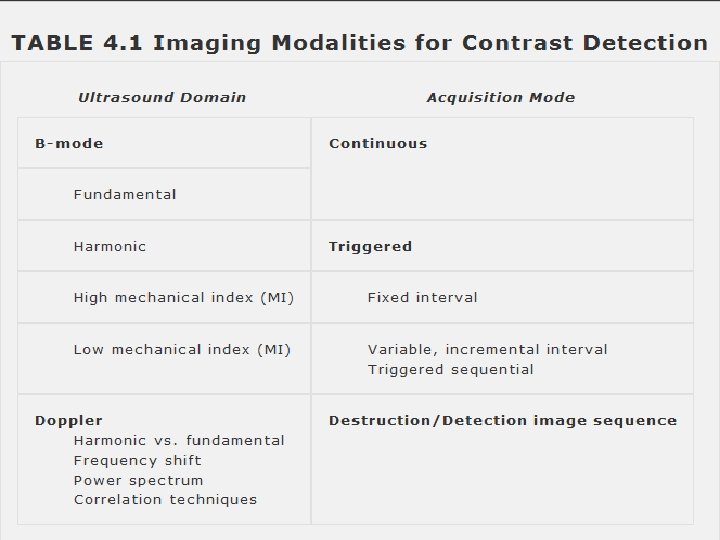
Machine settings • Dedicated contrast specific presets • Mechanical Index; Power of US beam Peak Negative acoustic pressure Transmitted Frequency Routine B mode uses – High MI - 0. 9 to 1. 4 Low MI < 0. 3
Contrast Destruction • High Mechanical Index • High Frame rate • Focal zone • Near field
Fundamental Harmonic
Continuous Imaging Low Mechanical Index High Mechanical Index
Intermittent imaging Continuous low MI imaging. • Triggered to ECG • Wall motion analysis in • In between imaging, no real time. ultrasound energy is delivered. • Used for cavity opacification. • Allows time for restitution • Detection of very low of contrast effect. concentration of • Analysis of wall motionmyocardial contrast. not possible. • Evaluation of myocardial perfusion.
Intermittent Triggered Imaging o. Intermittent Imaging
Power Spectrum Motion of the bubbles & their resonance in a stationary field
Clinical Applications
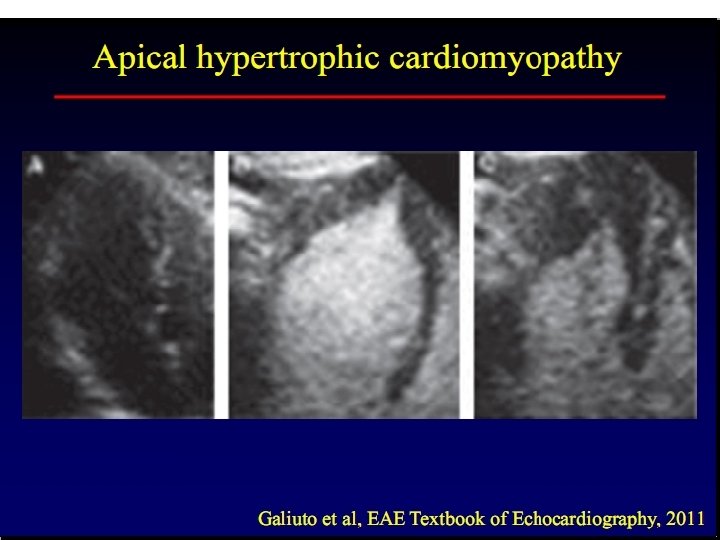
Detection and Utilization of Intracavitary contrast • Enhanced visualization of the LV endocardial borders • Improve reproducibility for wall motion analysis and volumetric measurements • Detection or exclusion of – Intracavitary thrombus – Ventricular noncompaction – Atypical forms of HCM (Apical) – Abnormal communication to the ventricular chamber
Exclusion of Thrombus
LV Thrombus
Ventricular noncompaction
Spectral Doppler Enhancement • Low concentrations of contrast agents • Enhancing the tricuspid regurgitation jet • Pulmonary vein flow • Increasing intensity of a relatively weak aortic stenosis jet
Shunt Detection • Right-to-left shunts - agitated saline - agent of choice – Atrial septal defects of all types – Patent foramen ovale - Valsalva and cough – Pulmonary arteriovenous malformations - 5 to 15 cycles – Larger ventricular septal defects during diastole – Left SVC • Left-to-right shunt – Negative contrast effect
Right-to-left shunt Negative contrast effect
Atrial septal aneurysm with PFO
Persistent Left SVC
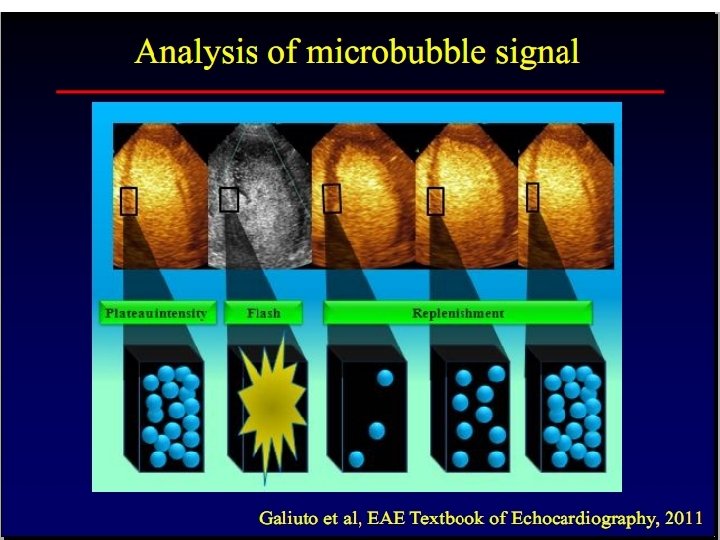
Myocardial Perfusion Contrast • First recognized in the 1980 s • Preserved contrast effect in the myocardium - evidence of microvascular integrity and blood flow to the area • Analysis of myocardial flow - Time of appearance curve • Multiple time appearance curve analyses - necessary • Time of appearance curve requires a bolus effect – wait 10 minutes – purposeful destruction of the contrast agent - burst of high intensity (high mechanical index) ultrasound • Targeted to different regions of interest • Performed under basal conditions & after vasodilator stress
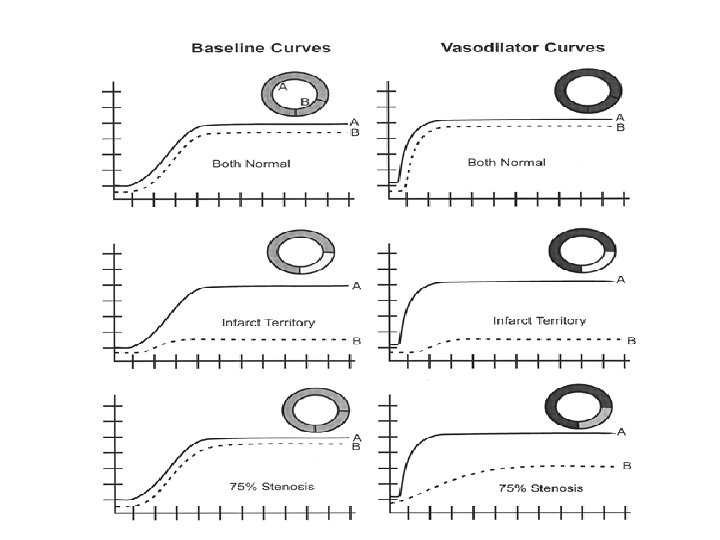
Time of appearance curve
• α is directly related to myocardial blood volume • β is related to flow rate • The product of α and β- proportional to myocardial blood flow • Vasodilator results in an increase in flow velocity in those areas not perfused by a stenosed artery • Appearance of the contrast curves - differ in the normal and diseased beds
Transcatheter alcohol septal ablation • Performed for the Rx of HOCM. • Catheter is placed in the 1 st septal perforator of LAD. • Controlled myocardial infarction for reduction of proximal septal mass. • Before alcohol injection, diluted US contrast agent is injected to the selected artery. • To ensure- no contrast reflux. • To confirm the presence and size of vascular bed.
Transcatheter alcohol septal ablation
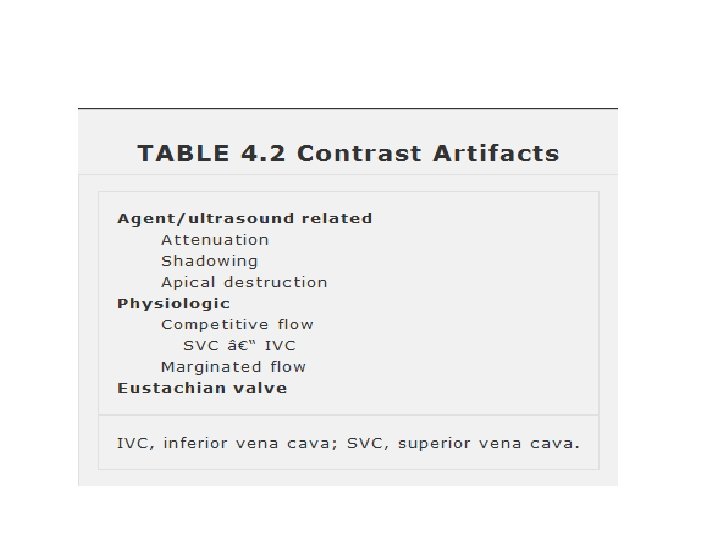
Attenuation & Shadowing
Papillary Muscle Shadow
Colour Artifact
Competitive Flow May be confused with a true negative contrast effect due to an atrial septal defect
Prominent eustachian valve and margination of contrast-enhanced blood flow May be confused with a true negative contrast effect due to an atrial septal defect
Strain Rate Imaging
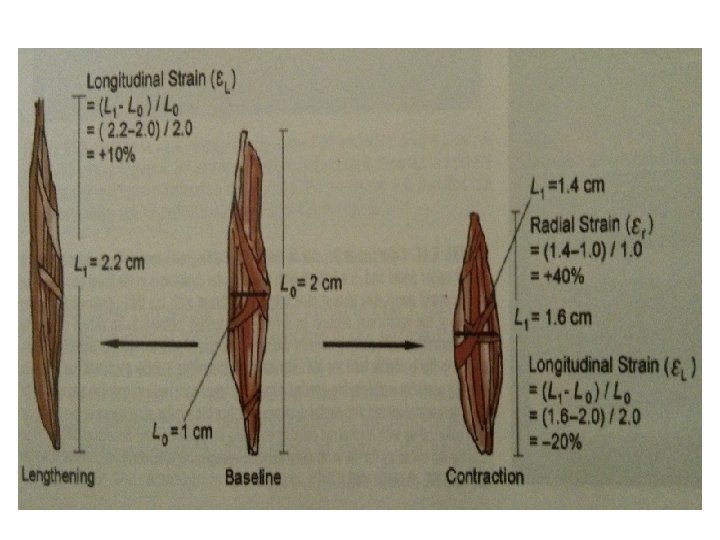
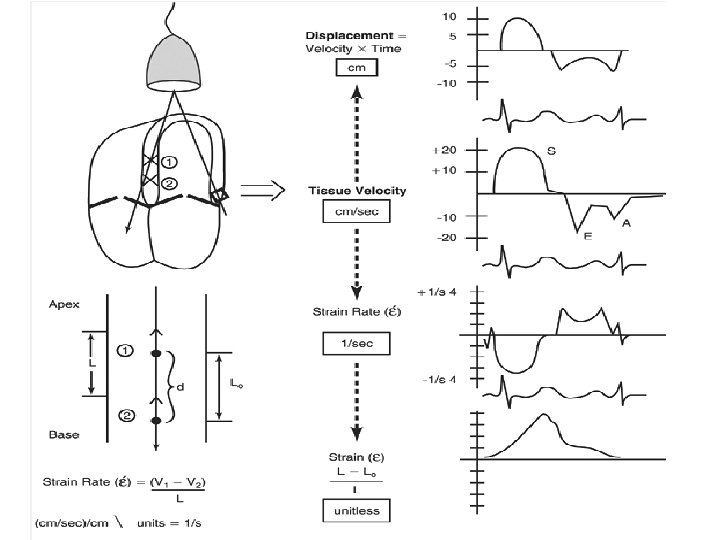
Introduction • Evaluation of a myocardial region with reference to an adjacent myocardial segment. • Deformation analysis- analysis of ventricular mechanics or shapes during cardiac cycle. • Myocardial strain, strain rate, torsion. • Strain- percentage thickening or deformation of the myocardium during the cardiac cycle. • Change of strain per unit of time is referred to as strain rate
Strain & Strain rate
• Strain calculated in three orthogonal planesrepresenting longitudinal, radial, circumferential contraction. • Negative strain- shortening of segment. • Positive strain- lengthening of segment
Methods Doppler tissue imaging • Two discrete points are compared for change in velocity • Strain rate- primary parameter obtained • Strain –derived by integrating velocity over time. Speckle tracking • Actual location of discrete myocardial segments calculated. • Strain is the primary parameter. • Strain rate-derived by calculating change in distance over time.
SR- Doppler tissue imaging
Speckle tracking • ‘Speckles’ are small dots or groups of myocardial pixels that are created by the interaction of ultrasonic beams and the myocardium. • Considered as acoustic fingerprint for that region. • This enables to judge the direction of movement, the speed of such movement, and the distance of such movement of any points in the myocardium.
Speckle
Method • Track the endocardial and epicardial borders of the left ventricle • Correctly define the region of interest (ROI) in the long or short axis view • Post-processing software automatically divides the ventricle into six equally distributed segments • 2 D or 3 D data set is produced • Mathematical algorithms are applied to generate values
• Strain is not uniform among all myocardial segments. • Radial strain-Magnitude of basal parameters are higher than the apical values. • Longitudinal strain- less variability fron apex to base. • Circumferential strain- higher in anterior and lateral walls compared to posterior and septal. • Normal longitudinal strain averages -20% • Normal radial strain about +40%
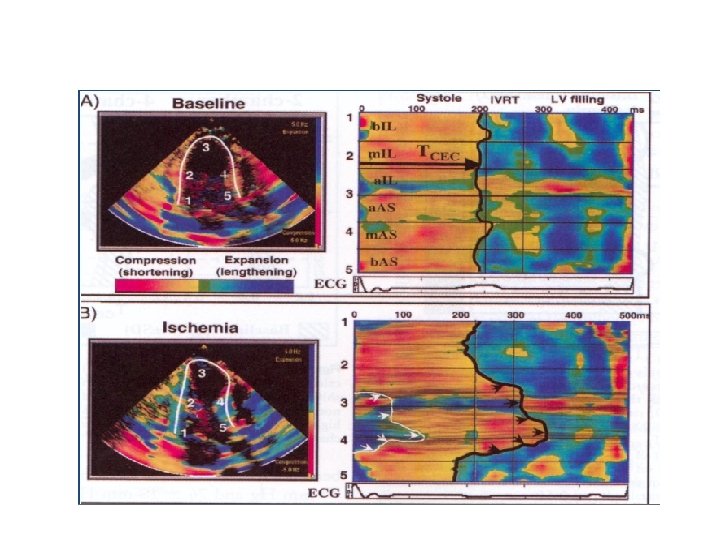
Normal Strain Displays Wave Forms , Curved M-mode
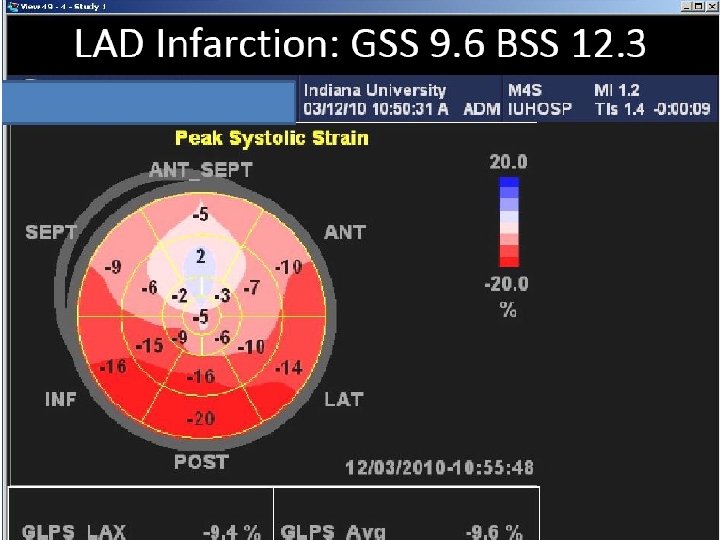
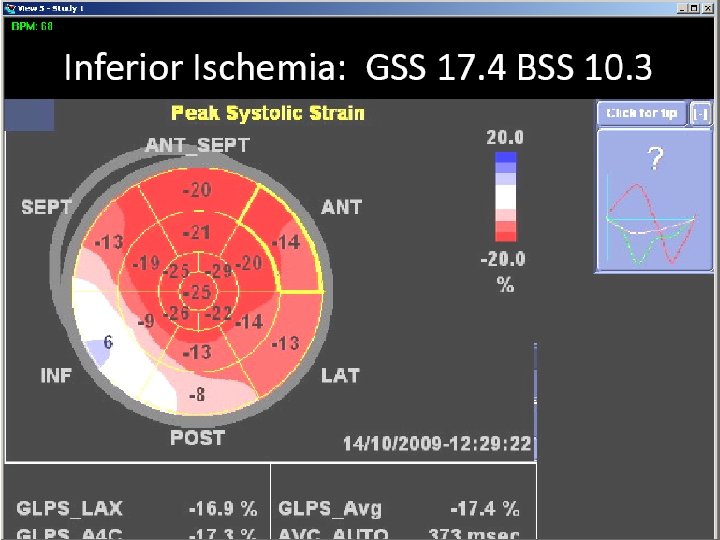
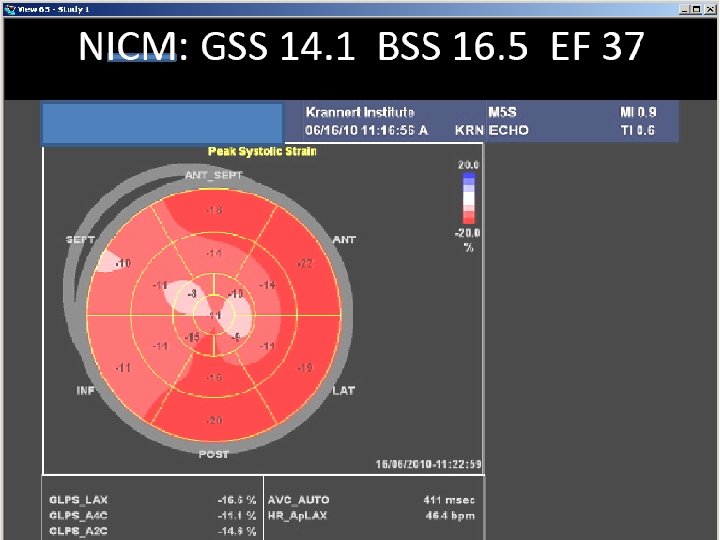
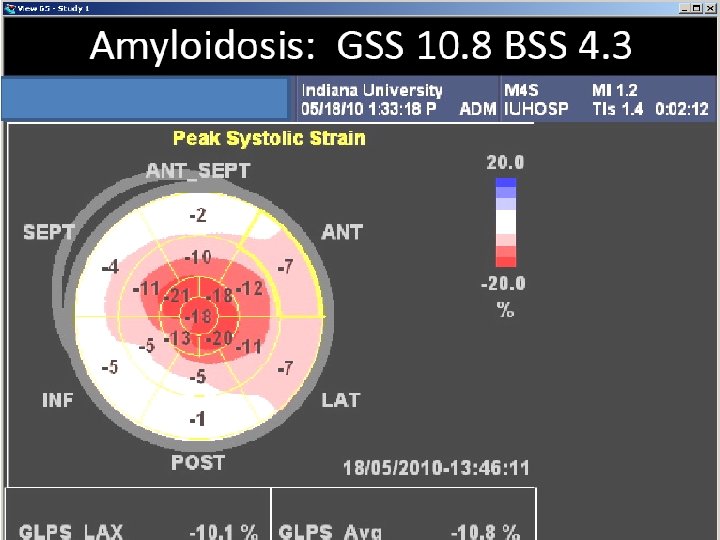
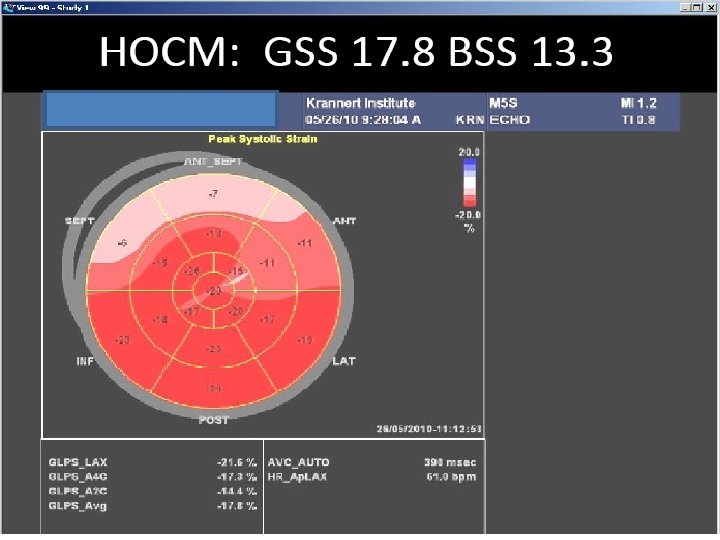
Normal Strain Displays- bulls eye presentation
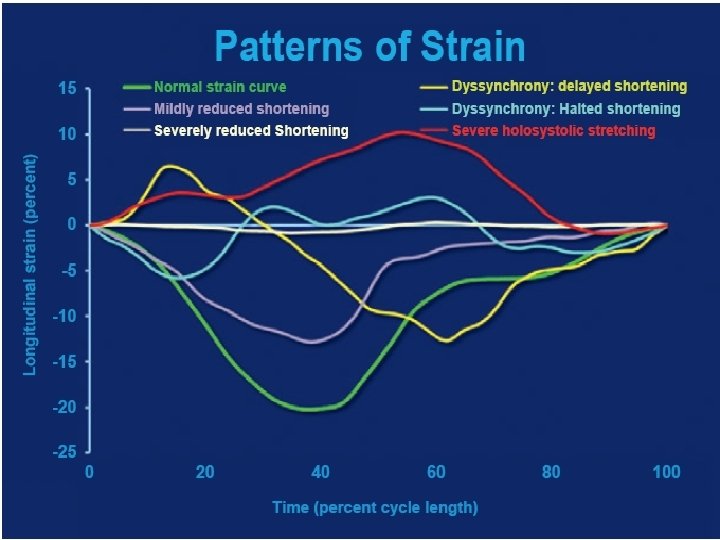
Normal pattern Dilated cardiomyopathy Dyssynchrony
Velocity vector imaging
VENTRICULAR TORSION • Similar to the winding and Unwinding of a towel. • Isovolumetric contraction the apex rotates clockwise • Ejection phase apex rotates counterclockwise & base rotates clockwise when viewed from the apex • Diastole - relaxation of myocardial fibres - recoiling clockwise apical rotation.
Myocardial mechanics
• Rotation - Measure of the rotational movement of the myocardium in relation to an imaginary long axis line from apex to base drawn through the middle of LV cavity. • Twist (degrees) is the net difference between apical and basal rotation • Torsion - Twist divided by the vertical distance between the apex and base and is expressed as degrees/cm.
VENTRICULAR TORSION
Applications • CAD- Myocardial ischemia, Myocardial infarction, Myocardial viability. • Heart failure with normal LVEF • Cardiac resynchronization therapy (CRT) • DCM • HCM. • Detection of subclinical diseases/early myocardial involvement
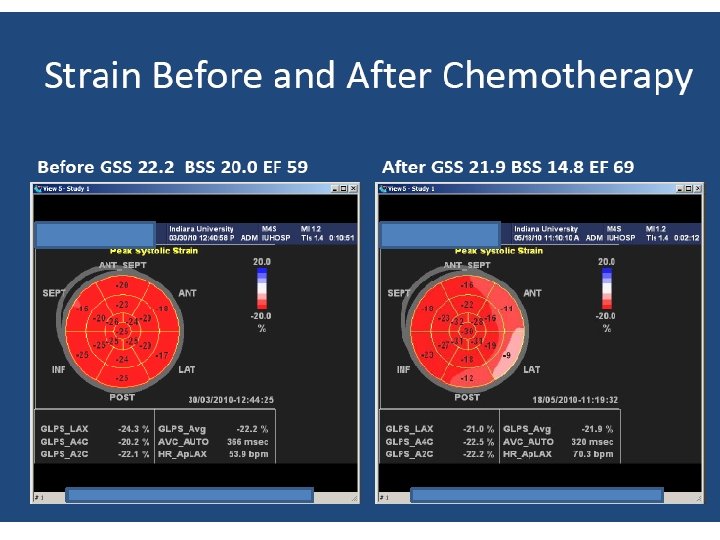
Applications • Stress cardiomyopathy • Restrictive cardiomyopathy • Detection of rejection and coronary stenosis in heart transplant patients. • Early detection of chemotherapy induced cardiotoxicity. • Valvular heart disease