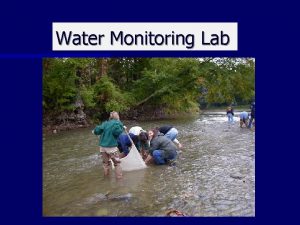
Continuous Water Quality Monitoring Continuous Water Quality Monitoring


- Slides: 11

Continuous Water. Quality Monitoring

Continuous Water Quality Monitoring Advantages n n n Needed in rapidly changing systems Provides better understanding of interaction between constituents Provides better understanding of transport processes Disadvantages n n n Equipment costs are greater Operation and maintenance costs are greater Vulnerable to damage and/or loss

Relations Between Parameters DO and p. H n n n DO and p. H track together Diurnal Pattern Why?

Relations Between Parameters DO and Temperature n n n Supersaturated DO DO crash in June Variation in DO changes seasonally

Relations Between Parameters Turbidity –vs- Discharge

Discrete vs Continuous Monitoring

Other Surrogate Possibilities n n n Continuous Parameter(s) Surrogate Constituent Specific Conductance TDS, Total Nitrogen Turbidity Suspended Sediment, Total Phosphorous Turbidity + Temperature Bacteria Relations are developed using discrete samples and linear regression Regression model used to synthesize continuous record of target parameters that are difficult to monitor. Parameter -vs- surrogate relations are not universal but site specific

Applications n Continuous monitoring the constituent or its surrogate to aid in identifying occurrence and duration of waterquality parameters that exceed regulatory limits.

Relation between SC and TN 1, 8 1, 6 1, 4 1, 2 Proposed Regulatory Limit = 1. 0 mg/L TN (mg/L) 1 0, 8 Difficult to monitor 0, 6 0, 4 ln(TN) Linear(ln(TN)) 0, 2 R 2 = 0, 902 0 0 -0, 2 -0, 4 100 200 300 Easy to monitor SC (u. S/cm) 400 500 600

Applications (cont) n n n Identify and optimize periods for sample collection Quantify constituent loads (volume/time) Familiarity with the site and data will lead to a better understanding of physical processes and interactions between constituents

QUESTIONS?
 Water and water and water water
 National water quality monitoring conference
 National water quality monitoring council
 Nwqmc
Nwqmc National water quality monitoring conference
 Continuous monitoring vs continuous auditing
 Continuous control monitoring
 Future
 Present simple present continuous past simple
 Quality monitoring scorecard
 Quality monitoring scorecard
 Data quality monitoring framework
