Continuous Probability Distributions Chapter 7 Copyright 2015 Mc

Continuous Probability Distributions Chapter 7 Copyright © 2015 Mc. Graw-Hill Education. All rights reserved. No reproduction or distribution without the prior written consent of Mc. Graw-Hill Education.

Learning Objectives LO 7 -1 Describe the uniform probability distribution and use it to calculate probabilities. n LO 7 -2 Describe the characteristics of a normal probability distribution. n LO 7 -3 Describe the standard normal probability distribution and use it to calculate probabilities. n LO 7 -4 Approximate the binomial probability distribution using the standard normal probability distribution to calculate probabilities. n LO 7 -5 Describe the exponential probability distribution and use it to calculate probabilities. n 7 -*

LO 7 -1 Describe the uniform probability distribution and use it to calculate probabilities. 均等分配 The Uniform Distribution 均等分配是最簡單的連續 隨機變數分配。 The uniform probability distribution is perhaps the simplest distribution for a continuous random variable. 此分配為方形分配,由最 大值與最小值定義其範圍, 此方形的面積= 1(亦即: 機率總和為 1) This distribution is rectangular in shape and is defined by minimum (a) and maximum (b) values. 7 -*
,也能根據此函數求得平 均數、變異數、標準差。")
LO 7 -1 The Uniform Distribution – Mean and Standard Deviation 在均等分配中,若知道最大值與最小值,我們就能定義均等 分配的機率函數(可據此求機率),也能根據此函數求得平 均數、變異數、標準差。 Knowing the minimum and maximum values of a uniform distribution, we can define the probability function, and calculate the mean, variance, and standard deviation of the distribution. 7 -*
 西南亞利桑納州立大學提供通勤公車,週一至週五從早上6點到晚上11點, 每半小時一班公車(由北主街到校園),學生等公車的時間從 0分至 30分")
LO 7 -1 The Uniform Distribution – Example (p. 208) 西南亞利桑納州立大學提供通勤公車,週一至週五從早上6點到晚上11點, 每半小時一班公車(由北主街到校園),學生等公車的時間從 0分至 30分 呈均等分配。 Southwest Arizona State University provides bus service to students. On weekdays, a bus arrives at the North Main Street and College Drive stop every 30 minutes between 6 a. m. and 11 p. m. Students arrive at the bus stop at random times. The time that a student waits is uniformly distributed from 0 to 30 minutes. 1. 請繪製此分配的圖形 2. 請說明其總面積為 1 3. 學生等公車「一般」要等多久?換句話說,平均等候時間為?等候時 間的標準差為? 4. 學生等公車超過25分鐘的機率? 5. 學生等公車介於 10到 20分鐘的機率? 1. Draw a graph of this distribution. 2. Show that the area of this uniform distribution is 1. 00. 3. How long will a student “typically” have to wait for a bus? In other words what is the mean waiting time? What is the standard deviation of the waiting times? 4. What is the probability a student will wait more than 25 minutes? 5. What is the probability a student will wait between 10 and 20 minutes? 7 -*
 1. Graph of uniformly")
LO 7 -1 The Uniform Distribution – Example (p. 209) 1. Graph of uniformly distributed waiting times between 0 and 30: P(X)= 1/(30 -0) = 0. 0333 7 -*
 2. Show that the")
LO 7 -1 The Uniform Distribution – Example (p. 209) 2. Show that the area of this distribution is 1. 00. 7 -*
 3. How long will")
LO 7 -1 The Uniform Distribution – Example (p. 209) 3. How long will a student “typically” have to wait for a bus? In other words what is the mean waiting time? What is the standard deviation of the waiting times? 7 -*
 4. What is the probability a")
The Uniform Distribution – Example (p. 209 -210) 4. What is the probability a student will wait more than 25 minutes? 計算介於 25到 30間的面積=等候時間大於 25分 鐘的機率 7 -* LO 7 -1
 5. What is the probability a student")
The Uniform Distribution – Example (p. 210) 5. What is the probability a student will wait between 10 and 20 minutes? 計算介於 10到 20分鐘之間的面積=其機率 7 -* LO 7 -1
 (a) a=8, b=14 縱軸截距 (機率): 1/(b-a)=1/(14 -8)=0. 167 (b)")
Self-review 7 -1 (p. 210) (a) a=8, b=14 縱軸截距 (機率): 1/(b-a)=1/(14 -8)=0. 167 (b) [1/(14 -8)]*(14 -8)=1 (c) mean=(a+b)/2=(14+8)/2=11 s. d. = √(14 -8)2/12= 1. 732 (d) P(10<X<14)= [1/(14 -8)]*(14 -10)=0. 667 (e) P(X<9)= [1/(14 -8)]*(9 -a)=0. 167*(9 -8)=0. 167 (f) P(X=9)=0. 167*(9 -9)=0
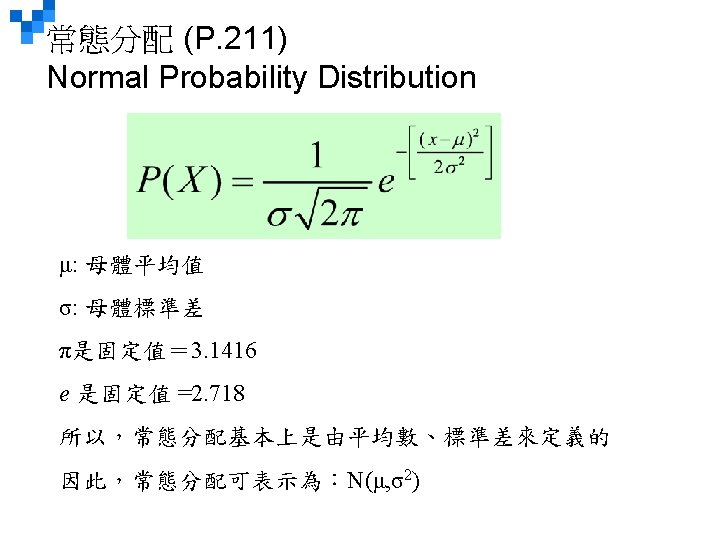

LO 7 -2 Describe the characteristics of a normal probability distribution. Characteristics of a Normal Probability Distribution § § § § It is bell-shaped and has a single peak at the center of the distribution. It is symmetrical about the mean. It is asymptotic: The curve gets closer and closer to the X-axis but never actually touches it. To put it another way, the tails of the curve extend indefinitely in both directions. The location of a normal distribution is determined by the mean, . The dispersion or spread of the distribution is determined by the standard deviation, σ. The arithmetic mean, median, and mode are equal. As a probability distribution, the total area under the curve is defined to be 1. 00. 因為對稱,平均值兩邊的機率值都是 0. 5 Because the distribution is symmetrical about the mean, half the area under the normal curve is to the right of the mean, and the other half to the left of it. 7 -*

LO 7 -2 The Normal Distribution – Graphically 7 -*

LO 7 -2 The Family of Normal Distributions Equal Means and Different Standard Deviations Different Means and Equal Standard Deviations 7 -*

LO 7 -3 Describe the standard normal probability distribution and use it to calculate probabilities. 標準常態分配 The Standard Normal Probability Distribution n n The standard normal distribution is a normal distribution with a mean of 0 and a standard deviation of 1. 亦即:N(1, 0) It is also called the z distribution. A z-value is the signed distance between a selected value, designated x, and the population mean, , divided by the population standard deviation, σ. The formula is: 7 -*
 玻璃產業的領班週薪呈現常 態分配,平均值為$1000, 標準差為$100。 The")
LO 7 -3 The Normal Distribution – Example (p. 215) 玻璃產業的領班週薪呈現常 態分配,平均值為$1000, 標準差為$100。 The weekly incomes of shift foremen in the glass industry follow the normal probability distribution with a mean of $1, 000 and a standard deviation of $100. 若某領班的週薪為$1100, 請問其薪資的z值為何?若 另一領班的週薪為$900, 其z值為何? What is the z value for the income, let’s call it x, of a foreman who earns $1, 100 per week? For a foreman who earns $900 per week? 7 -*

LO 7 -3 使用機率表:查第 732頁的常態分配表 Areas Under the Normal Curve Using a Standard Normal Table 7 -*
查第 732頁的常態分配表 The Empirical Rule – Verification n For z=1. 00,")
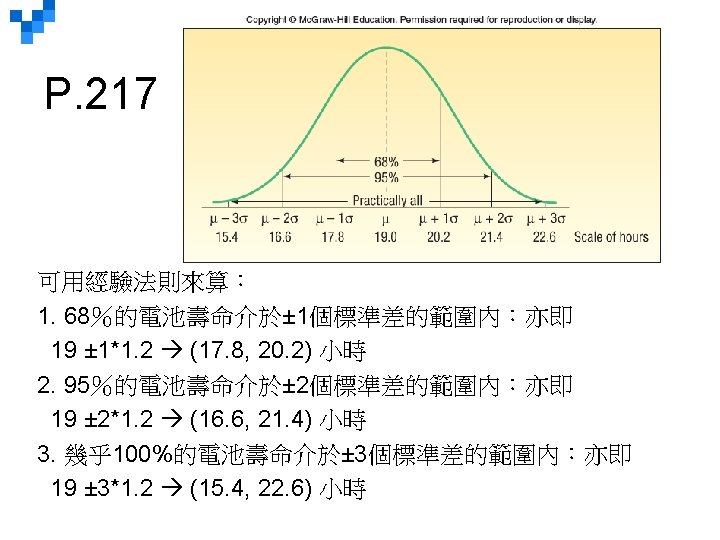
LO 7 -3 經驗法則(再測試)查第 732頁的常態分配表 The Empirical Rule – Verification n For z=1. 00, the table’s value is 0. 3413; times 2 is 0. 6826. For z=2. 00, the table’s value is 0. 4772; times 2 is 0. 9544. For z=3. 00, the table’s value is 0. 4987; times 2 is 0. 9974. 7 -*
 p. 215, p. 218")
LO 7 -3 Normal Distribution – Finding Probabilities (Example 1) p. 215, p. 218 前例中領班週薪呈現平均 值$1, 000,標準差$100 的常態分配。 In an earlier example we reported that the mean weekly income of a shift foreman in the glass industry is normally distributed with a mean of $1, 000 and a standard deviation of $100. 請問隨便選個領班,他的 週 薪 介 於 $1000到 $1100 之間的概率(機率)為何 ? What is the likelihood of selecting a foreman whose weekly income is between $1, 000 and $1, 100? 7 -*
 7 -*")
LO 7 -3 Normal Distribution – Finding Probabilities (Example 1) 7 -*

LO 7 -3 Finding Areas for z Using Excel p. 219 The Excel function: =NORM. DIST(x, Mean, Standard_dev, Cumu) =NORM. DIST(1100, true) calculates the probability (area) for z=1. 7 -*
 p. 220 再續前例 Refer")
LO 7 -3 Normal Distribution – Finding Probabilities (Example 2) p. 220 再續前例 Refer to the information regarding the weekly income of shift foremen in the glass industry. The distribution of weekly incomes follows the normal probability distribution with a mean of $1, 000 and a standard deviation of $100. 隨便選個領班,他的週薪介 於 $790到 $1000之 間 的 機 率 為何? What is the probability of selecting a shift foreman in the glass industry whose income is between $790 and $1, 000? 那麼剛剛選出的這個領班的 週 薪 低 於 $ 790的 機 率 為 何 ? 7 -*
 p. 220 續前例 Refer")
LO 7 -3 Normal Distribution – Finding Probabilities (Example 3) p. 220 續前例 Refer to the information regarding the weekly income of shift foremen in the glass industry. The distribution of weekly incomes follows the normal probability distribution with a mean of $1, 000 and a standard deviation of $100. 剛剛抽出的領班,週薪低於 $790的機率為何? What is the probability of selecting a shift foreman in the glass industry whose income is less than $790? The probability of selecting a shift foreman with income less than $790 is 0. 5 -. 4821 =. 0179. 7 -*
 p. 221 續前例 Refer")
LO 7 -3 Normal Distribution – Finding Probabilities (Example 4) p. 221 續前例 Refer to the information regarding the weekly income of shift foremen in the glass industry. The distribution of weekly incomes follows the normal probability distribution with a mean of $1, 000 and a standard deviation of $100. 剛剛抽出的領班,週薪介於 $840到 $ 1, 200的 機 率 為 何 ? What is the probability of selecting a shift foreman in the glass industry whose income is between $840 and $1, 200? 7 -*
 p. 222 續前例 Refer")
LO 7 -3 Normal Distribution – Finding Probabilities (Example 5) p. 222 續前例 Refer to the information regarding the weekly income of shift foremen in the glass industry. The distribution of weekly incomes follows the normal probability distribution with a mean of $1, 000 and a standard deviation of $100. 剛剛抽出的領班,週薪介於 $1, 150到 $ 1, 250的 機 率 為 何? What is the probability of selecting a shift foreman in the glass industry whose income is between $1, 150 and $1, 250? 7 -*

LO 7 -3 Using Z to Find X for a Given Probability – Example p. 224 Layton 輪胎、橡皮公司想要對新胎 MX 100訂出最低保證的里程數,經 測試後,平均里程數為 67900英里, 標準差為 2050英里,且里程數服從 常態分配。他們希望定下最低保證 里程數後,換胎比例不超過4% 請問他們該定最低保證多少英里? Layton Tire and Rubber Company wishes to set a minimum mileage guarantee on its new MX 100 tire. Tests reveal the mean mileage is 67, 900 with a standard deviation of 2, 050 miles and that the distribution of miles follows the normal probability distribution. Layton wants to set the minimum guaranteed mileage so that no more than 4 percent of the tires will have to be replaced. What minimum guaranteed mileage should Layton announce? 7 -*
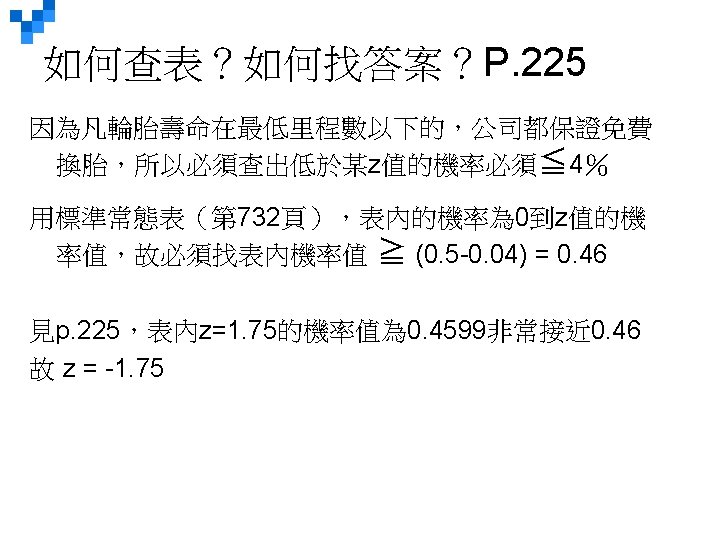

LO 7 -3 Using Z to Find X for a Given Probability – Example p. 225 7 -*

LO 7 -3 Using Z to Find X for a Given Probability – Example p. 225 7 -*
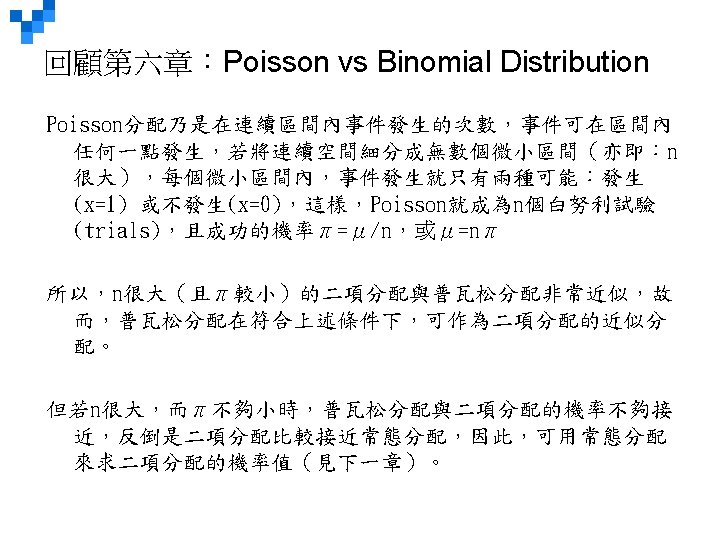
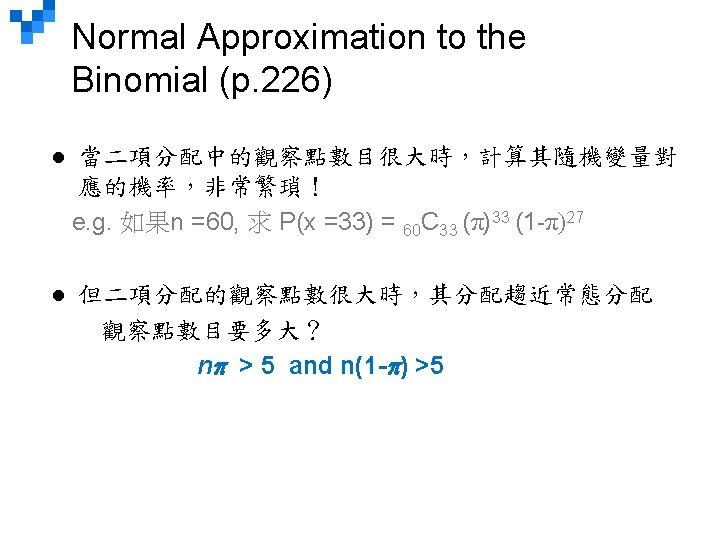

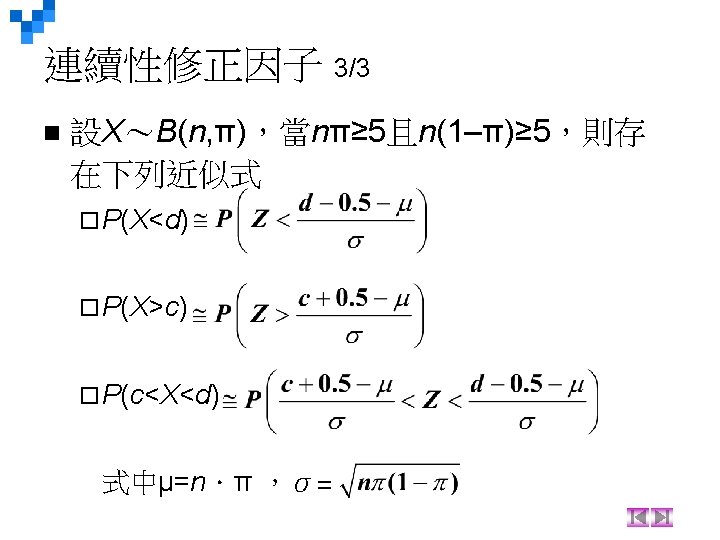
LO 7 -4 Approximate the binomial probability distribution using the standard normal probability distribution to calculate probabilities. Normal Approximation to the Binomial § The normal distribution (a continuous distribution) yields a good approximation of the binomial distribution (a discrete distribution) for large values of n. § The normal probability distribution is generally a good approximation to the binomial probability distribution when nπ and n(1 -π ) are both greater than 5. 7 -*

LO 7 -4 Normal Approximation to the Binomial Using the normal distribution (a continuous distribution) as a substitute for a binomial distribution (a discrete distribution) for large values of n seems reasonable because, as n increases, a binomial distribution gets closer and closer to a normal distribution. 7 -*
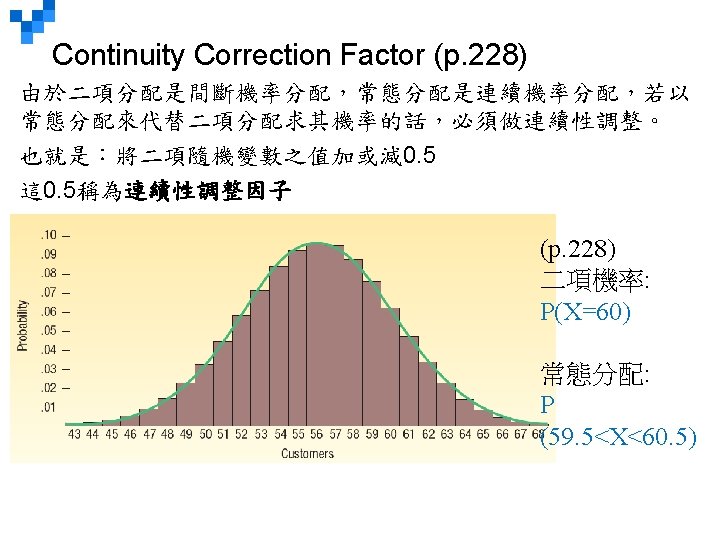

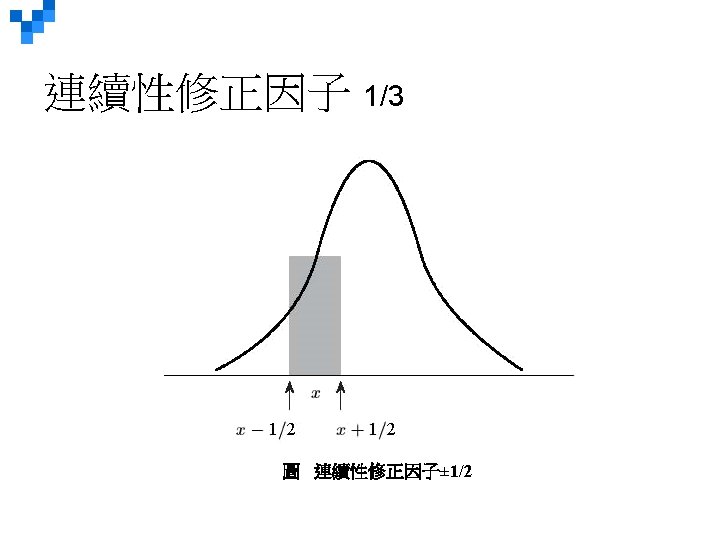
LO 7 -4 Continuity Correction Factor The value. 5 is subtracted or added, depending on the problem, to a selected value when a binomial probability distribution (a discrete probability distribution) is being approximated by a continuous probability distribution (the normal distribution). 7 -*

LO 7 -4 How to Apply the Correction Factor Only one of four cases may arise: 1. For the probability at least X occurs, use the area above (X -0. 5). 2. For the probability that more than X occurs, use the area above (X+0. 5). 3. For the probability that X or fewer occurs, use the area below (X 0. 5). 4. For the probability that fewer than X occurs, use the area below (X+0. 5). 7 -*


LO 7 -4 Normal Approximation to the Binomial – Example p. 227 -229 若Santoni披薩餐廳發現 70% 的新顧客會再回來光顧,某週 有80位新顧客光臨,其中 60位 或以上的顧客會再度光臨的機 率為何? Suppose the management of the Santoni Pizza Restaurant found that 70 percent of its new customers return for another meal. For a week in which 80 new (first-time) customers dined at Santoni’s, what is the probability that 60 or more will return for another meal? 7 -*
p. 228 If we")
LO 7 -4 Normal Approximation to the Binomial – Example (查二項分配表)p. 228 If we use the binomial probabilities, we would compute: P(X ≥ 60) = 0. 063+0. 048+ … + 0. 001) = 0. 197 7 -*
p. 229 Step 1.")
LO 7 -4 Normal Approximation to the Binomial – Example (用常態分配算機率)p. 229 Step 1. Find the mean and the variance of a binomial distribution and find the z corresponding to an x of 59. 5 (x - 0. 5, the correction factor). Step 2: Determine the area from 59. 5 and beyond. 7 -*

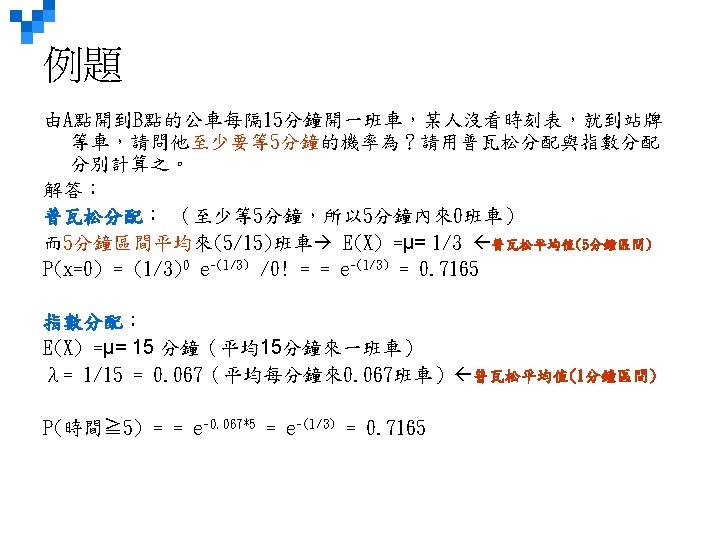
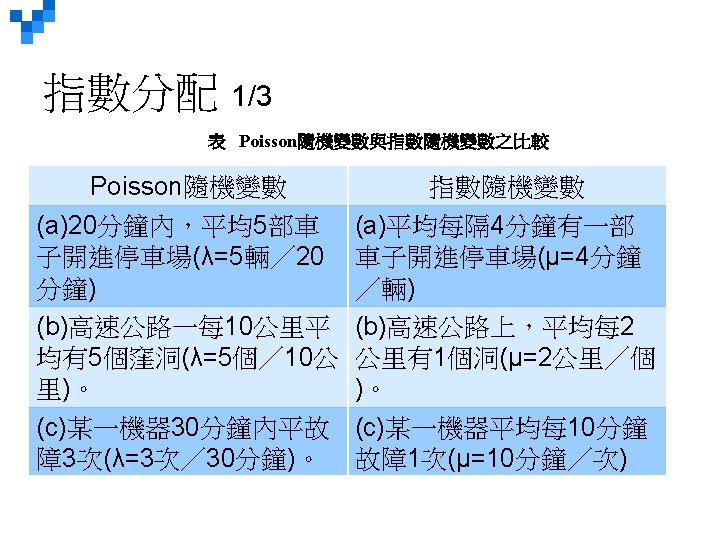
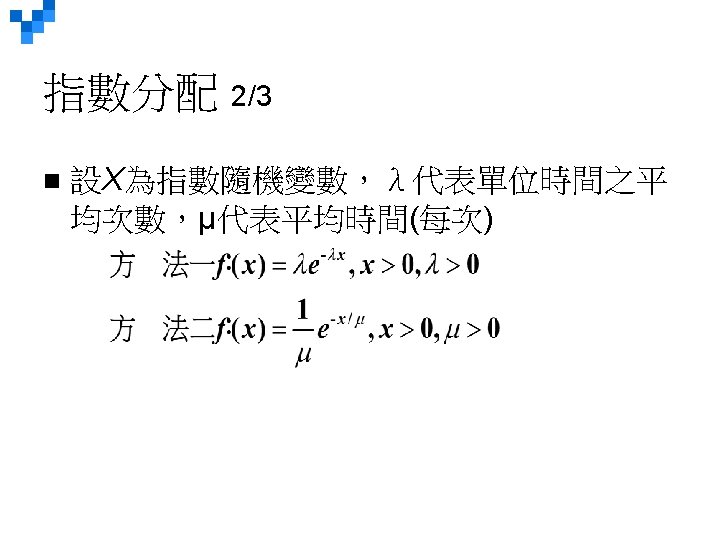
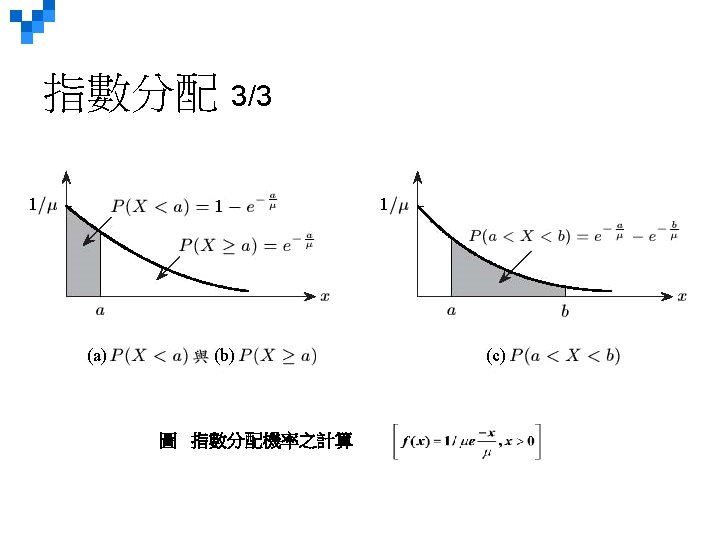
LO 7 -5 Describe the characteristics and compute probabilities using the exponential distribution. 指數分配 The Family of Exponential Distributions p. 231 Characteristics and uses: §正偏,類似普瓦松分配 Positively skewed, similar to the distribution (for discrete variables) Poisson §Not symmetric like the uniform and normal distributions §僅用一個參數定義,λ:平均發 生頻率(次數…) Described by only one parameter, which we identify as λ, often referred to as the “rate” of occurrence parameter §當λ遞減,分配則越來越不偏 As λ decreases, the shape of the distribution becomes “less skewed. ” The exponential distribution usually describes inter-arrival situations such as: • The service times in a system • The time between “hits” on a web site • The lifetime of an electrical component • The time until the next phone call arrives in a customer service center 7 -*

LO 7 -5 Exponential Distribution – Example p. 232 -233 某網路藥局的下單頻率服從指數分配, 平均每 20秒鐘接一個藥單。 Orders for prescriptions arrive at a pharmacy management website according to an exponential probability distribution at a mean of one every twenty seconds. 請問:下一個藥單 1) 不到 5秒內可接到的機率是? 2) 超過40秒才接到的機率是? 3) 介於 5到 40秒接到的機率是? Find the probability the next order arrives in: 1) less than 5 seconds, 2) more than 40 seconds, 3) or between 5 and 40 seconds. 7 -*
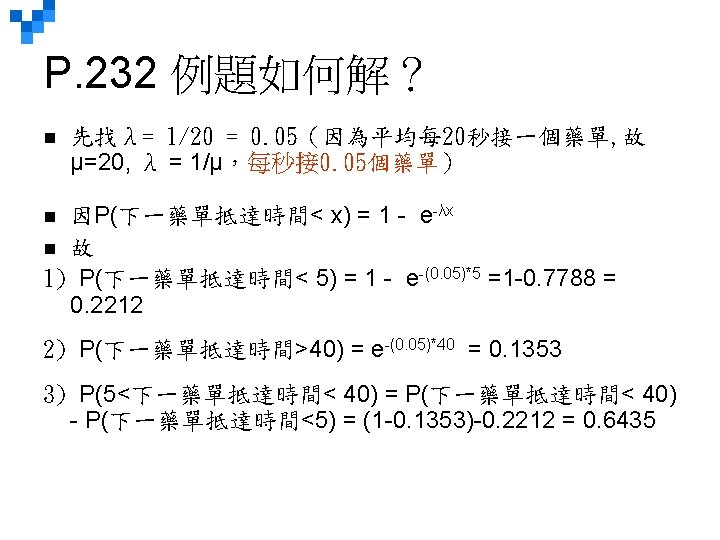

LO 7 -5 Exponential Distribution – Example p. 232 -233 7 -*

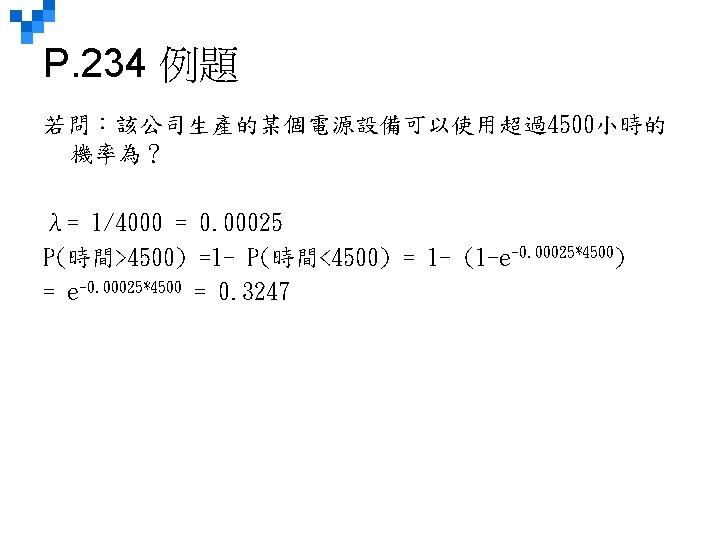
Exponential Distribution – Example p. 234 Compton電腦公司希望訂定該公司新電 源設備的保證最低使用年限,品保測 試發現設備使用壽命服從指數分配, 平均可用 4000小時,注意: 4000小時 為 平 均 值 , 而 非 頻 率 , 因 此 , λ= 1/4000= 0. 00025(每小時的耗損率) Compton Computers wishes to set a minimum lifetime guarantee on its new power supply unit. Quality testing shows the time to failure follows an exponential distribution with a mean of 4000 hours. Note that 4000 hours is a mean and not a rate. Therefore, we must compute λ as 1/4000 or 0. 00025 failures per hour. 該公司希望在保固期內僅5%電源設備 耗損,他們該訂定多長的保固期? Compton wants a warranty period such that only five percent of the power supply units fail during that period. What value should they set for the warranty period? 7 -* LO 7 -5
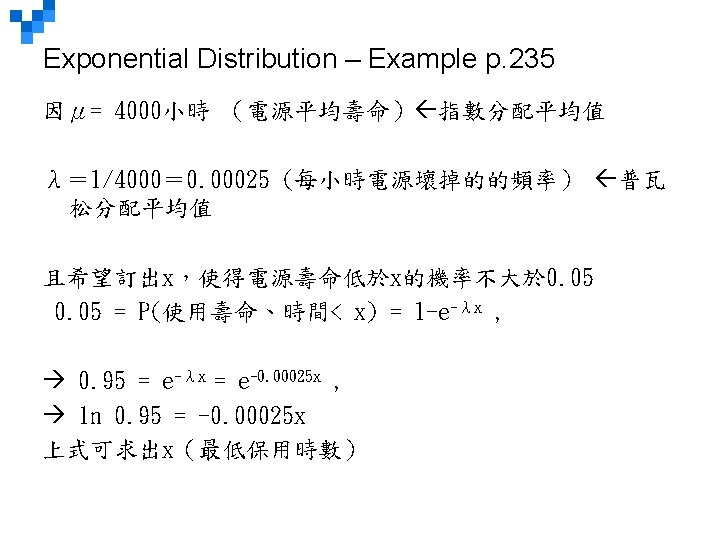

LO 7 -5 Exponential Distribution – Example p. 235 In this problem, we need to find the value of x or the average inter-arrival time so that the probability of a returned unit is 5%. 7 -*
- Slides: 66