Contextual Data Visualization with Microsoft Office Visio Professional


- Slides: 40
Contextual Data Visualization with Microsoft® Office Visio® Professional 2007 K S Srikanth Visio Solution Specialist | Microsoft India
Agenda Introduction to Office Visio 2007 Professional. BI story for IT Pros. How Visio can help? Connectors demos Network Management Demo Ops Manager & Config Manager SQL assessment Disk Space storage management Rack Server Virtualization Exchange Server Vehicle being delivered- New Visio. Toolbox website
Polling and Level-Check Experience level with Visio. . Version of Visio being used. What type of diagrams do you work with? Help me target content appropriately…
Introduction to Visio 2007 Microsoft Office Visio 2007 is the diagramming and information visualization tool of choice for business and technical professionals. 10 mm+ users; 4 mm+ IT Professionals Unrivalled breadth of diagram types Beyond diagramming: 300+ solution partners, 50+ IT solution partners. Highly satisfied users - 90% satisfaction rate; 87% would recommend it to others. * Extensive solutions usage: 75% of users utilizing data visualization solutions. * Info. World’s “Top 10 tools of the trade” for IT professionals Leader in the Gartner Business Process Analysis MQ
Visio - Data Visualisation Tool Microsoft Office Visio 2007 is the diagramming and information visualization tool of choice for business and technical professionals. Diagramming Communication Data Visualization • Visio 2007 helps you create business and technical diagrams that document and organize complex ideas, processes, and systems. • Diagrams created in Visio 2007 enable you to visualize and communicate information clearly, concisely, and effectively in ways that text and numbers cannot. • Visio Professional 2007 automates data visualization by synchronizing directly with data sources to provide up-to-date diagrams.
Visio 2007 - no longer just a drawing tool Data Visualization transforms diagrams into a graphical front- end for LOB application data Tabulated Representation Graphical Representation Recourse Availability Report Value Stream Map
Data Visualization 3 Data Refresh feature provides manual or automatic data refreshing and update Data Graphic Data Refresh Data Display Data Linking 1 2 Data Graphic provides four types of visual effect to display underlined data Data Selector allows importing various kind of data source into External Data window Excel , Access , SQL , Share. Point Lists, Other DB…
Visual Communication Scenarios
Who uses Visio? Everyone! IT Pros and Managers Network, Telco, Rack, Flowchart, Process, Website, Database, UML, Project Management Timelines and Charts Audit and Compliance SOX, FDA, Lean, Six Sigma, ISO, HIPAA, ITIL Business Process owners Business Process Management & Automation (BPM/BPA) Business Users Org Charts, Flowchart, Brainstorming, Swimlane, Scorecards, M&A Engineering Mechanical, Chemical, Software, Architectural, Electrical Facilities Office & Buildings, Landscape, HVAC, Network & Telco, Electrical And more….
Visio Solution Scenarios Solution Network & IT Management Business Process Management Compliance Business Pain A lot of IT diagramming is required for system design, development and operation. Monitoring, understanding and updating information of IT assets and security conditions is difficult. Describing and visualizing business process requires a lot of effort and documentation. Visio’s Offer Visio provides templates and stencils for Network and Rack Diagrams, DFD and WFD, DB, UML, Project Schedule, ITIL and more. With Visio it is easy to combine logical and physical information of IT system with the most updated IT asset and security information from diverse data sources and visualize it directly on the diagrams. Visio provides templates and stencils Flow Charts, Work Flow Diagrams, Swim Lane Diagrams, EPC, Fault Tree Anlaysis, Data Flow Diagram, Value Stream mapping and more. Once documented it is still difficult to identify the issues and bottlenecks of business processes. With Visio it is easy to document and design corporate business process and import and visualize process information from Excel, SQL, or other DBs in order to identify issues and bottlenecks in other business process initiatives. Describing and visualizing business process requires a lot of effort and documentation. Visio provides templates and stencils for Flow Charts, Work Flow Diagrams, Swim Lane Diagrams, Audit Diagrams and more. Understanding and identifying the risks and controls in business process is difficult. With Visio it is easy to document business process and visually represent risks and controls from backend systems or other DBs for compliance.
Visio Solution Scenarios Solution Quality Management Information reporting & data visualization Sales Force Automation Business Pain Visio’s Offer Describing and visualizing business process requires a lot of effort and documentation. Visio provides templates and stencils for Flow Charts, Work Flow Diagrams, Swim Lane Diagrams, EPC Diagrams, Fault Tree Analysis, Data Flow, TQM, Cause and Effect, ITIL, Value Stream Mapping and more. Understanding issues and improvement areas of processes and identifying of bottlenecks requires a lot of data mining and analysis. It is difficult to consume and communicate massive and dispersed corporate information across organization. Sales forces need to access many LOB systems to effectively complete their sales activities. Often, the sales forces feels it spends to much time in the sales process Interfacing with IT Systems. With Visio it is easy to access and visually show key quality and process control information from databases directly into process diagrams to identify and define issues from the massive amount of production data. Visio provides sophisticated graphic engine to visualize complex corporate information for people to identify issues quickly. With Visio and Office System / Windows Server System integration automatically create diagrams that allow people to gain rapid insight and understanding from complex corporate information and then share it easily. Visio shapes and stencils can link directly to LOB systems (quotation, inventory, procurement, logistics, order entry systems, etc. , ). With Visio as the graphical front-end its easy to improve the sales processes of creating better business proposals, issuing quotes and purchase orders, creating shipping instruction, etc. as well as simplifying sales data entry, customer communication and sales forecast and analysis all from a single smart, connected diagram.
Visio 2007 for IT Professionals Visualize: Document / Design / Deploy / Manage Quickly implement new services and moves/add/changes Logical, Physical, Rack, Process, Asset diagrams and more Resolve problems quickly with accurate documentation Visualize security issues on network diagrams Visio Toolbox Web site for more tools and best practices New Communicate: Share / Act / Collaborate / Educate New Share, review, publish critical information throughout enterprise Enhanced Share. Point® collaboration; view Visio in Outlook email Explore: Analyze / Identify / Anticipate New Manage, maintain, display, and clarify complex information ITIL, Data Graphics, Data Linking, Auto. Connect, Color Themes Multiple data views and drill-downs with Pivot Diagrams
New Features and Templates Office Visio Professional 2007 ITIL diagrams Yes Pivot. Diagrams Yes Sample diagrams Yes Logical network diagrams Yes Network rack diagrams Yes Value stream maps Yes Engineering diagrams—electrical, chemical, and more Yes Directory services diagrams Yes Key Feature! Data-driven solution support (including datarelated APIs) Yes Key Feature! Data Graphics functionality Yes Key Feature! Data Link functionality Yes Key Feature! Project Visio Reports Yes
Problem Scenarios with IT Pro's. . Issue: Network documentation is unstructured Wiring and cabling lists in spreadsheets Equipment specifications in text documents Diagrams consist of simple lines and text Documents often contain conflicting and inconsistent information Many drawings are dense and unclear
Contd. . Issue: Multiple interfaces to management systems Alarms Security status Deployed applications Hardware inventory Diagnostic scans and reports Network identities and relationships
Unstructured Information Technical staff may have thousands of documents to refer to with no linkage between them Visio Word Excel Power. Point HTML PDF Other…
Use Visio 2007 Professional to: Use Visio 2007 Professional to View network diagrams Connections between devices WANs, LANs, sub-nets Intranet and extranet Data centers Occupied building layouts Capacity Planning, Data Center Management , Network Trouble Shooting, Project Planning, Wireless Access Points, Compliance etc. Much more. . View enterprise network management system status MOM (Microsoft Operations Manager) SMS (System Management Server) AD (Active Directory) ISA (Internet Security and Acceleration Server)
Improvise Visual Information Access MBSA AD SMS MOM ISA OPERATIONS MANAGER Visio 2007 Professional provides a single visual viewpoint for critical operational information
Polling and Level-Check Which of these templates are relevant to you. . Which is the Industry you represent. .
DEMO Network Planning Demo. Build the network diagram using Visio 2007 stencils and shapes. 2. Import network data into Visio 2007. 3. Link and use Automatically Link Feature. 4. Define Data graphic edit functionality. 1.
Show Me! Network Diagram & Data Link
DEMO System Center Configuration Manager Add-in 1. 2. 3. 4. Open Visio Professional 2007 Connection to SCOM , SCCM Server Auto-generation of diagram Patch-Update information using Data. Graphic edit functionality.
Show Me! See alerts , patches and computer information from Operations Manager in Visio 2007 using this simple and free add-in that highlights the new data linking and data graphics functionality.
DEMO Visio Add-In for SQL Server Assessment
Show Me! Visualize your SQL server infrastructure topology in easy to understand Visio 2007 Diagrams with this simple and free add-in that highlights the new data linking and data graphics functionality. Share diagrams with IT for flawless server set up. Check to see if you can upgrade your servers to the latest version of SQL and which version.
DEMO Visio Add-In for Disk Space Monitoring
Show Me! See storage information in Visio 2007 using this simple and free add-in that highlights the new data linking and data graphics functionality. Auto- generate diagrams for your existing infrastructure using Excel or Operations manager. Monitor storage levels using WMI or Operations manager.
DEMO Visio Add-In for Server Virtualization
Show Me! – Server Virtualisation IT /Data center Admin IT/ Data center Manager Visio 2007 delivers • Wants to quickly and easily analyze which of the racks in a Co location can be virtualized based on usage levels • Pain Points- There are no planning tools readily available for Virtualization. It is a known fact that 70% of the racks are underutilized • Wants the ability to see high level status of Data center utilization. Wants the ability to be able to plan better , quicker faster. wants to dumb down the technical info and optimize his infrastructure usage and yet have the same impact and wants the ability share those plans which with senior management for quick approval. • IT manager knows that 705 of his infrastructure is under utilized and wants the ability to optimally be able to use the existing infrastructure. • IT Admin • Detailed information from existing systems can be used to auto-generate Visio diagrams of racks in a co-location. Data regarding the racks is pulled in using WMI or Ops manager as the data source. The virtualization solution then enables you to click on a button to see what can be virtualized and auto generates the to be rack state • IT Manager • The Visio Virtualization solution provides easy dashboards for the IT manager to be able to show much they saved using virtualization solutions as well as how optimally the racks be being utilized.
DEMO Visio Add-In for Exchange Server
Administrator Challenges Exchange management console does not provide a graphical view of user mailbox details. The administrator has to sift through a tree view and use embedded data to figure out the details
Administrator Wish List Administrators want to: See the organizational unit’s structure at a glance. Quickly scan the details of all users and take appropriate action. Plan better and faster.
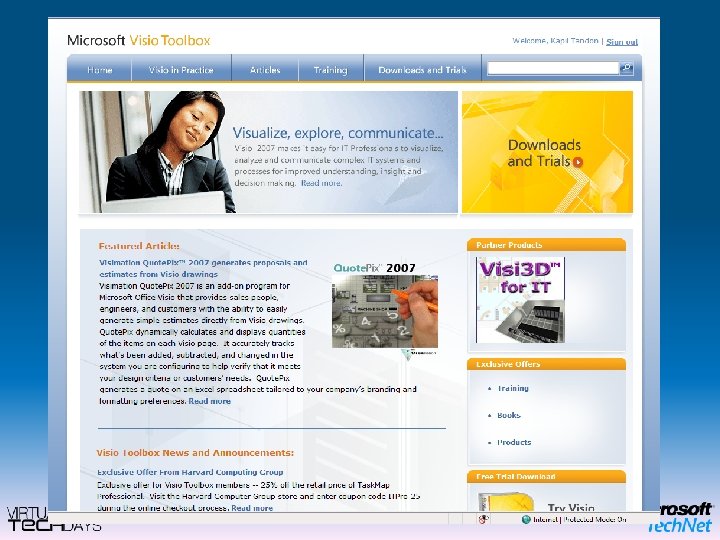
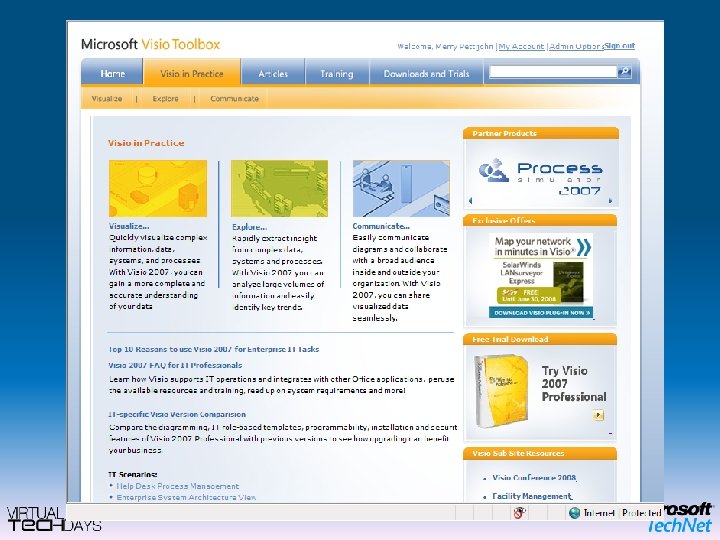
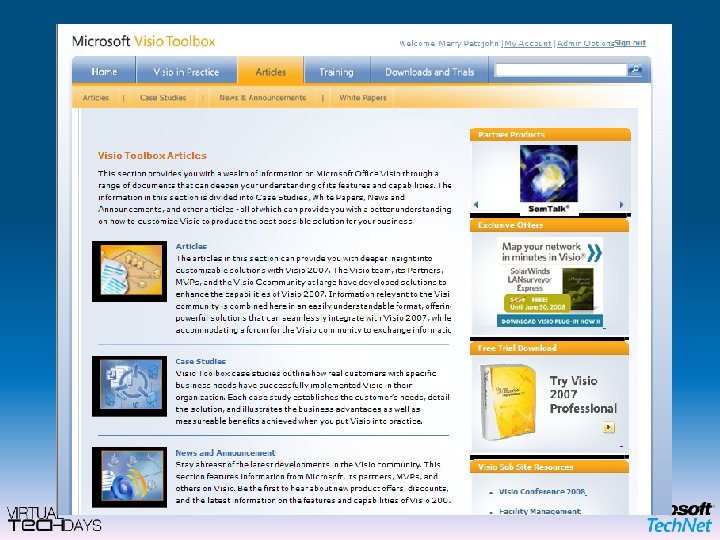
References Visio Tool Box & Download Visio Pro 2007 www. visiotoolbox. com Microsoft & MSDN www. microsoft. com
References Technical Whitepapers Integrating Visio 2007 and Access 2007 <http: //msdn 2. microsoft. com/en-us/library/aa 722522. aspx> Integrating Visio 2007 and Active Directory <http: //msdn 2. microsoft. com/en-us/library/bb 245820. aspx> Integrating Visio 2007 and Excel 2007 <http: //msdn 2. microsoft. com/en-us/library/aa 701255. aspx> Integrating Visio 2007 and Microsoft SQL Server 2005 <http: //msdn 2. microsoft. com/en-us/library/bb 267248. aspx> Integrating Visio 2007 and MOM, Exchange, and Reporting Services <http: //msdn 2. microsoft. com/en-us/library/bb 264455. aspx> Integrating Visio 2007 and Project 2007 <http: //msdn 2. microsoft. com/en-us/library/aa 827350. aspx> Integrating Visio 2007 and Share. Point Products and Technologies <http: //msdn 2. microsoft. com/en-us/library/bb 229690. aspx>
Feedback / Qn. A Your Feedback is Important! Please take a few moments to fill out our online feedback form at: << Feedback URL – Ask your organizer for this in advance>> For detailed feedback, use the form at http: //www. connectwithlife. co. in/vtd/helpdesk. aspx Or email us at vtd@microsoft. com Use the Question Manager on Live. Meeting to ask your questions now!
Contact Email Address ksrikan@microsoft. com
© 2007 Microsoft Corporation. All rights reserved. Microsoft, Windows Vista and other product names are or may be registered trademarks and/or trademarks in the U. S. and/or other countries. The information herein is for informational purposes only and represents the current view of Microsoft Corporation as of the date of this presentation. Because Microsoft must respond to changing market conditions, it should not be interpreted to be a commitment on the part of Microsoft, and Microsoft cannot guarantee the accuracy of any information provided after the date of this presentation. MICROSOFT MAKES NO WARRANTIES, EXPRESS, IMPLIED OR STATUTORY, AS TO THE INFORMATION IN THIS PRESENTATION.