Contents 1 SMT Stencil printing process Reflow soldering

 及 迴焊(Reflow soldering) 2. Optimization methods Ø")


 Ø Software: Excel or other packages (Mini. Tab, Jmp,")
 used in an economic design of")


 l. The definition of FQLF was introduced by Hsieh")


 y 2: Preheating slope (˚C/Sec) y 3:")


 Preheating slope")


- Slides: 61
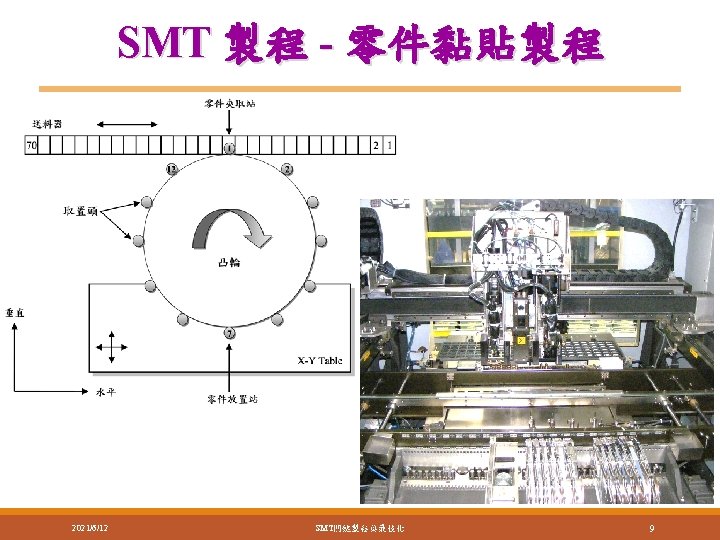
Contents 1. SMT製程簡介 Ø 關鍵製程–錫膏印刷製程(Stencil printing process) 及 迴焊(Reflow soldering) 2. Optimization methods Ø Discrete: Taguchi method (田 口 方 法 ) + Grey relational analysis (灰關聯分析) Ø Continuous: Neural network (類神經網路), Genetic algorithms (基因演算法)、Mathematical modeling(數 學模式)、及Response surface methodology (反應曲 面法) 3. Implementations 2021/6/12 SMT關鍵製程與最佳化 2
Mobile phone - PCB assembly 2021/6/12 SMT關鍵製程與最佳化 3
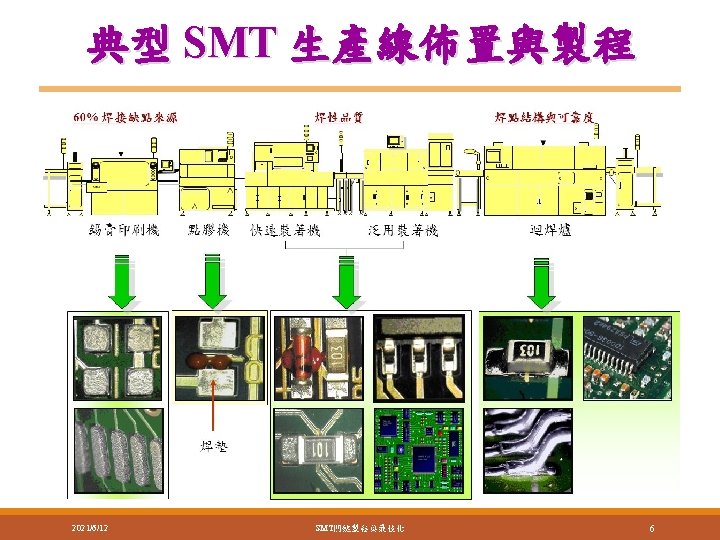
Production lines 2021/6/12 SMT關鍵製程與最佳化 4
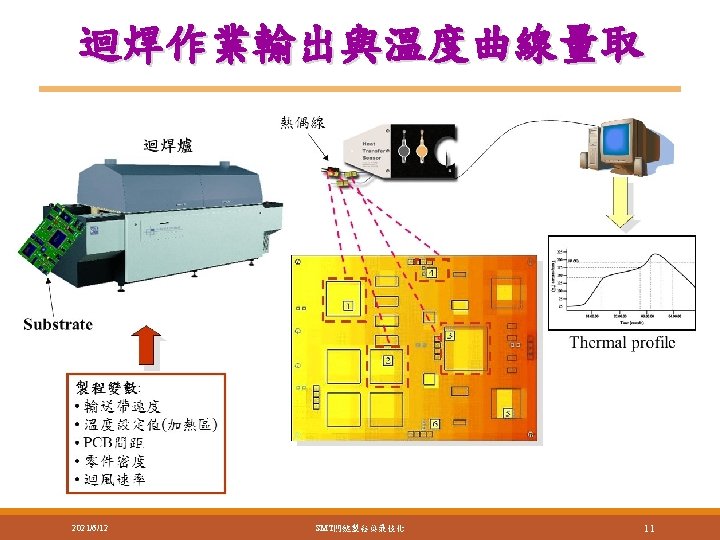
Reflow thermal profile 2021/6/12 SMT關鍵製程與最佳化 12
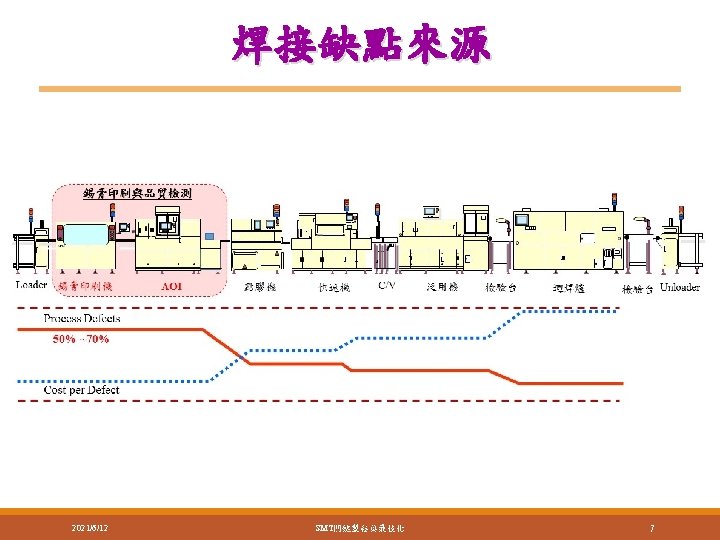
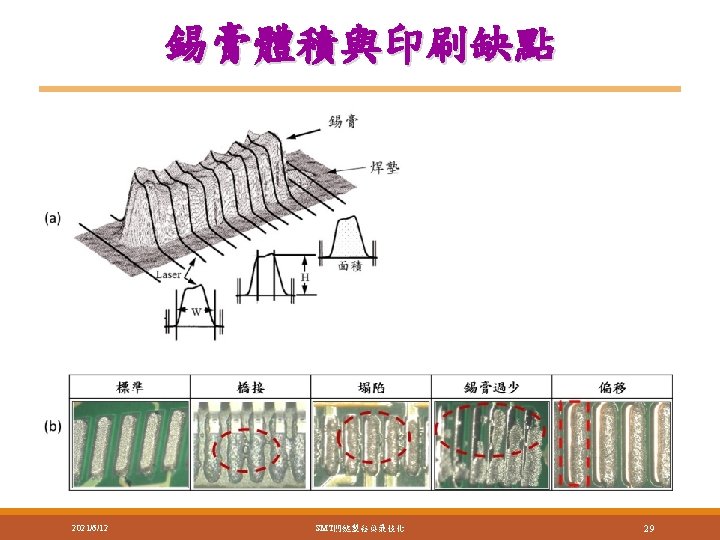
Soldering defects 2021/6/12 SMT關鍵製程與最佳化 13
製程參數最佳化應用方法 1. 田口實驗矩陣(Taguchi Orthogonal array) Ø Software: Excel or other packages (Mini. Tab, Jmp, Design-expert). 2. 類神經網路(Artificial neural network, ANN) Ø Software: Neural. Power, Neuralsolutions… 3. 反應曲面法(Response surface methodology) Ø Software: Design-expert or Mini. Tab 4. 需求轉換函數(Desirability function approach) 2021/6/12 SMT關鍵製程與最佳化 14
田口方法 u The orthogonal arrays and sign-to-noise (S/N) used in an economic design of experiment (DOE) and the Taguchi robust parameter design u S/N ratios based on quality loss function: (1) the smaller-thebetter (STB); (2) the larger-the-better (LTB); and (3) the nominal-the-better (NTB). 2021/6/12 SMT關鍵製程與最佳化 15
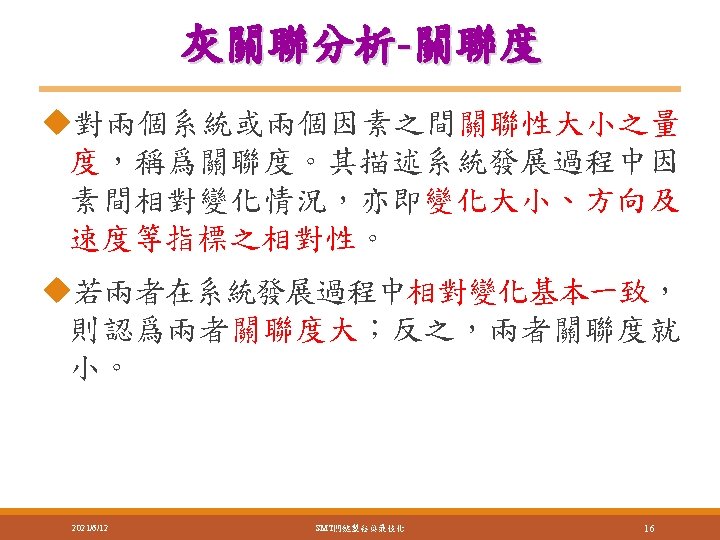
Continuous parameter optimization
Optimizations 2021/6/12 SMT關鍵製程與最佳化 26
Fuzzy quality loss function (FQLF) l. The definition of FQLF was introduced by Hsieh (1999) for single qualitative response is as follows. 2021/6/12 SMT關鍵製程與最佳化 30
FQLF l. The new value of FQLF can be obtained by multiplying the original FQLF value with the significance weights (wp) drawn by AHP analysis 2021/6/12 SMT關鍵製程與最佳化 31
DOE-Factor and responses 2021/6/12 SMT關鍵製程與最佳化 32
Definitions of qualitative characteristics MBF definition of printing quality Element of the universal set u; u {1, 2, 3, 4, 5} Category of 1 2 3 4 5 I 0. 01 0. 04 0. 16 0. 64 1 II 0. 1 0. 2 0. 4 0. 8 1 III 0 0. 2 0. 5 0. 2 0 IV 1 0. 8 0. 5 0. 2 0 V 1 0. 64 0. 25 0. 04 0 response 2021/6/12 SMT關鍵製程與最佳化 34
The summary of ANOVA analysis Source Model C D E G H E 2 CE DE DG EG EH 2021/6/12 Sum of Squares 1291350194 9602123. 37 84061463. 6 59160521. 7 1114657671 3657035. 36 27765011 3157033. 24 4246687. 19 20770524. 8 20467464. 8 4194327 DF 16 1 1 1 2 2 2 Mean Square 80709387. 12 9602123. 371 84061463. 61 59160521. 72 557328835. 7 1828517. 678 27765011. 01 3157033. 236 4246687. 19 10385262. 39 10233732. 38 2097163. 502 SMT關鍵製程與最佳化 F Value 158. 777402 18. 88999852 165. 3718518 116. 3848999 1096. 417998 3. 597193546 54. 62135786 6. 210746398 8. 354393254 20. 43064681 20. 1325459 4. 125693235 Prob. > F < 0. 0001 0. 0294 < 0. 0001 0. 0136 0. 0043 < 0. 0001 0. 0177 35
Control limits of solder volume Lead pitch UCL Nominal LCL 0. 40 mm 4, 500 mil 3 3, 675 mil 3 2, 850 mil 3 0. 50 mm 7, 500 mil 3 5, 875 mil 3 4, 250 mil 3 0. 65 mm 10, 500 mil 3 8, 875 mil 3 7, 250 mil 3 For 0. 5 mm pitch printing mode 2021/6/12 SMT關鍵製程與最佳化 36
Optimization results of the parameter settings Methods Parameters/Lead pitch Stencil thickness Aperture size Snap-off height Squeegee speed Squeegee pressure Paste viscosity Paste particle size Methods PI DPMO Process sigma 2021/6/12 Hybrid intelligence #1 (solution #1) Hybrid intelligence #2 (solution #2) RSM (solution #3) 0. 40 mm 0. 50 mm 0. 65 mm 1. 1 85 0. 7 48 1 940 Type III 1. 2 105 1. 0 58 4. 9 1, 240 Type II 1. 3 105 2. 0 25 1. 2 930 Type II 1. 2 93 1. 3 54 2. 7 947 Type III 1. 3 105 0. 8 26 3. 9 1. 0 Type II 1. 1 111 1. 7 45 1. 1 950 Type II 1. 5 85 0. 0 20 3. 9 1, 060 Type III 1. 0 115 1. 9 28 1. 0 1, 100 Type IV 1. 0 115 0. 0 20 4. 0 920 Type II Mass Hybrid intelligence #1 Hybrid intelligence #2 RSM production (solution #1) (solution #2) (solution #3) 17, 143 5, 952 10, 476 15, 475 3. 6 4. 0 3. 8 3. 7 SMT關鍵製程與最佳化 37
Optimization methods 2021/6/12 SMT關鍵製程與最佳化 39
Reflow outputs 2021/6/12 SMT關鍵製程與最佳化 40
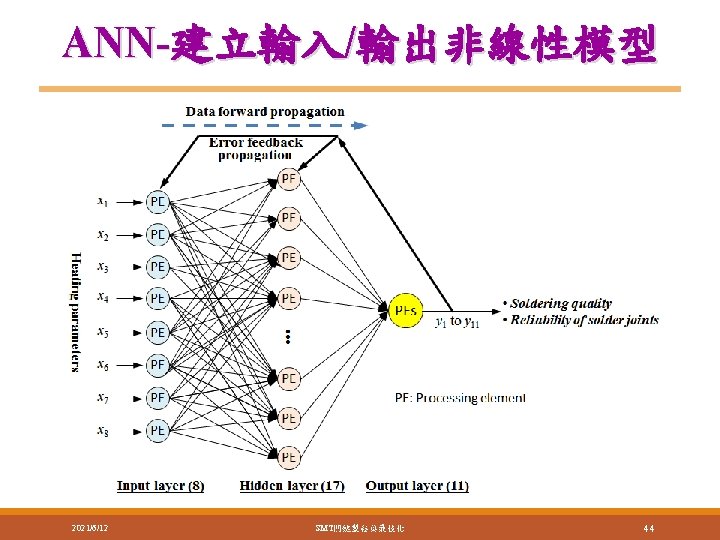
Reflow inputs/outputs 2021/6/12 SMT關鍵製程與最佳化 41
Normal plot-資料驗證 2021/6/12 SMT關鍵製程與最佳化 42
ANOVA 2021/6/12 SMT關鍵製程與最佳化 43
GA-最佳化參數尋優 1. The uniform crossover and real value coding are applied in the GA evolutionary process. The GA optimization process can be divided into the four key steps: 2. The size of the initial population is 80, which ensures the efficiency of the searching process and premature convergence. 3. Each chromosome is evaluated by applying the trained QP neural network as the fitness function to the decoded sequences of the factors. Tournament selection is utilized and the probability of crossover (Pc) is set to 0. 8. The probability of mutation (Pm) is set to 0. 1. A high mutation probability is employed to carry new parameter sets into the GA evolutionary process. 4. Repeat steps 2 and 3 above. The algorithm runs only once and terminates when there is no improvement on the best chromosome for 10, 000 iterations. 2021/6/12 SMT關鍵製程與最佳化 45
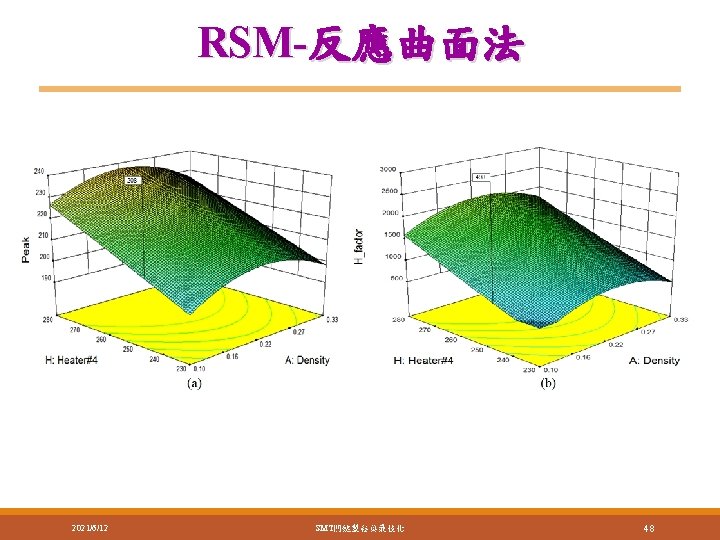
Mathematical modeling quadratic polynomials 2021/6/12 SMT關鍵製程與最佳化 46
求解-Lingo the objective function 2021/6/12 SMT關鍵製程與最佳化 47
Confirmation Experiments 2021/6/12 SMT關鍵製程與最佳化 49
Profile simulation 2021/6/12 SMT關鍵製程與最佳化 50
Discrete parameter optimization
Optimization flow 2021/6/12 SMT關鍵製程與最佳化 52
目標值 Responses y 1: Peak temperature (˚C) y 2: Preheating slope (˚C/Sec) y 3: Soaking temperature (˚C) y 4: Ramp-up slope (˚C/Sec) y 5: D 1 (Sec) y 6: D 2 (Sec) y 7: D 3 (Sec) y 8: D 4 (Sec) y 9: Heating factor (Sec. ˚C) 2021/6/12 SMT關鍵製程與最佳化 Target 210 3. 0 160 2. 0 110 80 50 45 450 53
DOE 2021/6/12 SMT關鍵製程與最佳化 54
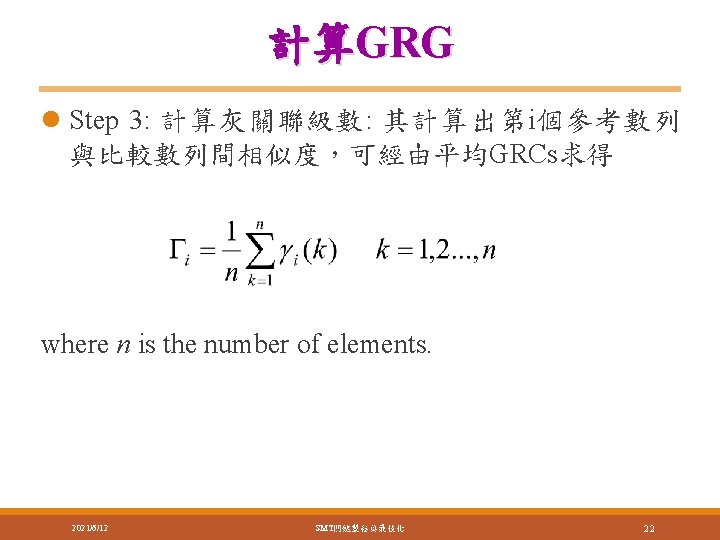
GRCs & GRG 2021/6/12 SMT關鍵製程與最佳化 55
Grey-Taguchi method 2021/6/12 SMT關鍵製程與最佳化 56
Determining the optimal combination of factor levels l最佳參數組合:A 2 B 2 C 3 D 2 E 2 F 3 G 2 l參數設定值: ØHeater#1溫度(level 2)(185˚C) ØHeater#2(165 ˚C) ØHeater#3(185˚C) ØHeater#4(255˚C) Øexhaust rate (4. 0 m 3/min) Øconveyor speed (0. 85 m/min) ØPCB gap (11 cm) 2021/6/12 SMT關鍵製程與最佳化 57
ANOVA and Contributions Factor A B C D E F G Error Total 2021/6/12 SS 0. 0092 0. 0291 0. 0138 0. 0080 0. 0297 0. 0307 0. 0230 0. 0120 0. 1554 DOF 1 2 2 2 4 17 Var F ρ% 0. 0092 3. 0664 12. 02% 0. 0146 4. 8694 19. 09% 0. 0069 2. 3009 9. 02% 0. 0040 1. 3370 5. 24% 0. 0148 4. 9634 19. 46% 0. 0153 5. 1263 20. 10% 0. 0115 3. 8451 15. 07% 0. 0030 *Note: ≥ 99% confidence SMT關鍵製程與最佳化 58
Results of confirmation experiments Method Factor levels Responses Peak Temp. (y 1) Preheating slope (y 2) Soaking Temp. (y 3) Ramp-up slope (y 4) D 1 (y 5) D 3 (y 6) D 3 (y 7) D 4 (y 8) Heating factor (y 9) 2021/6/12 Factor setting for mass Grey-Taguchi method production Confirmation Improveme Confirmation experiments nt A 2 B 2 C 2 D 2 E 1 F 1 G 1 A 2 B 2 C 3 D 2 E 2 F 3 G 2 -Average S/N (d. B) -196. 60 30. 92 211. 80 34. 85 3. 93 3. 62 22. 31 2. 92 21. 05 -1. 26 154. 40 31. 65 161. 00 34. 84 3. 19 2. 34 21. 05 2. 06 22. 66 1. 61 97. 00 26. 31 110. 60 30. 34 4. 03 88. 00 27. 59 79. 60 29. 39 1. 80 42. 40 21. 83 57. 40 24. 65 2. 82 36. 60 20. 94 47. 00 22. 83 1. 90 255. 80 17. 08 459. 60 23. 73 6. 66 SMT關鍵製程與最佳化 PIR (%) --12. 71% -5. 66% 10. 08% 7. 65% 15. 33% 6. 52% 12. 91% 9. 07% 38. 99% 59
Thermal contours generated from confirmation experiments 2021/6/12 SMT關鍵製程與最佳化 60
Q&A