Consumer Behaviour Perception Chapter Outline Elements of Perception

Consumer Behaviour Perception

Chapter Outline • Elements of Perception • Aspects of Perception – Selection – Organization – Interpretation

• PERCEPTION IS DEFINED AS THE PROCESS BY WHICH AN INDIVIDUAL SELECTS, ORGANISES AND INTERPRETS STIMULI INTO A MEANINGFUL AND COHERENT PICTURE OF THE WORLD. • How we see the world around us. • SOI is an individual process based on each person’s own needs, values and expectations.

Elements of Perception • • Sensation Absolute threshold Differential threshold Subliminal perception

Figure 2. 1 An overview of the perceptual process

SENSATION • Sensation is the immediate and direct response of the sensory organs to simple stimuli. • Stimuli-Advertisement, package, Products, Brand Name. • Sensitivity refers to the experience of sensation.
 • Amount")
SENSATION DEPENDS ON • Depends on Quality of sensory receptors( eyesight, hearing) • Amount of or intensity of the stimuli to which he or she is exposed • Also it depends on energy change( i. e differentiation of input)EX: A person living on a noisy road side would notice the noise of one more car honking. When there is a great deal of sensory input , the sense do not detect small changes in input.

ABSOLUTE THRESHOLD • Lowest level at which an individual experiences a sensation is called absolute threshold. • The point at which an individual can detect a difference between something and nothing. • EX: Two people in a car notice the billboards at different times(i. e at different distances)

SENSORY ADAPTATION • Under constant stimulation such as driving thro a corridor of bill boards the Absolute threshold increases as the sense are dulled. • After an hour of driving through billboards it is doubtful that any one billboard will make an impression. • We speak of getting used to the stimuli: Hot water, bright sun or noise.

SENSORY ADAPTATION AND MKTG • Need to change advertising campaigns regularly. Concerned about consumers getting used to the ad and the ad not providing sensory input. – EX: Asmi diamonds the sprit of a woman Perizad zorabian / Priyanka chopra • To cut thro clutter some Ads try to increase sensory inputs. • EX: Buy up all the space in a magazine/bus hoardings to carry only the New product’s Ad. • Star channels aired only Vodafone ads during 24 hrs

SENSORY ADAPTATION AND MKTG • Other decrease inputs: use silence to generate attention(absence of audio). • Seek unusual media Bus shelters, checkout counters, shopping carts, appear in TV shows or in movies. ( product placement). TV outside lifts showing ads. • Fragrance marketers use Direct Mail to send sealed perfume inserts.

SENSORY ADAPTATION AND MKTG • Others retain scent researchers to develop specially engineered scents to enhance the product • EX; car dealers spray old cars with scent of new leather. • Research shows that use of ambient scents in a retail environment enhances the shopping experience for consumers and makes them spend time in examine the merchandise, waiting in line and wait for help. • Package designers design the package to stand out
 Weber’s Law: I/I = K; Absolute Threshold The")
Sensory Thresholds Just Noticeable Difference (jnd) Weber’s Law: I/I = K; Absolute Threshold The absolute threshold refers to the minimum amount of stimulation that can be detected on a sensory channel. Differential Threshold The differential threshold refers to the ability of a sensory system to detect changes or differences between two stimuli.

DIFFERENTIAL THRESHOLD • minimal difference that can be detected between two similar stimuli is called Diff Threshold or j. n. d( just noticeable difference). • Jnd between stimuli is Not an absolute amount but an amount relative to the intensity of the first stimuli. • EX: if price of automobile raise by few hundreds it would not be noticed as opposed to a few thousand Rs. Similarly few Rs in price of petrol per litre would be noticed.

Jnd and MKTG • An additional level of stimulus equivalent to the jnd must be added for the majority of the people to perceive a difference between the resulting stimulus and initial stimulus. • EX: Silver polish manufacturer wants to improve the product sufficiently to claim that it retards tarnish longer that the leading competitive brand.

• Establishes through a series of experiments that jnd for its present polish is 5 days ( which presently last for 20 days). So the polish must be improved to to last for 25 days at least.

MKT APLICATIONS AND Jnd • Marketers Determine Relevant jnd for their products for two reasons: – so that negative changes (eg. reductions in product size, or quality or price ) are not discernible to public. (just below jnd) – So that product improvements ( improved or updated packages , larger sze, or lower price) are apparent to the customer. ( just above jnd)

• jnd used for packaging changes, brand chnages. Small changes over a period of time rather than one big change which may affect brand equity. • EX: • Change in logos • Brooke Bond Mother brand under which Taj Mahal would get subsumed.

Discussion Question • How might a cereal manufacturer such as Kellogg’s use the j. n. d. for Fruit Loops in terms of: – Product decisions – Packaging decisions – Advertising decisions – Sales promotion decisions.

Dynamics of Perception

Aspects of Perception Selection Organization Interpretation

Perceptual Selection • Which stimuli get selected depends ON • ---nature of stimulus • ----consumers previous experience as it affects expectations • -----and their motives at that time.

Nature of stimulus • Marketing stimuli include : Nature of product, physical attributes, packaging, brand name. advertising, positioning • CONTRAST – EX: Oversized ads spilling over the page, use of white space, 60 sec commercials alongside 20 second commercials, surrealistic imagery, humour • Lack of Contrast. • EX: product ad close to the storyline of the programme that viewers are unaware of.

Expectations – People see what they expect to see ad what they expect to see is based on familiarity, previous experience or preconditioned set. – EX: If you are told that the movie is a horror movie you will probably find it so

Motives – People tend to perceive things they need or want. The stronger the need the greater tendency to ignore unrelated stimuli. – EX: a person hungry will notice ads for Food.

Concepts in Selective Perception • Selective Exposure – Seek out messages that are sympathetic, pleasant, reassuring of their purchases and avoid unpleasant – TV Program A vs. B – Time vs. Newsweek vs. US News & World Report • Selective Attention – They have a heightened awareness of stimuli that meet their needs or interests/minimal awareness of stimuli irrelevant to their needs – Ads within a Program, Magazine, Internet Frame – Car ads when in/out of the Market for a Car
 • Perceptual Defense: psychologically threatening stimuli is screened out •")
Concepts in Selective Perception(2) • Perceptual Defense: psychologically threatening stimuli is screened out • EX: Smokers screen out messages related to harmful cigarettes • Perceptual Blocking: Tuning out of stimuli • EX: Consumers protect themselves from being bombarded with stimuli by tuning out

Perceptual Selection Concepts • • Selective Exposure Selective Attention Perceptual Defense Perceptual Blocking • Consumers seek out messages which: – Are pleasant – They can sympathize – Reassure them of good purchases

Perceptual Selection Concepts • • Selective Exposure Selective Attention Perceptual Defense Perceptual Blocking • Heightened awareness when stimuli meet their needs

Perceptual Selection Concepts • • Selective Exposure Selective Attention Perceptual Defense Perceptual Blocking • Screening out of stimuli which are threatening

Perceptual Selection Concepts • • Selective Exposure Selective Attention Perceptual Defense Perceptual Blocking • Consumers avoid being bombarded by: – Tuning out – Ti. Vo

PERCEPTUAL ORGANISATION • Figure and Ground • Grouping • Closure

Lacoste’s campaign uses a very plain ground so the symbol really shows. weblink

Gestalt Perceptual Principles


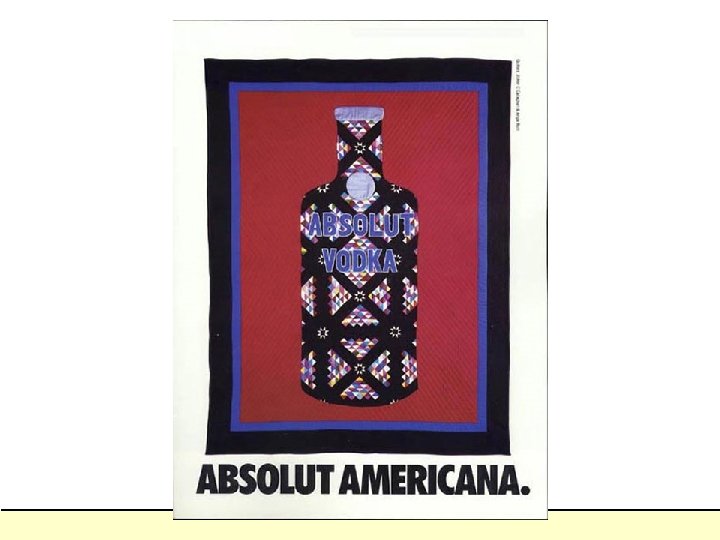
PERCEPTUAL ORGANISATION • Figure and ground-figure perceived more clearly because it appears well defined in contrast to the ground. – Sound, colour, visual – EX: Advertisers must ensure that the stimulus they want noted should be seen as the figure and not as ground. – EX: Absolut Vodka and exception

Organization Principles • Figure and ground • Grouping • Closure • People tend to organize perceptions into figure-andground relationships. • The ground is usually hazy. • Marketers usually design so the figure is the noticed stimuli.

Grouping • Individuals tend to Group stimuli so that it forma a unified picture. • The perception of stimuli as groups or chunks of information rather than bits of information facilitate memory and recall. • Useful to marketer to imply desired meanings in connection with their products. (Mt Dew daring/adventurous vs Coke open happiness/ taste) • EX: Ad showing product like tea consumed by a young couple in a beautiful well appointed room before a blazing hearth. The overall mood implied by the grouping of stimuli leads the consumer to associate the tea drinking with fine living, romance, winter warmth
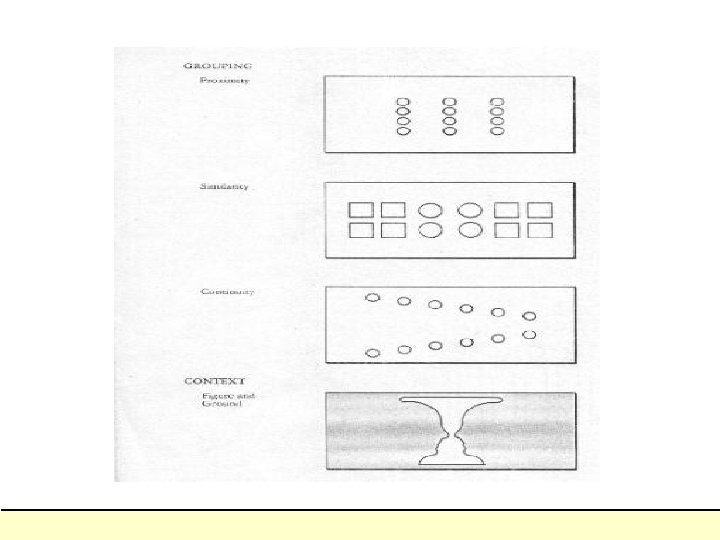

Organization Principles • Figure and ground • Grouping • Closure • People group stimuli to form a unified impression or concept. • Grouping helps memory and recall.

Closure • Individuals have a need for closure • If the pattern of stimuli to which they are exposed is incomplete they tend to perceive it as complete. . • A study found that incomplete tasks are better remembered than complete tasks. • EX: A TV Commercial showing bacon frying in a iron skillet with a voice over in deep cowboy twang was recalled 24 hrs later by viewers as showing a campfire with cowboys sitting around.
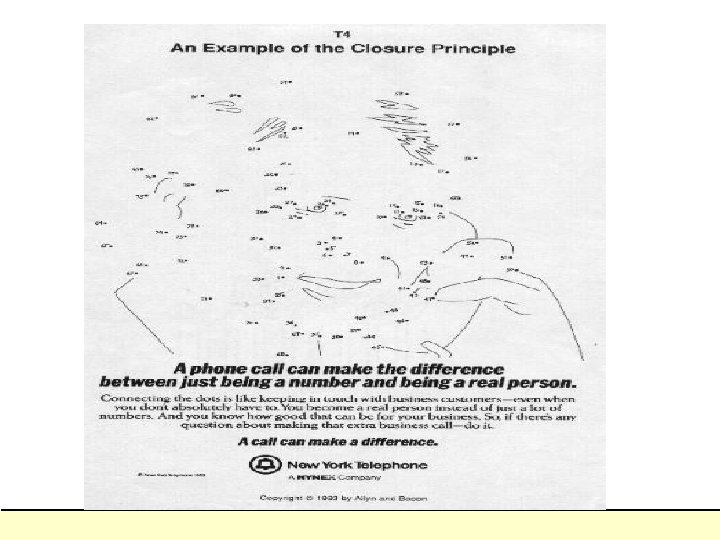

Organization Principles • Figure and ground • Grouping • Closure • People have a need for closure and organize perceptions to form a complete picture. • Will often fill in missing pieces • Incomplete messages remembered more than complete

Interpretation Perceptual Distortion • Physical Appearances • Stereotypes • First Impressions • Jumping to Conclusions • Halo Effect • Important for model selection • Attractive models are more persuasive for some products especially personal enhancement

Dove’s campaign stresses the everyday woman. weblink

PERCEPTUAL INTERPRETATION • Perception is an individual phenomenon. interpretation is also personl • When stimulus are ambiguous an individual will interpret them in such a way that they serve to fulfill personal needs , wishes, interests and so on. • Distorting Influences – Physical appearances– Attribute qualities they associate with certain people to others who may resemble them – EX: Attractive Models are more persuasive and have a positive influence on attitudes( FOR ENHANCEMENT PRODUCTS LIKE LIPSTICK/JEWELLERY)
 • Stereotypes: – Carry pictures in the minds of the meanings of")
Distorting Influences(2) • Stereotypes: – Carry pictures in the minds of the meanings of various kinds of stimuli. These stereotypes set the expectations about situation and people • First impressions • Jumping to conclusions • Halo Effect

Interpretation Perceptual Distortion • Physical Appearances • Stereotypes • First Impressions • Jumping to Conclusions • Halo Effect • People hold meanings related to stimuli • Stereotypes influence how stimuli are perceived

Interpretation Perceptual Distortion • Physical Appearances • Stereotypes • First Impressions • Jumping to Conclusions • Halo Effect • First impressions are lasting • never introduce a flawed product

Interpretation Perceptual Distortion • Physical Appearances • Stereotypes • First Impressions • Jumping to Conclusions • Halo Effect • People tend not to listen to all the information before making conclusion • Important to put persuasive arguments first in advertising

Interpretation Perceptual Distortion • Physical Appearances • Stereotypes • First Impressions • Jumping to Conclusions • Halo Effect • Consumers perceive and evaluate multiple objects based on just one dimension • Used in licensing of names • Important with spokesperson choice

Discussion Question • How might a cereal manufacturer such as Kellogg’s use the j. n. d. for Fruit Loops in terms of: – Product decisions – Packaging decisions – Advertising decisions – Sales promotion decisions.

Issues in Consumer Imagery • • Product Positioning and Repositioning Positioning of Services Perceived Price Perceived Quality Retail Store Image Manufacturer Image Perceived Risk

Positioning • Establishing a specific image for a brand in the consumer’s mind • Product is positioned in relation to competing brands • Conveys the concept, or meaning, of the product in terms of how it fulfills a consumer need • Result of successful positioning is a distinctive, positive brand image
 • Positioning against Competition (Rin vs Tide) •")
Positioning Techniques • Umbrella Positioning( Airtel/Samsung) • Positioning against Competition (Rin vs Tide) • Positioning Based on a Specific Benefit( Pantene Pro V healthy and shines) • Finding an “Unowned” Position (Pril guarantees proven degreasing, odour neutralisation and anti-bacterial protection) • Filling Several Positions ( Colgate with all its pastes) • Repositioning( New Beetle)

Perceptual Mapping • A research technique that enables marketers to plot graphically consumers’ perceptions concerning product attributes of specific brands

Perceptual Mapping Figure 6. 14

Issues in Perceived Price • Reference prices – used as a basis for comparison in judging another price – Internal – External( on sale creates perception of saving) • One study offers three types of pricing strategies based on perception of value.
 Pricing Strategy Provides Value")
Three Pricing Strategies Focused on Perceived Value (Table 6 -1) Pricing Strategy Provides Value By… Implemented As… Satisfaction-based pricing Recognizing and reducing customers’ perceptions of uncertainly, which the intangible nature of services magnifies Service guarantees Benefit-driven pricing Flat-rate pricing Relationship pricing Encouraging long-term relationships with the company that customers view as beneficial Long-term contracts Price bundling Efficiency pricing Sharing with customers the cost savings that the company has achieved by understanding, managing, and reducing the costs of providing the service Cost-leader pricing.

Perceived Quality • Perceived Quality of Products – Intrinsic vs. Extrinsic Cues • Perceived Quality of Services • Price/Quality Relationship

Perceived Quality of Services • Difficult due to characteristics of services – – Intangible Variable Perishable Simultaneously Produced and Consumed • SERVQUAL scale used to measure gap between customers’ expectation of service and perceptions of actual service
 ATTENTIVENESS 1.")
A Scale Measuring Customer’s Perception of Call Center Employees (Table 6 -4) ATTENTIVENESS 1. The agent did not make an attentive impression. 2. The agent used short, affirmative words and sounds to indicate that (s)he was really listening. PERCEPTIVENESS 1. The agent asked for more details and extra information during the conversation. 2. The agent continually attempted to understand what I was saying. 3. The agent paraphrased what had been said adequately. RESPONSIVENESS 1. The agent offered relevant information to the questions I asked. 2. The agent used full sentences in his or her answers instead of just saying yes or no. 3. The agent did not recognize what information I needed. TRUST 1. I believe that this company takes customer calls seriously. 2. I feel that this company does not respond to customer problems with understanding. 3. This company is ready and willing to offer support to customers. 4. I can count on this company to be sincere.
 SATISFACTION I am satisfied with the level of service the")
Table 6 -4 (continued) SATISFACTION I am satisfied with the level of service the agent provided I am satisfied with the way I was spoken to by the agent. I am satisfied with the information I got from the agent. The telephone call with this agent was a satisfying experience. CALL INTENTION I will very likely contact this company again. Next time I have any questions I will not hesitate to call again. I would not be willing to discuss problems I have with this company over the phone.

Price/Quality Relationship • The perception of price as an indicator of product quality (e. g. , the higher the price, the higher the perceived quality of the product. )

Perceived Risk • The degree of uncertainty perceived by the consumer as to the consequences (outcome) of a specific purchase decision • Types – – – Functional Risk( product not perform as expected) Physical Risk(risk to self and others that product may pose) Financial Risk( product will not be worth the cost) Psychological Risk( Bruise consumer ego) Time Risk (time spent on product search may be wasted if product does not perform)

How Consumers Handle Risk • • • Seek Information Stay Brand Loyal Select by Brand Image Rely on Store Image Buy the Most Expensive Model Seek Reassurance

Subliminal Persuasion Subliminal Perception Occurs When The Stimulus Is Below The Level Of The Consumer’s Awareness. Subliminal Techniques Flashed Visual Embeds “Coke” in theatres ually oriented embed “Drink coke” Low-Level Auditory Self Help

Evaluating Subliminal Techniques Threshold Differences Distance and Position Control Subliminal Marketing ? ? Viewing Attention Control Generalized Effect

Attention Is The Degree To Which Consumers Focus On Stimuli Within Their Range of Exposure. Countering Advertising Clutter Large Block Advertising Bookend Ads Unconventional Locations Creating Contrast Unpredictable Patterns Size Color

Interpretation The Process of Interpretation Ambiguity Schema Multiple Meanings Biases Stimulus Organization Closure Similarity Figure. Ground

Gestalt Perceptual Principles

Figure 2. 5 Relationship of components in semiotic analysis of meaning
 •")
Why Are These Mens/Women’s Cars? PERCENT PERCEIVING AS FEMININE: • Toyota Tercel (92%F) • Geo Storm (64%F) • Honda Civic (62%F) PERCENT PERCEIVING AS MASCULINE: • Ford Mustang (95%M) • Ford Explorer (85%M) • Buick Roadmaster (82%M)

Percent Female Buyers 2000 Automobiles • • • VW Cabriolet 66. 7% Infiniti G 20 64. 3% Saturn SC/SW 59. 6% Toyota RAV 4 55. 4% Pontiac Sunfire 54. 9% Toyota Camry Solara 54. 2% Mercury Cougar 53. 6% Honda CR-V 53. 2% Chevrolet Prizm 52. 7% Kia Sportage 52. 4% Saturn SL 52. 4% • • • Plymouth Prowler 9. 1% Jaguar XKR 10. 0% Dodge Viper 10. 5% Acura NSX-T 11. 1% Mercedes CL-class 11. 1% GMC Yukon XL 11. 8% Porsche 911 13. 3% Chevrolet Corvette 13. 8% Audi S 4 18. 0% Jaguar XJR 18. 2% Infiniti Q 45 18. 5% BMW 7 -series 18. 5%

Product Positioning • Positions are perceptual images of marketing offerings relative to: – Competitors – Target Consumers – Attributes of the Offering • Why Position a brand/store? – Target Marketing – Niche Marketing – Avoiding head to head competition with market leaders • How is Product Position Determined? – Marketers – Consumers – Measurement via multi-dimensional scaling

Multidimensional Scaling F CC SC S

Multidimensional Scaling F C SC S
 Has a touch of")
12 -3 Market Positioning Map of Selected Automobile Brands (1984) Has a touch of class A car I’d be proud to own Distinctive looking Conservativelooking. Appeals to older people • Lincoln BMW • • Porsche 4. Cadillac • 5. Mercedes • • Chrysler 2. • Pontiac • Buick Oldsmobile • Ford • Dodge • Plymouth • • Chevrolet • Datsun 1. • Toyota 3. • VW Spirited performance. Sporty looking Fun to drive. Appeals to young people Very practical Gives good gas mileage Affordable Exhibit 12. 2 Source: John Koten, “Car Maker’s Use ‘Image’ Map as Tools to Position Products, ” The Wall Street Journal, March 22, 1984, pp. 31. Reprinted by permission of The Wall Street Journal, © 1984 Dow Jones & Company, Inc. All rights reserved worldwide
 Sporty Ford")
12 -5 Illustration of Joint Space of Ideal Points and Stimuli (1968) Sporty Ford Mustang • Plymouth Barracuda • • AMC Javelin Mercury • Cougar • Chevrolet Corvette • Ideal point for subject J • Ford Falcon Exhibit 12. 6 • Jaguar sedan • Ideal point for subject I • Ford Thunderbird V 8 Luxurious • Lincoln Continental • Chrysler Imperial • Buick Le Sabre Source: Paul E. Green and Donald S. Tull, Research for Marketing Decisions, 3 rd ed. (Englewood Cliffs, NJ: Prentice Hall, 1975), p. 601. © 1975. Adapted by permission of Prentice Hall Inc. , Upper Saddle River, NJ.

12 -4 How the Honda Accord Extended the Product Space, 1985 Cost. 9 • Honda Accord Overall rating . 8 • BMW 320 i . 7 • VW Rabbit. 1 • Datsun 200 SX. 2 . 3 • Toyota Celica. 4 . 6 • Mazda 626. 4. 3 • Chrysler K-car • Chevrolet • Ford Citation Mustang Exhibit 12. 5 . 6 • Audi 4000. 7 . 8 . 9 Performance . 2. 1 Source: Johny K. Johansson and Hans B. Thorelli, “International Product Positioning, ” Journal of International Business Studies, vol. 16, no. 3, (Fall 1985), pp. 57 -75. Reprinted by permission of the Journal of International Business Studies

Types of Factors Affecting Perception • Stimulus Factors--e. g. , size, color, movement, type style & variety, multisensory (e. g. , smell) • Person Factors--e. g. , hunger, interests, adaptation level, perceptual vigilance & readiness, biases • Situation Factors--e. g. , culture, context, position, surrounding editorial material, mood
 ALL THESE FACTORS AFFECT: • Attention (whether the stimulus is perceived,")
(Factors Affecting Perception) ALL THESE FACTORS AFFECT: • Attention (whether the stimulus is perceived, and what is perceived first, next, etc. ) • Interpretation (how the stimulus is perceived)
- Slides: 84