
CONSUMER BEHAVIOR INDIFFERENCE CURVE APPROACH BY NEERU KANG
CONSUMER BEHAVIOR: INDIFFERENCE CURVE APPROACH BY NEERU KANG
INTRODUCTION It was first given by Edgeworth, but he uses it to show the possibility of exchange between two persons and not to explain consumer’s demand. Two English economist, J. R. Hicks and R. G. D. Allen in their paper ‘A Reconsideration of the Theory of Value’, criticised Marshall’s cardinal utility analysis and put forward the indifference curve approach based on ordinal utility to explain consumer behavior. In 1939, Hicks reproduced the indifference curve theory in his book ‘Value and capital’.

ORDINAL UTILITY According to the supporters of the indifference curve theory, utility is a psychic entity and it cannot therefore be measured in quantitative cardinal terms. Utility is psychological feeling is not quantifiable. Ordinal utility implies that the consumer is capable of simply ‘comparing the different levels of satisfaction’. According to the ordinal utility hypothesis, while the consumer may not be able to indicate the exact amount of utility that he derives from commodities or any combination of them, but he is capable of judging whether the satisfaction obtained from a good or a combination of goods is equal to, lower than, or higher than another.
MEANING Indifference curve shows different combinations of two goods that gives equal satisfaction to the consumer and consumer is indifferent in the choice of matter between them. Definition Koutsoyiannis, “An indifference curve is the locus of point particular combination of goods, which yield the same utility to the consumer, so that he is indifferent as to the particular combination he consumes. ”
ASSUMPTION � � � � Rational Consumer Ordinal Utility Diminishing Marginal Rate of Substitution Two Goods Model Continuity Scale of Preference Transitivity Consistency in Selection � Non Satiety � Weak Ordering
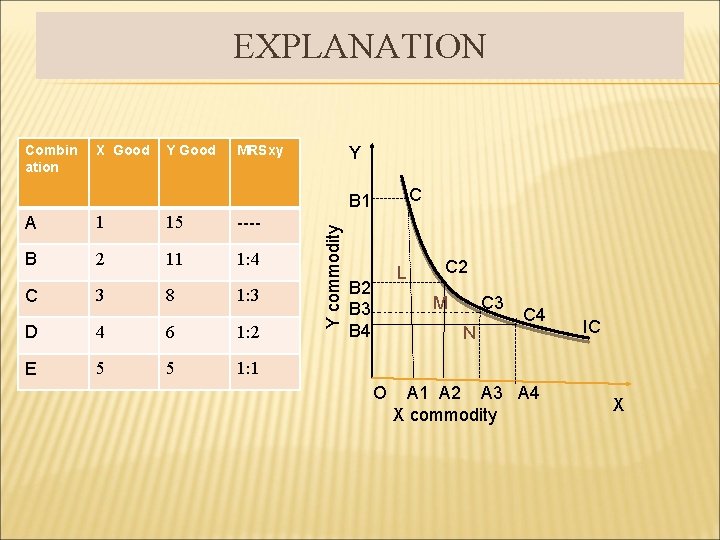
EXPLANATION Combin ation X Good Y Good MRSxy Y C A 1 15 ---- B 2 11 1: 4 C 3 8 1: 3 D 4 6 1: 2 E 5 5 1: 1 Y commodity B 1 L B 2 B 3 B 4 C 2 M C 3 N O C 4 A 1 A 2 A 3 A 4 X commodity IC X

INDIFFERENCE MAP Y Commodity It consist of set of indifference curves. A diagram showing a number of indifferent curves corresponding to different Y indifference schedules is an indifference map. A lower IC shows lower level of satisfaction. IC 1 IC 2 IC 3 O X Commodity X
MARGINAL RATE OF SUBSTITUTION The rate at which the consumer is prepared to exchange goods X and Y is known as marginal rate of substitution. Or We may define the marginal rate of substitution of X for Y as the amount of Y whose loss can just compensate the consumer for one unit gain in X.

LAW OF DIMINISHING MARGINAL RATE OF SUBSTITUTION MRS of X for Y diminishes as more and more of good X is substituted for good Y. In other words, as the consumer has more and more of good X, he is prepared to forgo less and less of good Y. ▲Y ▲X MRSxy=(-) -----
REASONS FOR DIMINISHING MRS There are two reasons: v First, the want for a particular good is satiable v Second, the goods are imperfect substitutes
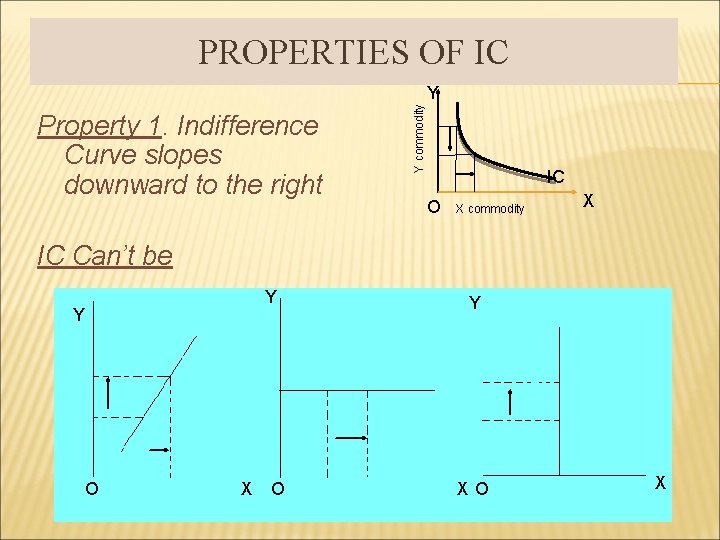
PROPERTIES OF IC Property 1. Indifference Curve slopes downward to the right Y commodity Y IC O X commodity X IC Can’t be Y Y O X O Y XO X
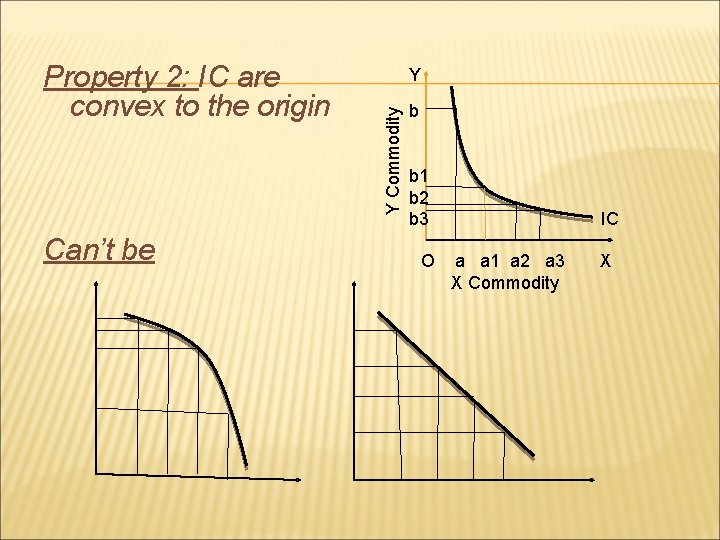
Can’t be Y Y Commodity Property 2: IC are convex to the origin b b 1 b 2 b 3 O IC a a 1 a 2 a 3 X Commodity X
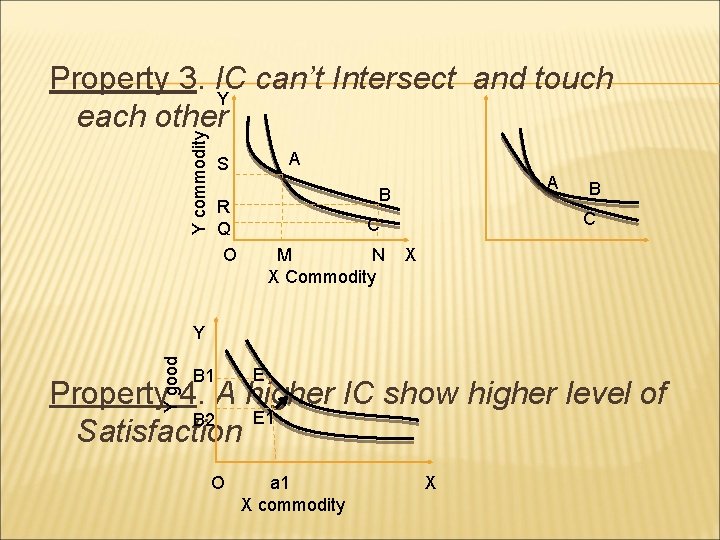
Y commodity Property 3. IC can’t Intersect and touch Y each other A S A B R Q O C C M N X Commodity B X Y good Y B 1 E Property 4. A higher IC show higher level of E 1 B 2 Satisfaction O a 1 X commodity X
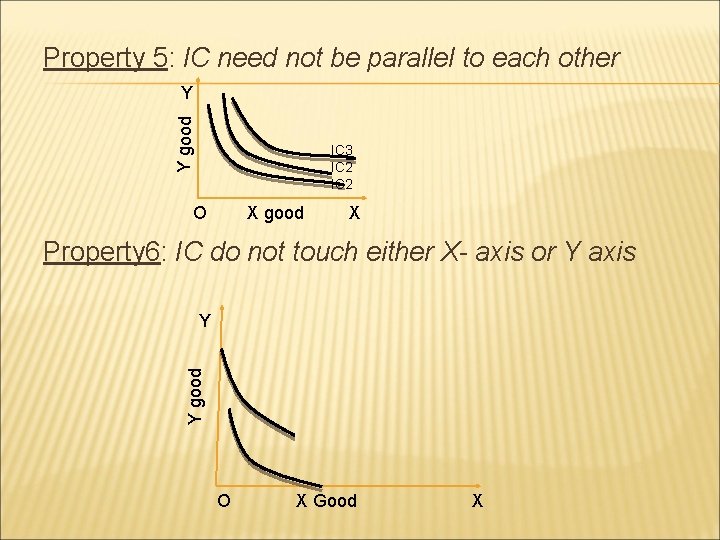
Property 5: IC need not be parallel to each other Y good Y IC 3 IC 2 O X good X Property 6: IC do not touch either X- axis or Y axis Y good Y O X Good X

Y good IC in case of Substitute IC 1 IC 2 Y good X good IC in case of complimentary goods IC 2 IC 1 X good

THANK YOU
- Slides: 16