
Constructing a metric of wellbeing among older people
Constructing a metric of well-being among older people in the UK (for Age UK) Presentation by Asghar Zaidi, University of Southampton with Marcus Green, Age UK José Iparraguirre, Age UK CASE Social Exclusion Seminar, 1 st February, 2017 Lincoln’s Inn Fields, London School of Economics
Work undertaken jointly with Age UK’s Policy and Research team – – Dr Marcus Green Professor José Iparraguirre Dr Susan Davidson Phil Rossall The Index of Wellbeing in Later Life will be showcased at Age UK’s ‘For Later Life Conference’, 8 th February 2017 http: //www. ageuk. org. uk/professional-resources-home/conferences/forlaterlife/ More details of Age UK’s research on wellbeing is available at: www. ageuk. org. uk/wellbeingresearch Age UK is a charitable company limited by guarantee and registered in England Wales (registered charity number 1128267 and registered company number 6825798). The registered address is Tavis House, 1 -6 Tavistock Square, London WC 1 H 9 NA. Age UK and its subsidiary companies and charities form the Age UK Group, dedicated to helping more people love later life. ID 203436. February 2017
Outline 1. Motivation § Learnings from the past; Filling a knowledge gap! § Why? The objective/ What? Defining an index? § What is required? 2. Five steps involving research and consultations (1) Conceptual model; (2) Data preparation; (3) Modelling wellbeing; (4) Choice of domains; and (5) Calculating the Index “Wellbeing in Later Life” 3. Key findings (see also the handout) § Relative importance of individual indicators; average results § Group-specific results and inequality in wellbeing 4. Conclusions/ What next?
Part 1 Motivation
1. 1 Learnings from the past • Two previous pieces of work • The AAI constructed for the EC/ UNECE during 2012 -2015 • The Global Age. Watch Index for Help. Age International, 2013 -2015 Ø Data constraints: Restricted data available because of the purpose of the work: comparative analysis Ø Methodology restrictions: e. g. , discussions with Sir Tony Atkinson who did not believe in composite indices, …. Ø He also held the view that the aggregation of multidimensional macro indicators into a composite index is conceptually less defensible than the method of summation of individual attributes within an individual (see, e. g. , Atkinson and Marlier 2012).
Filling a knowledge gap Lacking important, valid, and reliable instruments to assess different aspects of wellbeing… especially those that integrate all relevant dimensions of wellbeing into a single and coherent scale covering wellbeing (Prilleltensky et al, 2015) Review of literature also revealed that there is a need to understand better: • • What different components of wellbeing are important in later life? How older people are doing in the UK? Where and why wellbeing is low? How can we monitor the situation? What effects various policy and practical levers might have in improving wellbeing?
1. 2 Why? The objectives Ø To serve for the evidence-informed advocacy for Age UK • Where and why is wellbeing for older people is low? • How changes in the lives of older people can be monitored? • Local Age UKs need data intelligence to target their support services. Using wellbeing as a preferred outcome of interest – it is deemed as a preferable way to measure progress in the society (Stiglitz, Sen and Fitoussi 2009; many others) and • Focus on older persons only, rather than all ages; • Cover most aspects of people’s lives by using multiple indicators of wellbeing in one single measure; • Focus on objective as well as subjective aspects of life and wellbeing
What? Constructing a metric of Wellbeing in Later life A metric (or index) summarises the information into a single composite measure - It combines multiple indicators across dimensions into one single measure, - It includes tiers such as domains and indicators with different weights to signify their importance. - It allows for disaggregation so as to understand their relative importance An Index is nothing more than a scale, although some scales give everything an equal weight and add up answers to give you a summary score.
1. 3 What is required? Ø Selection of a dashboard of indicators Ø Determination of the relative importance of each indicator (the weights)? Ø Categorisation into tiers of indicators and domains (most commonly: financial/ non-financial; individual attributes/ local age-friendly environment) Ø Normalisation of indicators and aggregation To serve Age UK’s purpose best, it was also essential to Undertake consultations with subject specialists (from academia/ internally within Age UK); and also do ‘sense checking’ by discussions with older men and women
Part 2 Five steps involving research and consultations
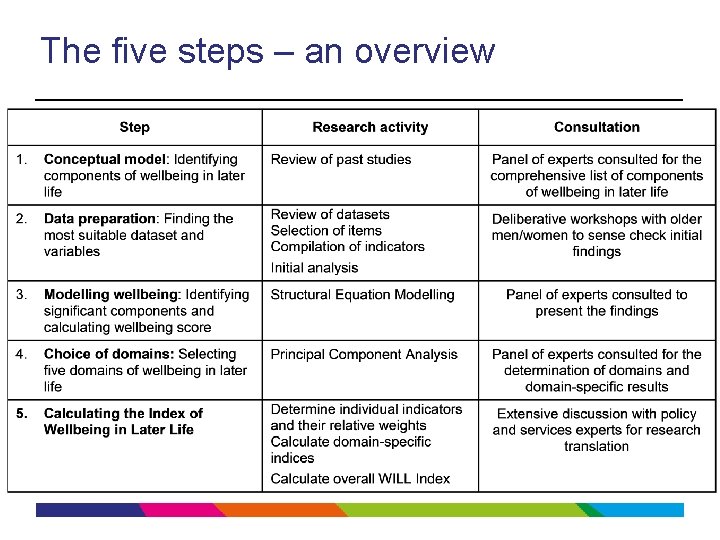
The five steps – an overview
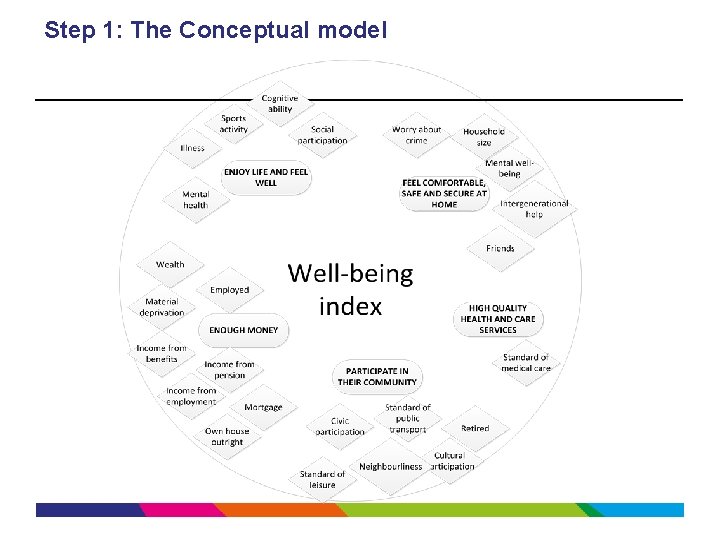
Step 1: The Conceptual model
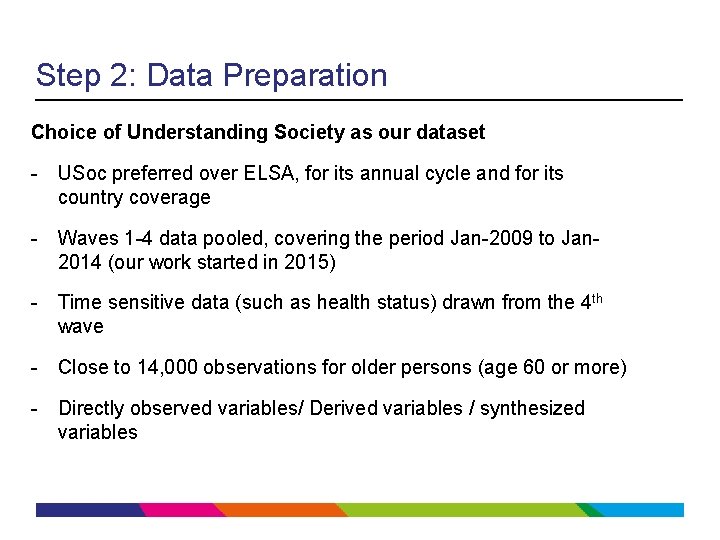
Step 2: Data Preparation Choice of Understanding Society as our dataset - USoc preferred over ELSA, for its annual cycle and for its country coverage - Waves 1 -4 data pooled, covering the period Jan-2009 to Jan 2014 (our work started in 2015) - Time sensitive data (such as health status) drawn from the 4 th wave - Close to 14, 000 observations for older persons (age 60 or more) - Directly observed variables/ Derived variables / synthesized variables
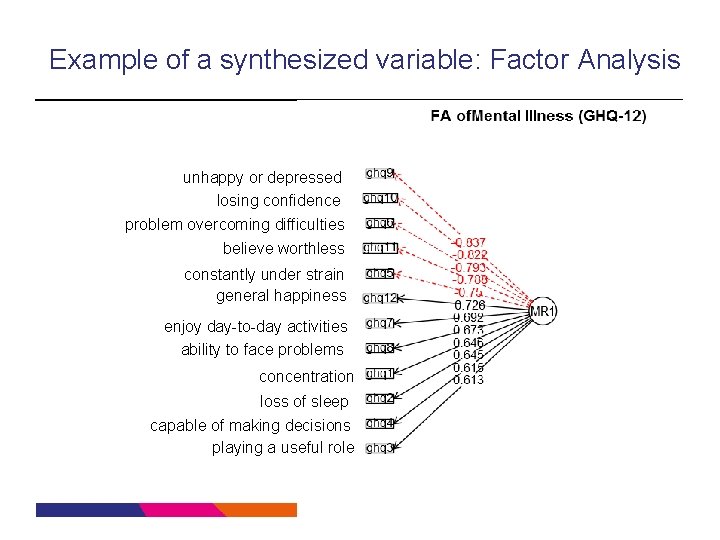
Example of a synthesized variable: Factor Analysis unhappy or depressed losing confidence problem overcoming difficulties believe worthless constantly under strain general happiness enjoy day-to-day activities ability to face problems concentration loss of sleep capable of making decisions playing a useful role
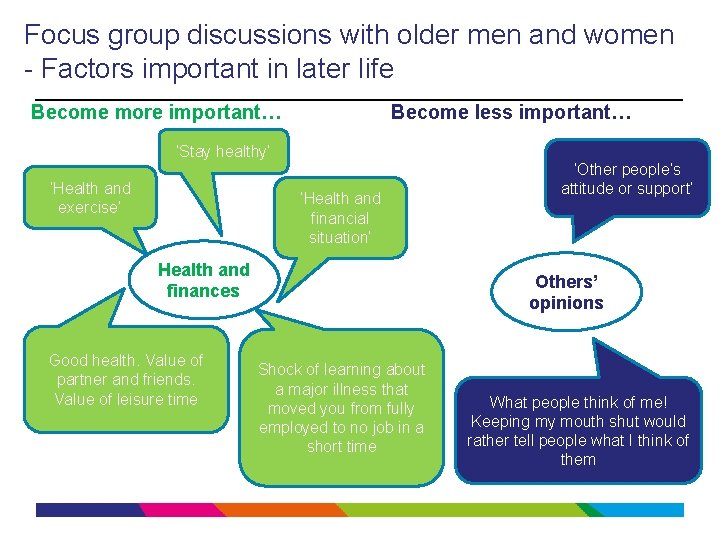
Focus group discussions with older men and women - Factors important in later life Become more important… Become less important… ‘Stay healthy’ ‘Health and exercise’ ‘Health and financial situation’ Health and finances Good health. Value of partner and friends. Value of leisure time ‘Other people’s attitude or support’ Others’ opinions Shock of learning about a major illness that moved you from fully employed to no job in a short time What people think of me! Keeping my mouth shut would rather tell people what I think of them
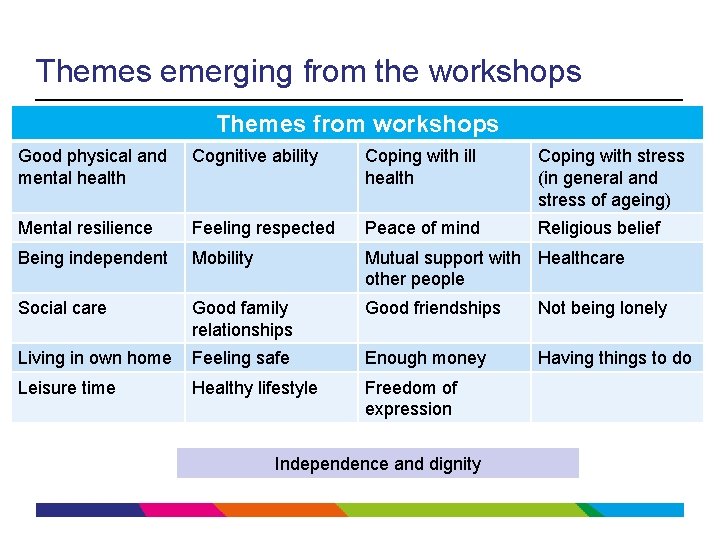
Themes emerging from the workshops Themes from workshops Good physical and mental health Cognitive ability Coping with ill health Coping with stress (in general and stress of ageing) Mental resilience Feeling respected Peace of mind Religious belief Being independent Mobility Mutual support with Healthcare other people Social care Good family relationships Good friendships Not being lonely Living in own home Feeling safe Enough money Having things to do Leisure time Healthy lifestyle Freedom of expression Independence and dignity
Step 3: Modelling wellbeing: Structural Equation Model ü Wellbeing is a latent ‘unobserved’ variable ü It is defined by circa 40 variables (our hypothesis from previous two steps) ü Many of these variables are unobserved and inter-related. We then wrote up a Structural Equation Model, which offer us a `comprehensible statistical approach to testing hypotheses about relationships among observed and unobserved variables’ (Hoyle 1995; Kline 2011)
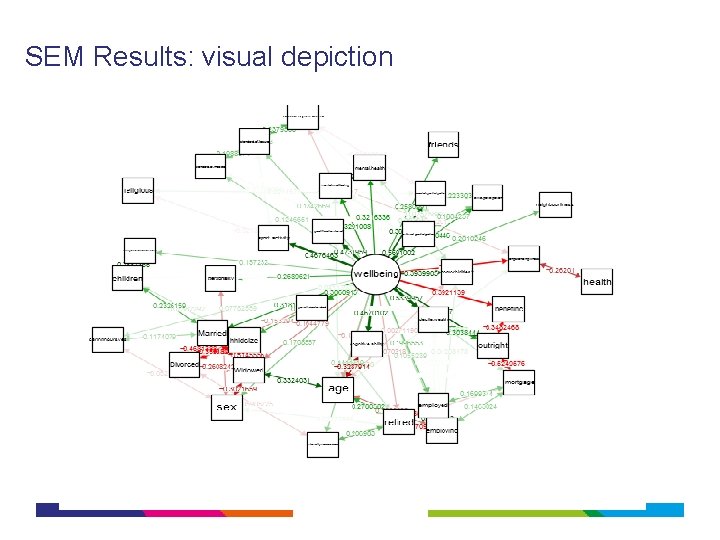
SEM Results: visual depiction
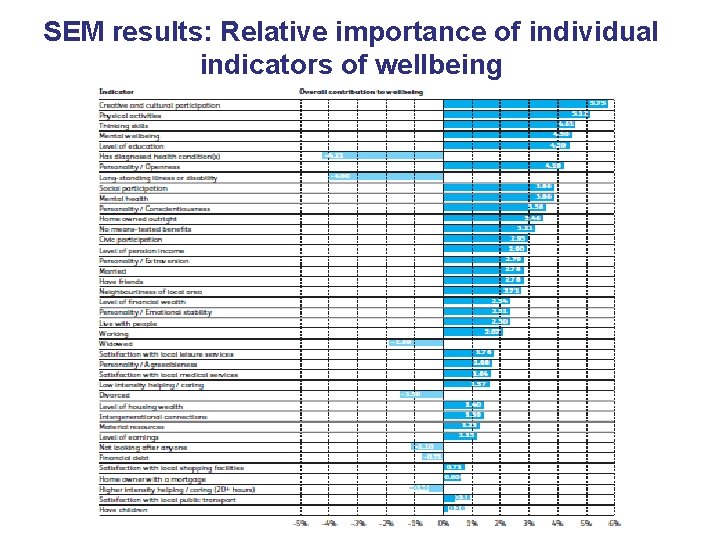
SEM results: Relative importance of individual indicators of wellbeing
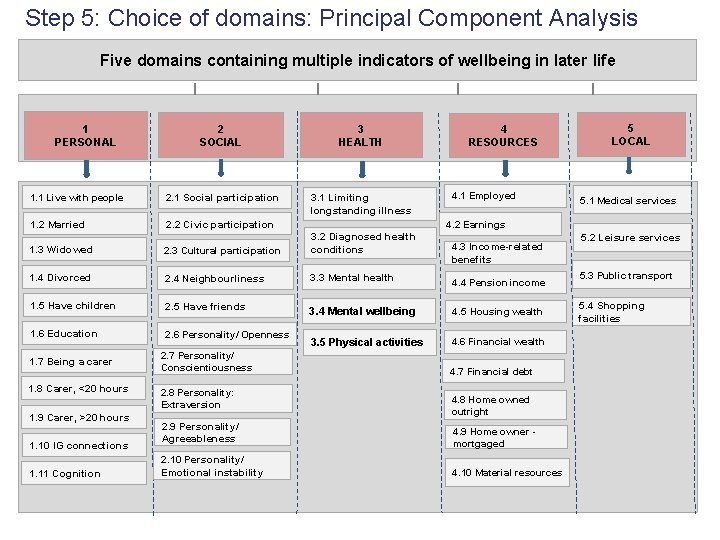
Step 5: Choice of domains: Principal Component Analysis Five domains containing multiple indicators of wellbeing in later life 2 SOCIAL 3 HEALTH 1. 1 Live with people 2. 1 Social participation 3. 1 Limiting longstanding illness 1. 2 Married 2. 2 Civic participation 1. 3 Widowed 2. 3 Cultural participation 3. 2 Diagnosed health conditions 1. 4 Divorced 2. 4 Neighbourliness 3. 3 Mental health 4. 4 Pension income 1. 5 Have children 2. 5 Have friends 3. 4 Mental wellbeing 4. 5 Housing wealth 1. 6 Education 2. 6 Personality/ Openness 3. 5 Physical activities 4. 6 Financial wealth 1 PERSONAL 1. 7 Being a carer 1. 8 Carer, <20 hours 1. 9 Carer, >20 hours 1. 10 IG connections 1. 11 Cognition 2. 7 Personality/ Conscientiousness 2. 8 Personality: Extraversion 4 RESOURCES 4. 1 Employed 5 LOCAL 5. 1 Medical services 4. 2 Earnings 4. 3 Income-related benefits 4. 7 Financial debt 4. 8 Home owned outright 2. 9 Personality/ Agreeableness 4. 9 Home owner mortgaged 2. 10 Personality/ Emotional instability 4. 10 Material resources 5. 2 Leisure services 5. 3 Public transport 5. 4 Shopping facilities
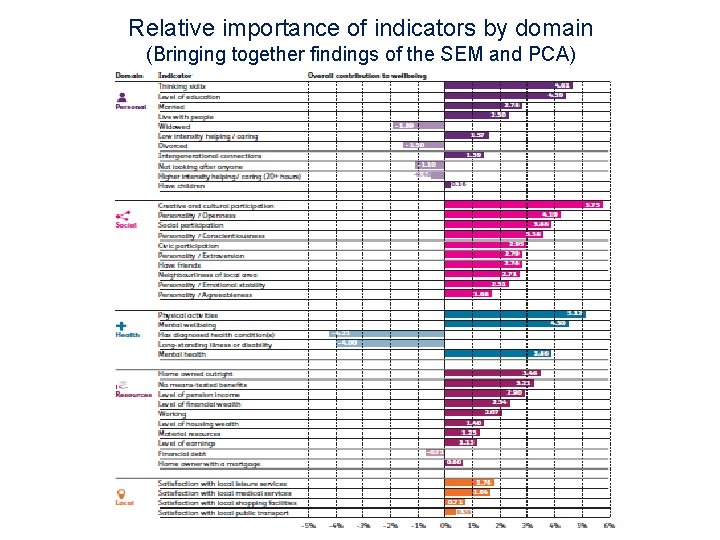
Relative importance of indicators by domain (Bringing together findings of the SEM and PCA)
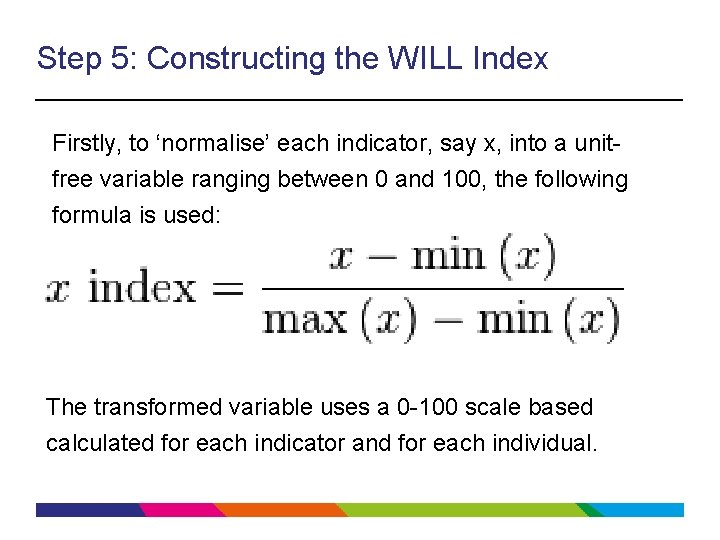
Step 5: Constructing the WILL Index Firstly, to ‘normalise’ each indicator, say x, into a unitfree variable ranging between 0 and 100, the following formula is used: The transformed variable uses a 0 -100 scale based calculated for each indicator and for each individual.
Step 5 Constructing the WILL Index Ø Next, all normalised indicators selected for each domain are aggregated, into domain-specific indices. Ø Finally, all domain-specific indices are further aggregated into one overall index.
Part 3 Key findings
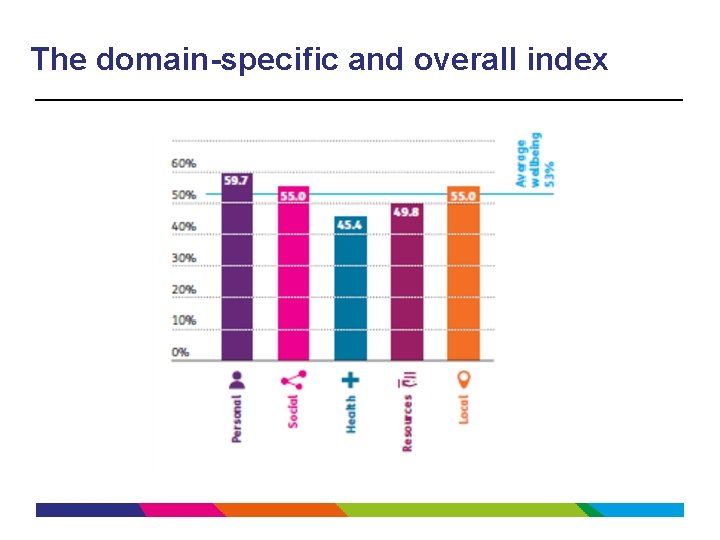
The domain-specific and overall index

Group- and domain-specific wellbeing score of WILL Index Overall Personal Social Health Resources Local 53. 2 59. 7 55. 0 45. 4 49. 8 55. 0 Men Women 54. 0 52. 1 61. 5 58. 2 55. 0 55. 1 46. 8 44. 3 51. 6 48. 3 55. 6 54. 4 age 60 -64 age 65 -69 age 70 -79 age 80+ 55. 1 55. 8 53. 4 47. 3 67. 1 65. 6 59. 6 48. 4 55. 1 56. 4 55. 9 51. 6 48. 0 49. 2 45. 5 38. 1 49. 6 51. 4 50. 4 47. 1 54. 4 53. 7 55. 8 55. 7 Total
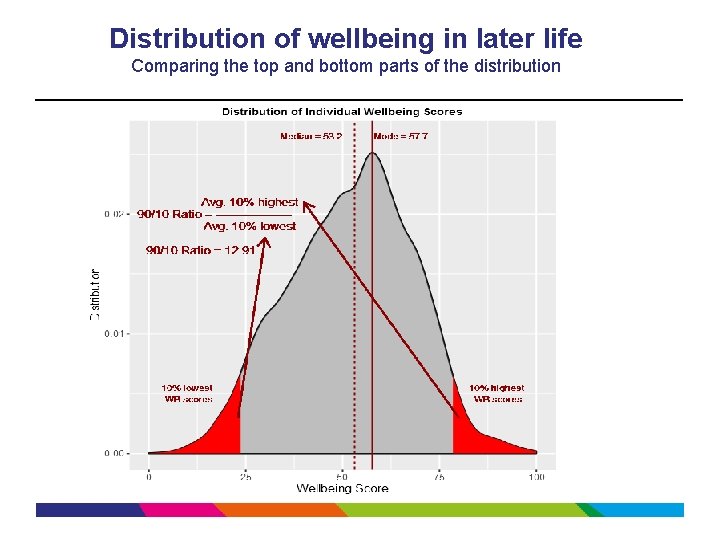
Distribution of wellbeing in later life Comparing the top and bottom parts of the distribution
Inequality in wellbeing in later life Summarising findings Just managing/ struggling: Those who are in the bottom fifth of the wellbeing score are referred to as ‘just managing or struggling’; here we can point to those attributes that can be avoided to improve wellbeing in later life. DOING WELL: Those who are in the top fifth of the wellbeing score are referred to as ‘doing well’; here we can point to those attributes that be promoted to improve wellbeing in later life.
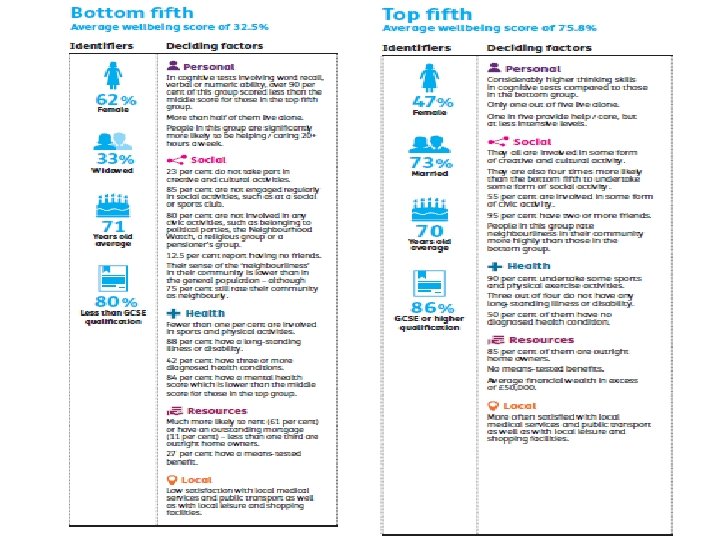
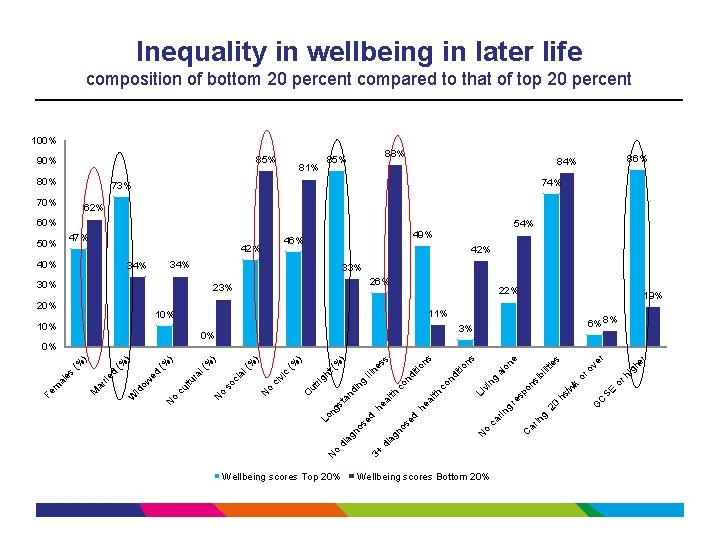
Inequality in wellbeing in later life composition of bottom 20 percent compared to that of top 20 percent 100% 85% 90% 88% 85% 81% 74% 73% 70% 62% 60% 50% 86% 84% 47% 46% 42% 40% 42% 34% 33% 30% 26% 23% 20% 22% 19% 11% 10% 54% 49% 6% 8% 3% 0% er er hi gh ov or SE C hs 20 g in ar C G /w k on si sp re g rin ca o N Wellbeing scores Bottom 20% or bi al ng vi Li he d no se 3+ di ag lit ie s on e ns co al th he d no se ag di tio nd co in an d ng st Lo N o Wellbeing scores Top 20% nd i iti ne s Ill g rig ut O on s s ) (% ht c vi ci o N so ci al (% (% ) ) ) % N o ) cu ltu ra l( (% o ow id W N ed (% d rie M ar Fe m al e s (% ) ) 0%

Part 4 Conclusions/ What next?
Conclusions • Wellbeing of older people is influenced by a wide range of factors affecting a person’s life, so we should think quite broadly when deciding how we can improve wellbeing in later life. • Policy insights can be drawn by reviewing malleable attributes of older people and their communities to be influenced by public policies and local level programmes, (such as ensuring there is ample opportunity for people to participate in various kinds of social, cultural, and physical activities, and raising awareness about the benefits of these activities). • Other attributes of older people can serve as identifiers for targeting (say by service providers), as they are not easily changed (if at all), such as marital status/ living arrangements.
What next? There are multiple uses of Age UK’s Index of Wellbeing in Later Life. • To start with, it helps us identify high risk groups and highlight policies and programmes and individual behaviours to change, and it can serve the local Age UK offices. • It will help us monitor changes in the lives of older people in the country and facilitate evaluation of success of certain policy instruments. • The tool can be further developed for ex-ante evaluation of alternative policy packages to the goal of improving wellbeing in later life.
For further information, contact: Marcus Green, Age UK Marcus. Green@ageuk. org. uk José Iparraguirre, Age UK jose. iparraguirre@ageuk. org. uk Asghar Zaidi Southampton University and London School of Economics asghar. zaidi@soton. ac. uk
- Slides: 34