
Confidence Intervals The Basics LEARNING TARGETS By the
Confidence Intervals: The Basics LEARNING TARGETS By the end of this section, you should be able to: ü IDENTIFY an appropriate point estimator and CALCULATE the value of a point estimate. ü INTERPRET a confidence interval in context. ü DETERMINE the point estimate and margin of error from a confidence interval. ü USE a confidence interval to MAKE a decision about the value of a parameter. ü INTERPRET a confidence level in context. ü DESCRIBE how the sample size and confidence level affect the margin of error. ü EXPLAIN how practical issues like nonresponse, undercoverage, and response bias can affect the interpretation of a confidence interval. Starnes/Tabor, The Practice of Statistics
Point Estimators A point estimator is a statistic that provides an estimate of a population parameter. The value of that statistic from a sample is called a point estimate. Starnes/Tabor, The Practice of Statistics
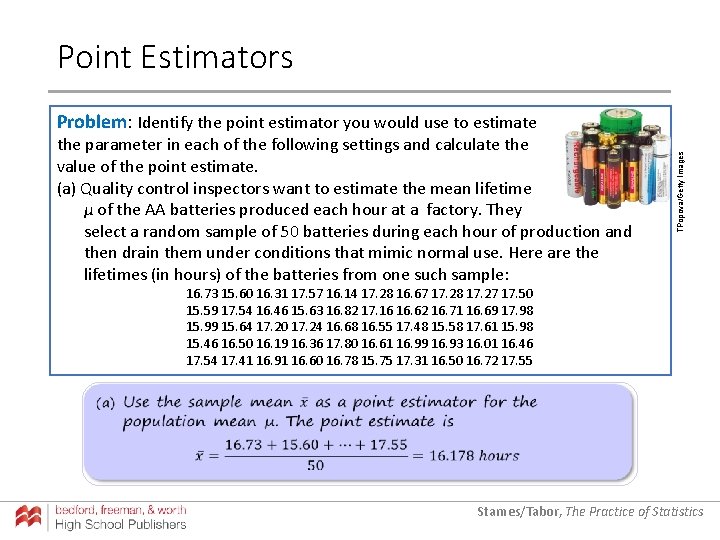
Point Estimators the parameter in each of the following settings and calculate the value of the point estimate. (a) Quality control inspectors want to estimate the mean lifetime µ of the AA batteries produced each hour at a factory. They select a random sample of 50 batteries during each hour of production and then drain them under conditions that mimic normal use. Here are the lifetimes (in hours) of the batteries from one such sample: TPopova/Getty Images Problem: Identify the point estimator you would use to estimate 16. 73 15. 60 16. 31 17. 57 16. 14 17. 28 16. 67 17. 28 17. 27 17. 50 15. 59 17. 54 16. 46 15. 63 16. 82 17. 16 16. 62 16. 71 16. 69 17. 98 15. 99 15. 64 17. 20 17. 24 16. 68 16. 55 17. 48 15. 58 17. 61 15. 98 15. 46 16. 50 16. 19 16. 36 17. 80 16. 61 16. 99 16. 93 16. 01 16. 46 17. 54 17. 41 16. 91 16. 60 16. 78 15. 75 17. 31 16. 50 16. 72 17. 55 Starnes/Tabor, The Practice of Statistics
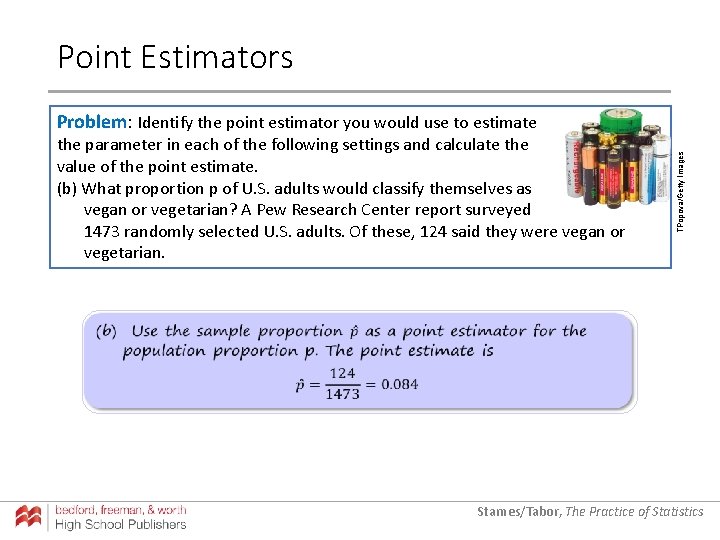
Point Estimators the parameter in each of the following settings and calculate the value of the point estimate. (b) What proportion p of U. S. adults would classify themselves as vegan or vegetarian? A Pew Research Center report surveyed 1473 randomly selected U. S. adults. Of these, 124 said they were vegan or vegetarian. TPopova/Getty Images Problem: Identify the point estimator you would use to estimate Starnes/Tabor, The Practice of Statistics
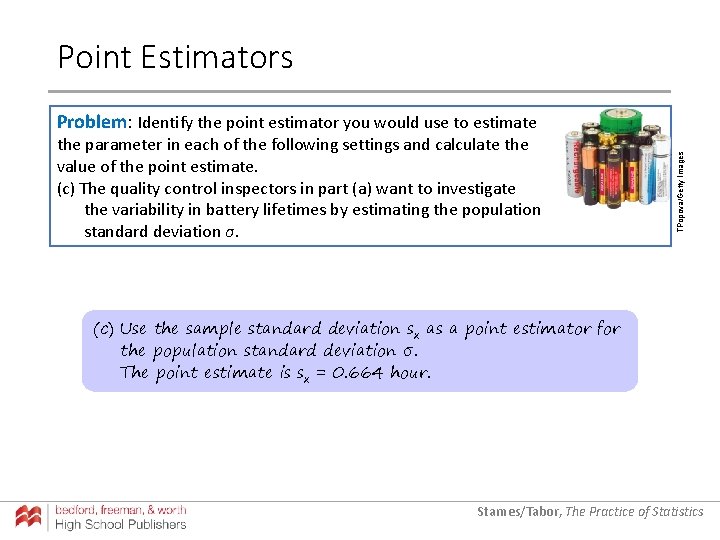
Point Estimators the parameter in each of the following settings and calculate the value of the point estimate. (c) The quality control inspectors in part (a) want to investigate the variability in battery lifetimes by estimating the population standard deviation σ. TPopova/Getty Images Problem: Identify the point estimator you would use to estimate (c) Use the sample standard deviation sx as a point estimator for the population standard deviation σ. The point estimate is sx = 0. 664 hour. Starnes/Tabor, The Practice of Statistics
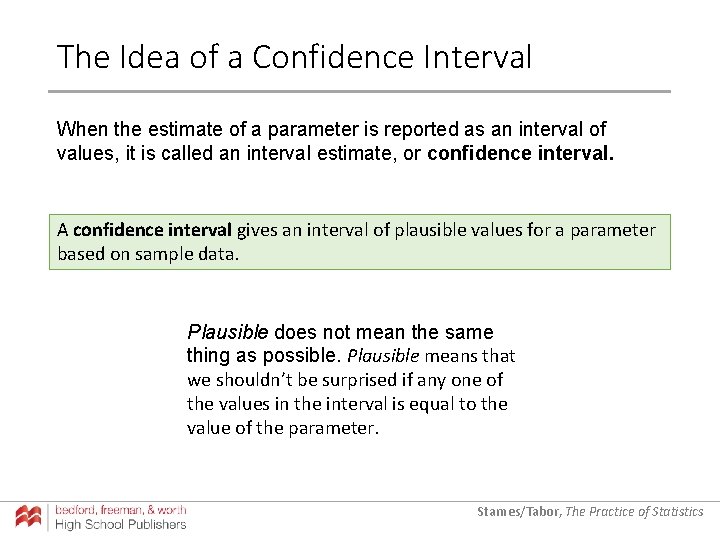
The Idea of a Confidence Interval When the estimate of a parameter is reported as an interval of values, it is called an interval estimate, or confidence interval. A confidence interval gives an interval of plausible values for a parameter based on sample data. Plausible does not mean the same thing as possible. Plausible means that we shouldn’t be surprised if any one of the values in the interval is equal to the value of the parameter. Starnes/Tabor, The Practice of Statistics
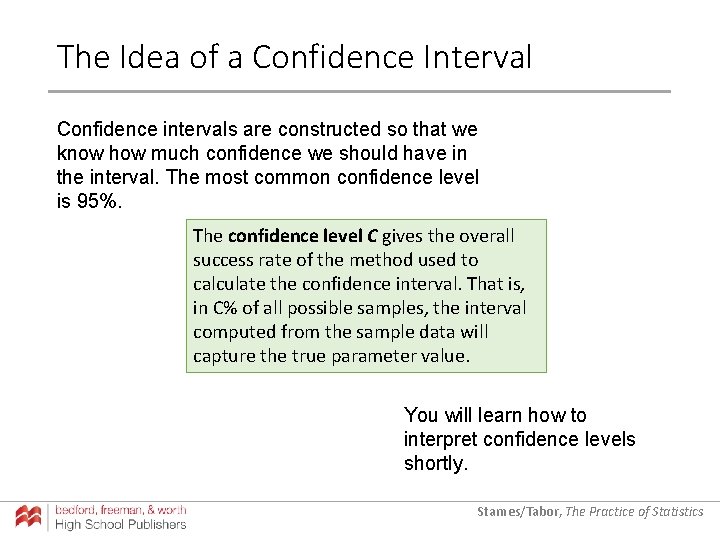
The Idea of a Confidence Interval Confidence intervals are constructed so that we know how much confidence we should have in the interval. The most common confidence level is 95%. The confidence level C gives the overall success rate of the method used to calculate the confidence interval. That is, in C% of all possible samples, the interval computed from the sample data will capture the true parameter value. You will learn how to interpret confidence levels shortly. Starnes/Tabor, The Practice of Statistics
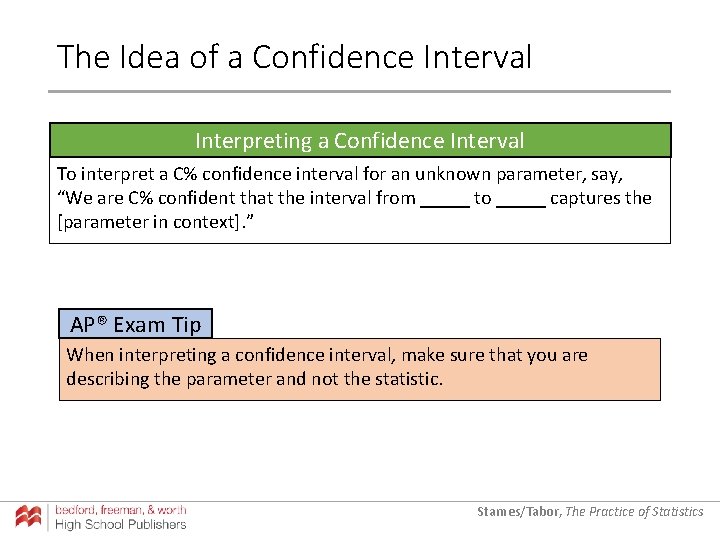
The Idea of a Confidence Interval Interpreting a Confidence Interval To interpret a C% confidence interval for an unknown parameter, say, “We are C% confident that the interval from _____ to _____ captures the [parameter in context]. ” AP® Exam Tip When interpreting a confidence interval, make sure that you are describing the parameter and not the statistic. Starnes/Tabor, The Practice of Statistics
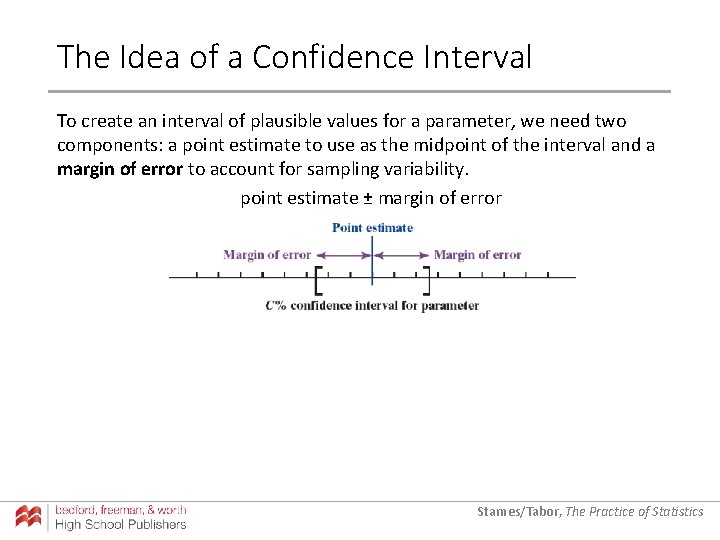
The Idea of a Confidence Interval To create an interval of plausible values for a parameter, we need two components: a point estimate to use as the midpoint of the interval and a margin of error to account for sampling variability. point estimate ± margin of error Starnes/Tabor, The Practice of Statistics
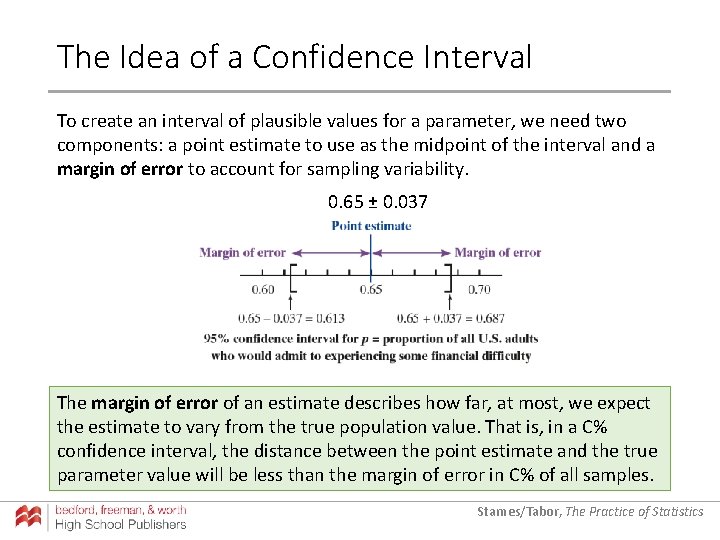
The Idea of a Confidence Interval To create an interval of plausible values for a parameter, we need two components: a point estimate to use as the midpoint of the interval and a margin of error to account for sampling variability. 0. 65 ± 0. 037 The margin of error of an estimate describes how far, at most, we expect the estimate to vary from the true population value. That is, in a C% confidence interval, the distance between the point estimate and the true parameter value will be less than the margin of error in C% of all samples. Starnes/Tabor, The Practice of Statistics
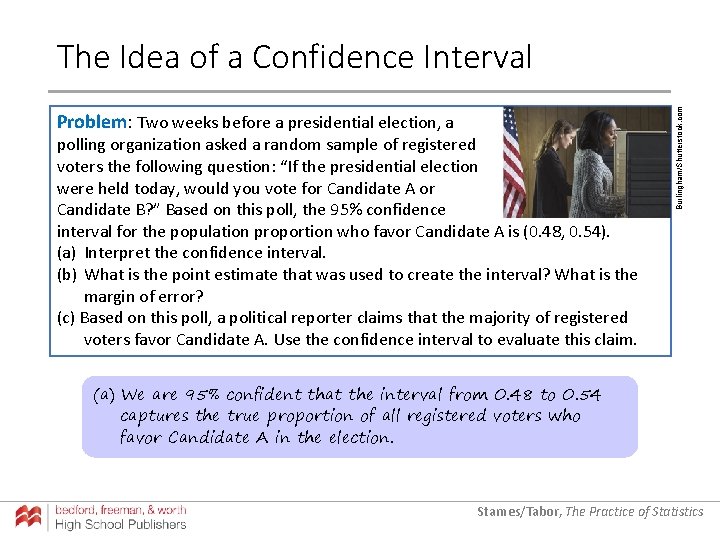
Problem: Two weeks before a presidential election, a polling organization asked a random sample of registered voters the following question: “If the presidential election were held today, would you vote for Candidate A or Candidate B? ” Based on this poll, the 95% confidence interval for the population proportion who favor Candidate A is (0. 48, 0. 54). (a) Interpret the confidence interval. (b) What is the point estimate that was used to create the interval? What is the margin of error? (c) Based on this poll, a political reporter claims that the majority of registered voters favor Candidate A. Use the confidence interval to evaluate this claim. Burlingham/Shutterstock. com The Idea of a Confidence Interval (a) We are 95% confident that the interval from 0. 48 to 0. 54 captures the true proportion of all registered voters who favor Candidate A in the election. Starnes/Tabor, The Practice of Statistics
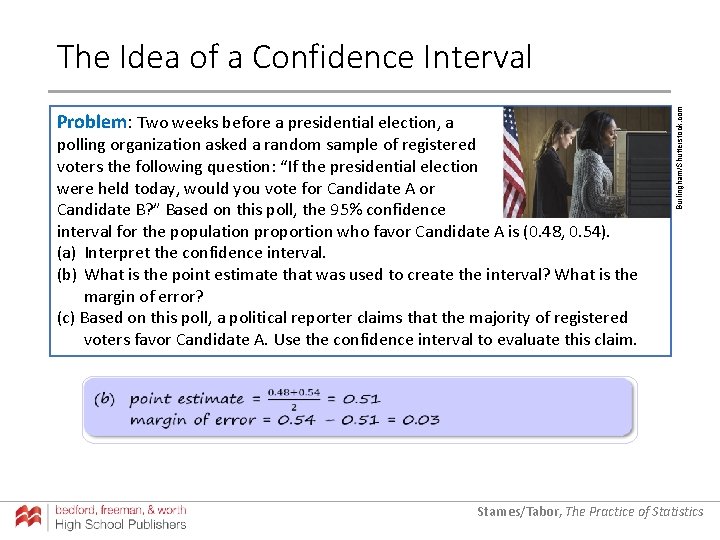
Problem: Two weeks before a presidential election, a polling organization asked a random sample of registered voters the following question: “If the presidential election were held today, would you vote for Candidate A or Candidate B? ” Based on this poll, the 95% confidence interval for the population proportion who favor Candidate A is (0. 48, 0. 54). (a) Interpret the confidence interval. (b) What is the point estimate that was used to create the interval? What is the margin of error? (c) Based on this poll, a political reporter claims that the majority of registered voters favor Candidate A. Use the confidence interval to evaluate this claim. Burlingham/Shutterstock. com The Idea of a Confidence Interval Starnes/Tabor, The Practice of Statistics
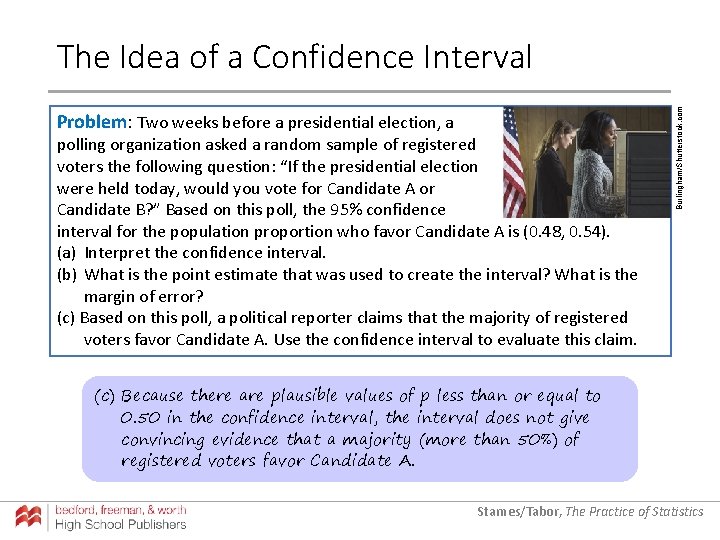
Problem: Two weeks before a presidential election, a polling organization asked a random sample of registered voters the following question: “If the presidential election were held today, would you vote for Candidate A or Candidate B? ” Based on this poll, the 95% confidence interval for the population proportion who favor Candidate A is (0. 48, 0. 54). (a) Interpret the confidence interval. (b) What is the point estimate that was used to create the interval? What is the margin of error? (c) Based on this poll, a political reporter claims that the majority of registered voters favor Candidate A. Use the confidence interval to evaluate this claim. Burlingham/Shutterstock. com The Idea of a Confidence Interval (c) Because there are plausible values of p less than or equal to 0. 50 in the confidence interval, the interval does not give convincing evidence that a majority (more than 50%) of registered voters favor Candidate A. Starnes/Tabor, The Practice of Statistics
Interpreting Confidence Level Interpreting a Confidence Interval To interpret a confidence level C, say, “If we were to select many random samples from a population and construct a C% confidence interval using each sample, about C% of the intervals would capture the [parameter in context]. ” Starnes/Tabor, The Practice of Statistics
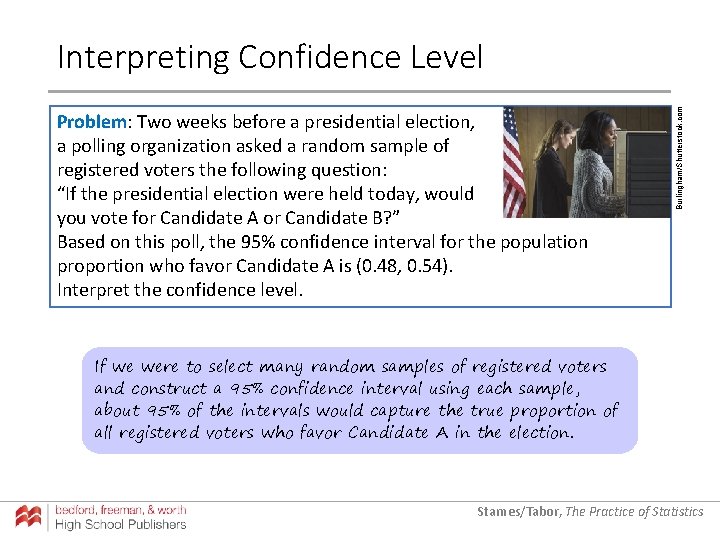
Problem: Two weeks before a presidential election, a polling organization asked a random sample of registered voters the following question: “If the presidential election were held today, would you vote for Candidate A or Candidate B? ” Based on this poll, the 95% confidence interval for the population proportion who favor Candidate A is (0. 48, 0. 54). Interpret the confidence level. Burlingham/Shutterstock. com Interpreting Confidence Level If we were to select many random samples of registered voters and construct a 95% confidence interval using each sample, about 95% of the intervals would capture the true proportion of all registered voters who favor Candidate A in the election. Starnes/Tabor, The Practice of Statistics
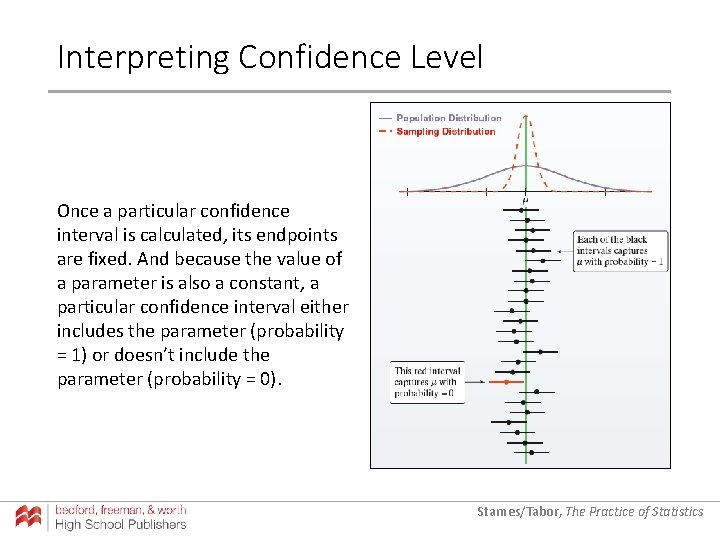
Interpreting Confidence Level Once a particular confidence interval is calculated, its endpoints are fixed. And because the value of a parameter is also a constant, a particular confidence interval either includes the parameter (probability = 1) or doesn’t include the parameter (probability = 0). Starnes/Tabor, The Practice of Statistics
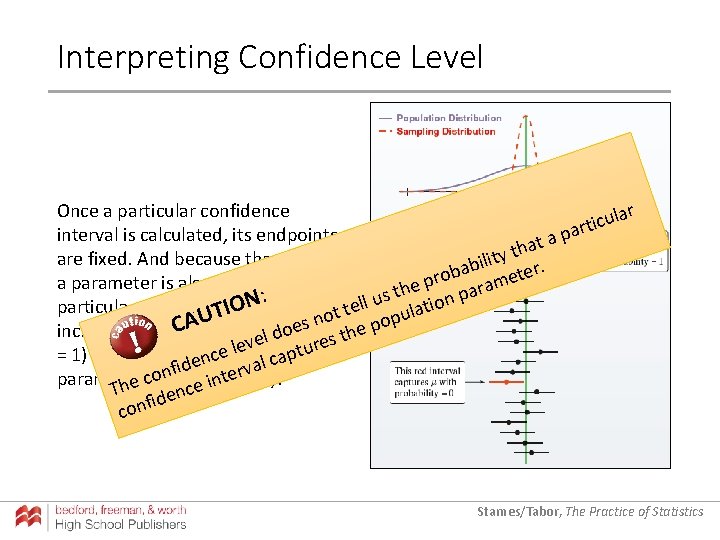
Interpreting Confidence Level Once a particular confidence lar u c i t ar p interval is calculated, its endpoints a at h t y are fixed. And because the value of ilit er. b a b pro ramet a parameter is also a constant, a e h s t ion pa : u N l l particular confidence interval either IO t te opulat T o U n p es CA e o includes the parameter (probability h d t l es ve r e l u t e = 1) or doesn’t include cap enc rthe l d a i f v on te = 0). c parameter (probability n i e e h c T en d i f con Starnes/Tabor, The Practice of Statistics
Interpreting Confidence Level AP® Exam Tip On a given problem, you may be asked to interpret the confidence interval, the confidence level, or both. Be sure you understand the difference: the confidence interval gives a set of plausible values for the parameter and the confidence level describes the overall capture rate of the method. Starnes/Tabor, The Practice of Statistics
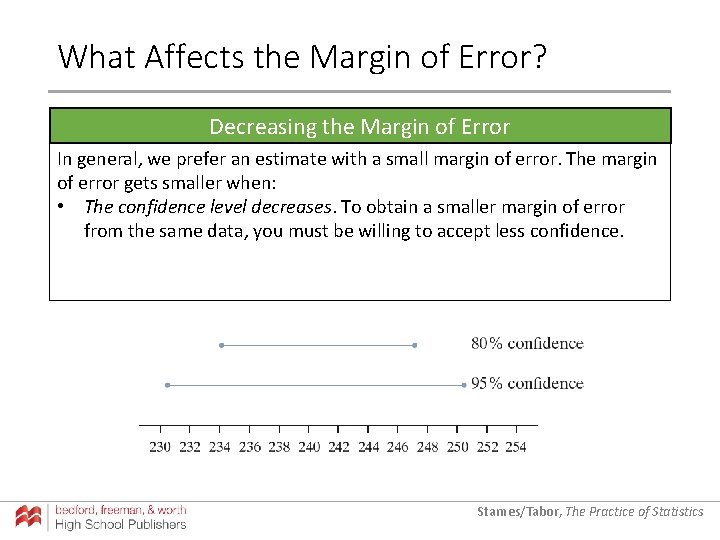
What Affects the Margin of Error? Decreasing the Margin of Error In general, we prefer an estimate with a small margin of error. The margin of error gets smaller when: • The confidence level decreases. To obtain a smaller margin of error from the same data, you must be willing to accept less confidence. Starnes/Tabor, The Practice of Statistics
What Affects the Margin of Error? Decreasing the Margin of Error In general, we prefer an estimate with a small margin of error. The margin of error gets smaller when: • The confidence level decreases. To obtain a smaller margin of error from the same data, you must be willing to accept less confidence. • The sample size n increases. In general, increasing the sample size n reduces the margin of error for any fixed confidence level. The margin of error also depends on the standard deviation of the statistic. As you learned in Chapter 7, the sampling distribution of a statistic will have a smaller standard deviation when the sample size is larger. This is why the margin of error decreases as you increase the sample size. Starnes/Tabor, The Practice of Statistics
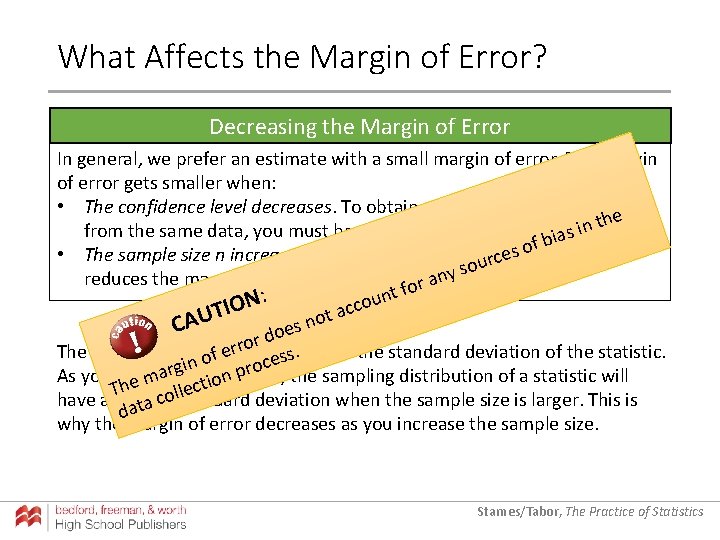
What Affects the Margin of Error? Decreasing the Margin of Error In general, we prefer an estimate with a small margin of error. The margin of error gets smaller when: • The confidence level decreases. To obtain a smaller margin of error he t n i from the same data, you must be willing to accept less confidence. ias b f o es sample • The sample size n increases. In general, increasingurthe size n c o s ny reduces the margin of error for any fixedoconfidence level. a r f t : un N o c O c I T ta U o n A C oes d r rro depends The margin of error also on the standard deviation of the statistic. e s. f s o e c n i rgin Chapter pro 7, the sampling distribution of a statistic will a As you learned n m o i he ollect T c standard deviation when the sample size is larger. This is have a smaller data why the margin of error decreases as you increase the sample size. Starnes/Tabor, The Practice of Statistics
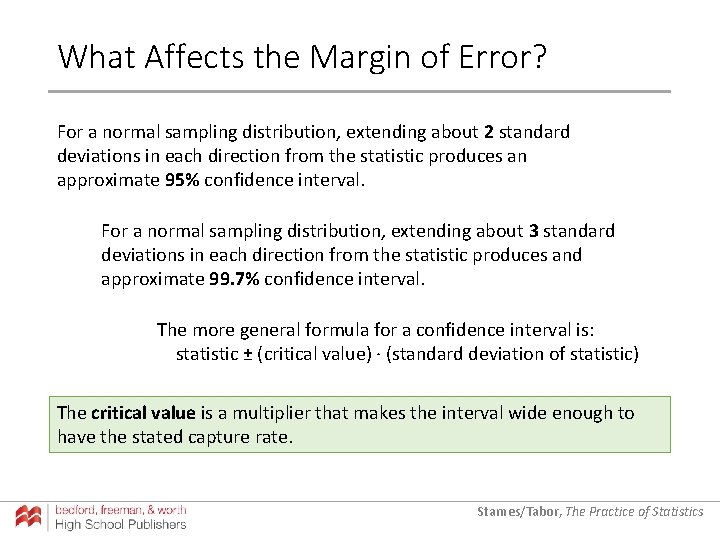
What Affects the Margin of Error? For a normal sampling distribution, extending about 2 standard deviations in each direction from the statistic produces an approximate 95% confidence interval. For a normal sampling distribution, extending about 3 standard deviations in each direction from the statistic produces and approximate 99. 7% confidence interval. The more general formula for a confidence interval is: statistic ± (critical value) · (standard deviation of statistic) The critical value is a multiplier that makes the interval wide enough to have the stated capture rate. Starnes/Tabor, The Practice of Statistics
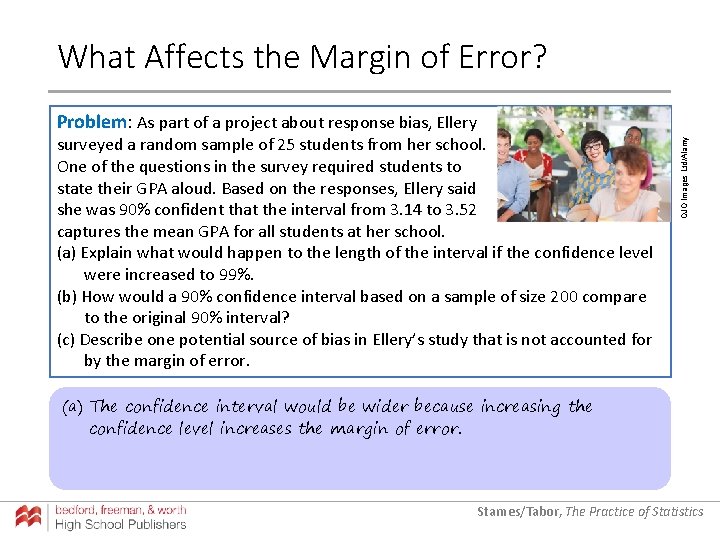
What Affects the Margin of Error? surveyed a random sample of 25 students from her school. One of the questions in the survey required students to state their GPA aloud. Based on the responses, Ellery said she was 90% confident that the interval from 3. 14 to 3. 52 captures the mean GPA for all students at her school. (a) Explain what would happen to the length of the interval if the confidence level were increased to 99%. (b) How would a 90% confidence interval based on a sample of size 200 compare to the original 90% interval? (c) Describe one potential source of bias in Ellery’s study that is not accounted for by the margin of error. OJO Images Ltd/Alamy Problem: As part of a project about response bias, Ellery (a) The confidence interval would be wider because increasing the confidence level increases the margin of error. Starnes/Tabor, The Practice of Statistics
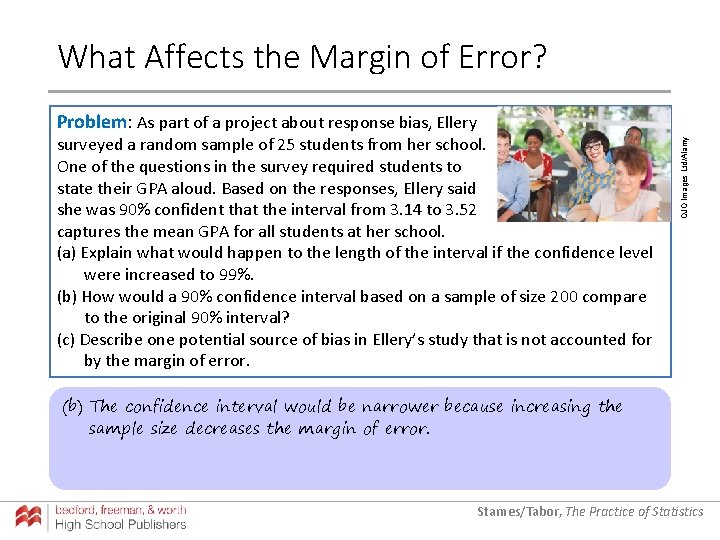
What Affects the Margin of Error? surveyed a random sample of 25 students from her school. One of the questions in the survey required students to state their GPA aloud. Based on the responses, Ellery said she was 90% confident that the interval from 3. 14 to 3. 52 captures the mean GPA for all students at her school. (a) Explain what would happen to the length of the interval if the confidence level were increased to 99%. (b) How would a 90% confidence interval based on a sample of size 200 compare to the original 90% interval? (c) Describe one potential source of bias in Ellery’s study that is not accounted for by the margin of error. OJO Images Ltd/Alamy Problem: As part of a project about response bias, Ellery (b) The confidence interval would be narrower because increasing the sample size decreases the margin of error. Starnes/Tabor, The Practice of Statistics
What Affects the Margin of Error? surveyed a random sample of 25 students from her school. One of the questions in the survey required students to state their GPA aloud. Based on the responses, Ellery said she was 90% confident that the interval from 3. 14 to 3. 52 captures the mean GPA for all students at her school. (a) Explain what would happen to the length of the interval if the confidence level were increased to 99%. (b) How would a 90% confidence interval based on a sample of size 200 compare to the original 90% interval? (c) Describe one potential source of bias in Ellery’s study that is not accounted for by the margin of error. OJO Images Ltd/Alamy Problem: As part of a project about response bias, Ellery (c) The margin of error doesn’t account for the fact that many students might lie about their GPAs when having to respond without anonymity. The mean GPA for all students might be even less than 3. 14! Starnes/Tabor, The Practice of Statistics
- Slides: 25