Confidence intervals Power Week 13 Confidence intervals How


, and search for z =")


 = 1. 11, p =. 86")


 Effect size alpha The")

 Haryana N Mean height SD height")
 Haryana N Mean weight")

: r p Expected")

.")

 • A priori Power Analysis – – – Design: 2")


 • A priori Power Analysis – Design: 1 group (dieters)")


- Slides: 47
Confidence intervals & Power Week 13
Confidence intervals How accurate is your �� estimation?
Today’s Questions Suppose you obtain 100 samples of men’s height. How accurate is your mean? Schone et al. (2014). Variation of adult heights and weights in India: State & zonewise analysis. Human Biol Rev.
The real problem: Randomness •
What you already know • This is a formula you should remember.
Why “ 1. 96”? In the z-table (page 541), and search for z = 1. 96, you will find the p =. 025 (one-tail) or p = . 05 (two-tail). “margin of error” 95% 2. 5%
What is a confidence interval A confidence interval is a range of estimate values that includes the population parameter, �� , at a specified level of confidence. A 95% level of confidence means if I sample 100 times from the same population, I would expect 95% of the time the interval will capture my population mean.
Some intuitive videos 1. Dance of the p-values https: //www. youtube. com/watch? v=5 OL 1 Rq. Hr. ZQ 8 2. http: //rpsychologist. com/d 3/CI/
Reporting CIs • Lower bound Upper bound
Good reporting practices Descriptive • Whenever you report means, always report standard deviations too. “We recruited 21 males (Mage = 18. 1; SDage = 1. 2). ” Question: • Why don’t we write the CIs for age in as well? “We recruited 21 males (17. 8 < Mage < 18. 4). ” It depends on your purpose! Do you actually need to infer a population’s age?
Good reporting practices Inferential • Whenever you report mean differences, report confidence intervals, along with all other statistics. “Men (M = 175; SD = 10) are taller than women (M = 165; SD = 10), t(18) = 2. 23, p =. 05, 1. 23 <�� difference< 18. 77. ” The interval [1. 23, 18. 77] tells you that if you obtain 100 samples, ___ % of the sample means will fall between _____. (You can also construct a confidence interval around the raw means instead of the mean difference; see next slide)
Visualizing confidence intervals We use error bars to visualize confidence intervals. 110 Performance Height (cm) 195 185 175 165 90 70 50 30 155 Men Women Jan Placebo Sep Vitamin C Common mistake: Not telling readers whether the error bars represent CIs, SDs, SEs.
What influences CIs? • You can’t do much about it. You can sample more.
Implications of CI Which sales job would you take? A. “You will earn ₹ 50000 [10000, 100000]. ” B. “You will earn ₹ 50000 [40000, 60000] A smaller CI implies greater precision. A large sample implies a smaller CI, i. e. , better estimates of the “truth” (�� )
Take home messages • p-values care only about whether something is “true” or “false” • It is good for making ordinal judgments of truth. • But it is poorly suited for estimating how “true” something is. Frick (1996). The appropriate use of null hypothesis testing. Psychological Methods.
Power The probability of rejecting a false null hypothesis.
Today’s Question How many people do you need to sample to know that the heights of men and women differ? Schone et al. (2014). Variation of adult heights and weights in India: State & zonewise analysis. Human Biol Rev.
Scenario • t(18) = 1. 11, p =. 86
Scenario • You have to reject H 0 although you know the truth that your population means differ! What’s going on? • You didn’t have enough power (“sample size”) to detect the difference, when in reality the difference exist.
Why care about power? We want to have a decent chance of obtaining significant results, if our theory is correct. The accepted convention is 80% power. If you run 5 studies, 4 will yield significant results, assuming your theory is correct.
Inferential Errors in NHST Real World Null is true Null is false Conclusion of the significance test Null is true Correct decision Type I error (false positive) Null is false Type II error (false negative) Correct decision
All of these are inter-related If you know three of them, you will know the last one. p-value Sample size (N) Effect size Alpha
What is an effect size? •
Some ways to increase power • Sample size – Add more subjects • Significance level – Adopt a less stringent p-level • Increase effect size – Use repeated measures design, more sensitive DVs, more reliable DVs
How to calculate required sample size What you want is to solve for N given all others. WARNING: You do power analysis before collecting data. p-value Sample size (N) Effect size alpha Some statistical packages give “observed power” (posthoc), which is a useless statistic. Why? It doesn’t give you new information.
How to calculate required sample size p-value Sample size (N) Effect size alpha The most difficult part of power analyses is to figure out what the effect size is – because you haven’t collected data yet! Three strategies to estimate effect size: 1. Intuition 2. Past research 3. Heuristic (d =. 50)
Introduction to G*Power for Power Analyses Download it here http: //www. gpower. hhu. de/en. html Note: Power analyses depend on the test you use Faul, F. et al. (2007). G*Power 3: A flexible statistical power analysis program for the social, behavioral, and biomedical sciences. Behavior Research Methods.
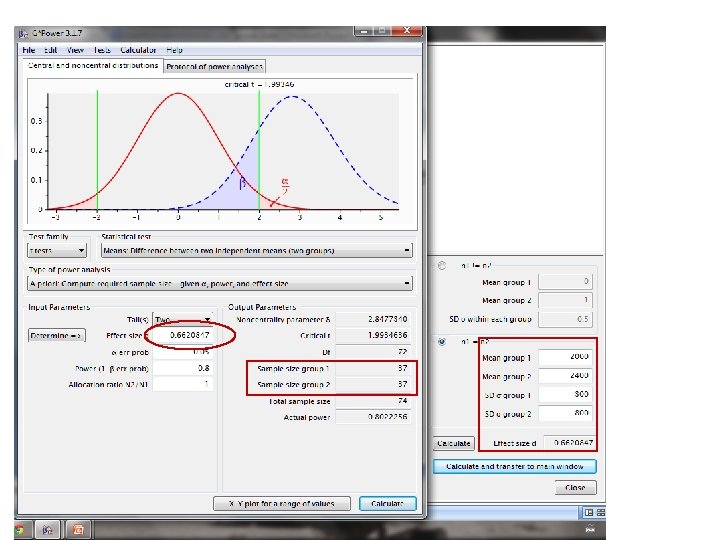
Demonstration: Independent t-test From Schone et al. (2014) Haryana N Mean height SD height Males 1010 167. 98 6. 60 Females 2748 154. 89 5. 78 d = 2. 11 How many participants do you need to find a significant difference if you run a new study? 8 Schone et al. (2014). Variation of adult heights and weights in India: State & zonewise analysis. Human Biol Rev.
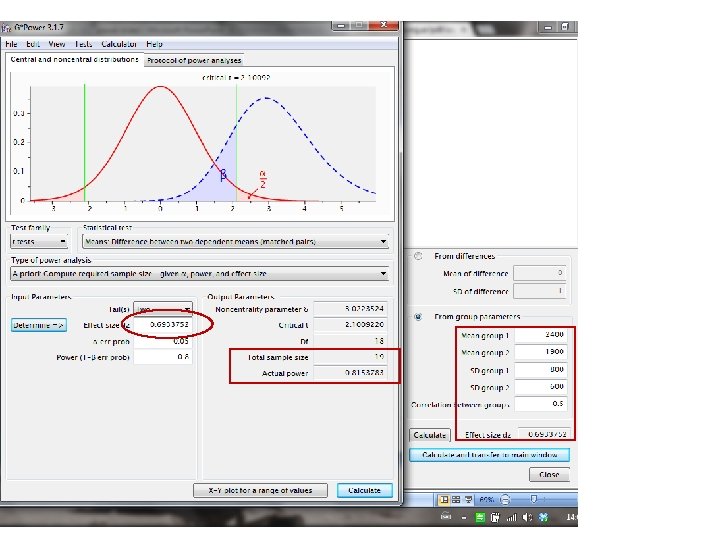
Weight differences: Try it yourself! From Schone et al. (2014) Haryana N Mean weight SD weight Males 1010 57. 87 10. 91 Females 2748 50. 37 10. 57 • How many participants do you need to find a significant difference if you run a new study? Schone et al. (2014). Variation of adult heights and weights in India: State & zonewise analysis. Human Biol Rev.
Demonstration: Dependent t-test Assume that the correlations of the scores between T 1 and T 2 are r =. 50. (Strangely many papers omit this info. ) Time 1, M (SD) Time 2, M (SD) Anxiety Depression Experimental 10. 40 (4. 98) 10. 99 (4. 92) 6. 80 (5. 62) 7. 41 (5. 91) Waitlist control 8. 76 (4. 44) 10. 50 (5. 04) 4. 53 (3. 43) 5. 69 (4. 08) For each domain, how many participants do you need to find a significant difference if you run a new study? Experimental Anxiety Depression 20 ? Titov et al. (2014). Improving adherence and clinical outcomes in self-guided internet treatment for anxiety and depression. PLo. S ONE.
Demonstration: Correlation Predictors of intelligence at age 5 (N = 1782): r p Expected N Maternal IQ . 40 <. 001 37 Parental education (years) . 30 <. 001 Maternal age . 05 . 183 Paternal age . 02 . 478 Birth weight . 08 . 028 Gestational age (days) . 08 . 015 For each variable, how many participants do you need to find a significant difference if you run a new study? Eriksen. (2013). Predictors of intelligence at the age of 5. PLo. S ONE.
Take home messages • Power analyses is useful only when planning your study (before data collection). • Proper power analyses gives your study a decent chance of success. • It is useless in archival data (e. g. , your data analysis project)
The following slides are for reference (not examinable).
Independent t-test Demonstration 1
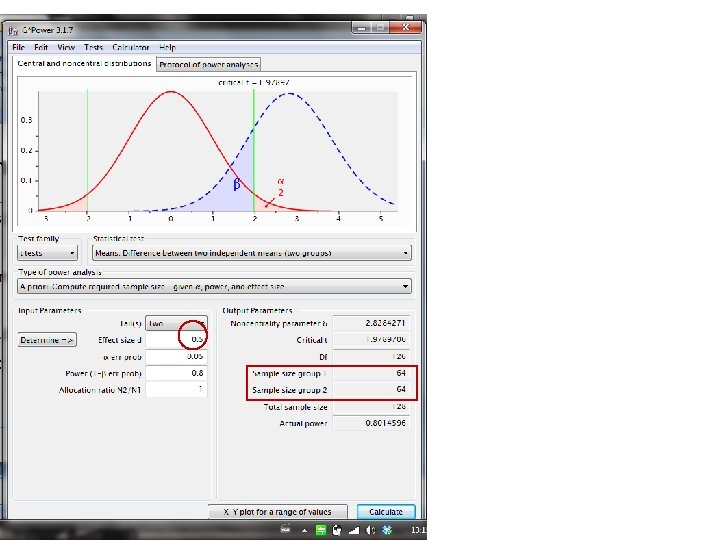
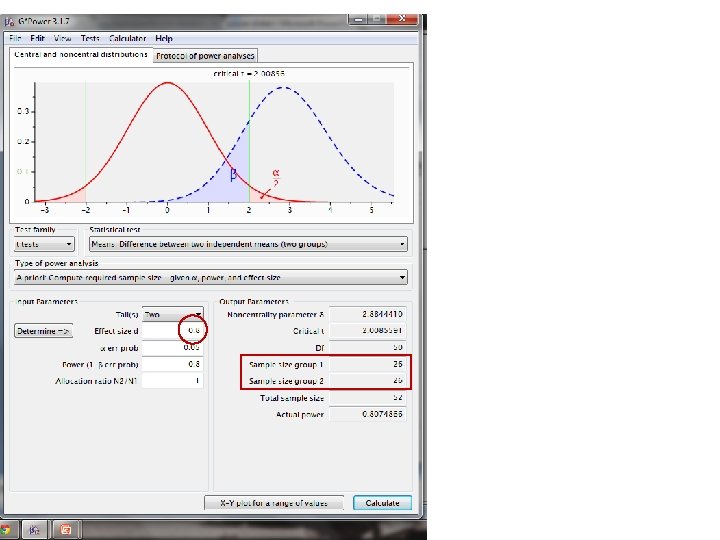
t-test (2 independent means) • A priori Power Analysis – – – Design: 2 groups (dieters vs. non-dieters) DV: daily calorie intake (kcal) Effect size (d): medium (. 5) or literature based α – level: (. 05) Power (1 – β): (. 8) Allocation ratio: 1: 1
Post-hoc
Dependent samples t-test Demonstration 2
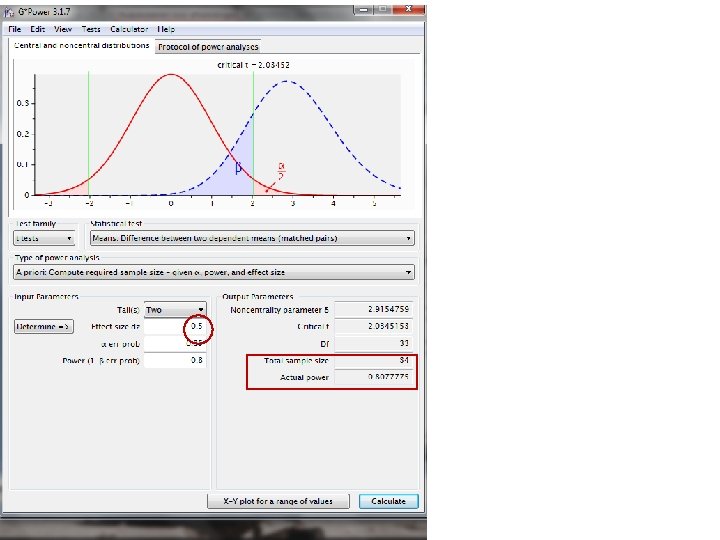
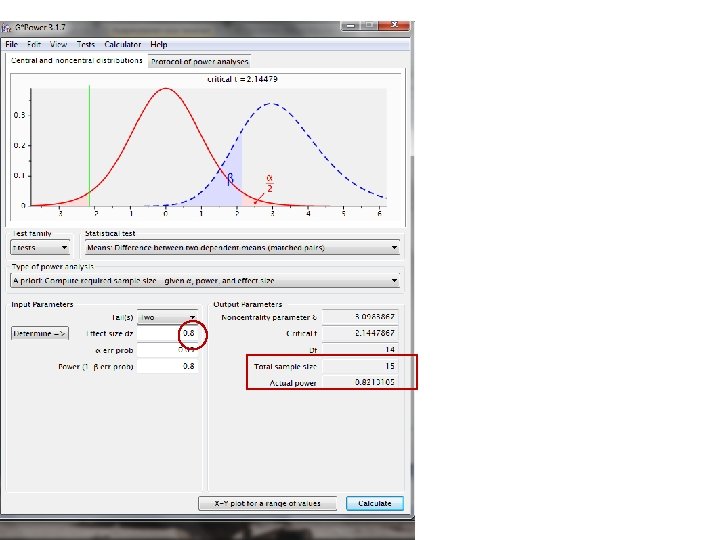
t-test (2 dependent means) • A priori Power Analysis – Design: 1 group (dieters) – DV: daily calorie intake (kcal) before intervention and after intervention – Effect size (d): medium (. 5) or literature based – α – level: (. 05) – Power (1 – β): (. 8)
Correlations Demonstration 3
Correlations • 3 possible test families – Exact Correlation: Bivariate normal model – T-test Correlation: Point biserial model – Z-test 1 Tetrachoric model & 3 Correlations: Two (in)dependent Pearson r’s
Note: 1. When n , and variables are assumed to be interval, then: Pearson’s r ≈ Spearman 1 2. H 0 is unlikely to be 0 2 1