Confidence interval A range of values so defined


: ME = critical value * standard error ME =")
- Slides: 15
Confidence interval • A range of values so defined that there is a specified probability that the value of a parameter lies within it. • Statisticians use a confidence interval to describe the amount of uncertainty associated with a sample estimate of a population parameter. • E. g. Height of population of a region • 22± 0. 02
Levels of confidence interval • 90%, 95%, 99% • Most commonly 95% used. • Suppose that a 90% confidence interval states that the population mean is greater than 100 and less than 200. How would you interpret this statement? • Some people think this means there is a 90% chance that the population mean falls between 100 and 200. This is incorrect. Like any population parameter, the population mean is a constant, not a random variable. It does not change. The probability that a constant falls within any given range is always 0. 00 or 0. 05.
Example of random variable H H 2 nd T Coin 1 st H T 2 nd T
Confidence Interval Data Requirements To express a confidence interval, you need three pieces of information. Confidence level Statistic Margin of error
A confidence level refers to the percentage of all possible samples that can be expected to include the true population parameter. For example, suppose all possible samples were selected from the same population, and a confidence interval were computed for each sample. A 95% confidence level implies that 95% of the confidence intervals would include the true population parameter.
How to Construct a Confidence Interval There are four steps to constructing a confidence interval. 1. Identify a sample statistic. Choose the statistic (e. g, sample mean, sample proportion) that you will use to estimate a population parameter. 2. Select a confidence level. As we noted in the previous section, the confidence level describes the uncertainty of a sampling method. Often, researchers choose 90%, 95%, or 99% confidence levels; but any percentage can be used. 3. Find the margin of error. If you are working on a homework problem or a test question, the margin of error may be given. Often, however, you will need to compute the margin of error, based on one of the following equations. 4. Margin of error
• The margin of error expresses the maximum expected difference between the true population parameter and a sample estimate of that parameter. • Margin of error = Critical value * Standard error of statistic • The standard deviation, or SD, measures the amount of variability or dispersion for a subject set of data from the mean, while the standard error of the mean, or SEM, measures how far the sample mean of the data is likely to be from the true population mean. • Critical value: The critical value is a factor used to compute the margin of error.
• Confidence interval = sample statistic + Margin of error • Suppose we want to estimate the average weight of an adult male in Dekalb County, Georgia. We draw a random sample of 1, 000 men from a population of 1, 000 men and weigh them. We find that the average man in our sample weighs 180 pounds, and the standard deviation of the sample is 30 pounds. What is the 95% confidence interval?
Identify a sample statistic. Since we are trying to estimate the mean weight in the population, we choose the mean weight in our sample (180) as the sample statistic. Select a confidence level. In this case, the confidence level is defined for us in the problem. We are working with a 95% confidence level. Find the margin of error. Previously, we described how to compute the margin of error. The key steps are shown below. Find standard error. The standard error (SE) of the mean is: SE = s / sqrt( n ) SE = 30 / sqrt(1000) = 30/31. 62 = 0. 95
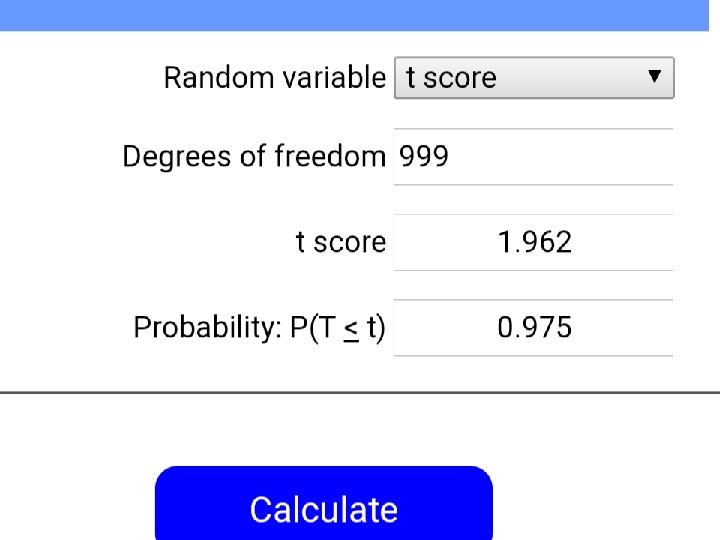
Find critical value. The critical value is a factor used to compute the margin of error. To express the critical value, follow these steps. • Compute alpha (α): α = 1 - (confidence level / 100) = 0. 05 Alpha is usually expressed as a proportion. Thus, if the confidence level is 95%, then alpha would equal 1 - 0. 95 or 0. 05. With respect to hypothesis tests , alpha refers to significance level • Find the critical probability (p*): p* = 1 - α/2 = 1 - 0. 05/2 = 0. 975 • Find the degrees of freedom (df): df = n - 1 = 1000 - 1 = 999
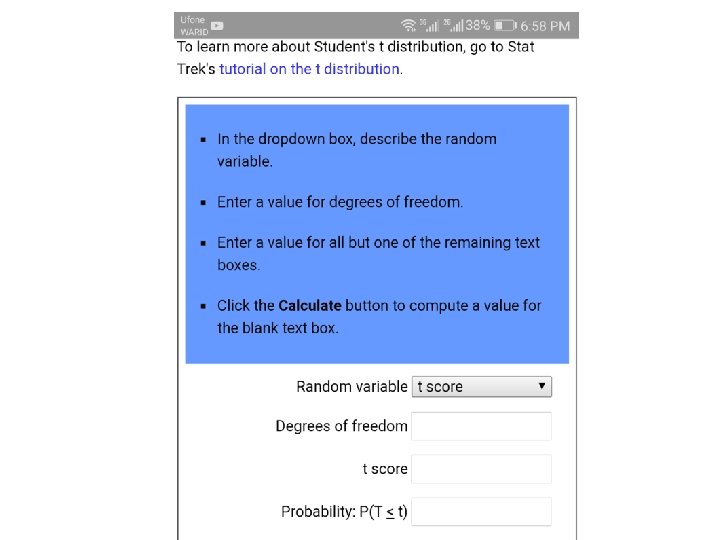
The critical value is the t statistic having 999 degrees of freedom and a cumulative probability equal to 0. 975. From the t Distribution Calculator, we find that the critical value is 1. 96.
Compute margin of error (ME): ME = critical value * standard error ME = 1. 96 * 0. 95 = 1. 86 • Specify the confidence interval. The range of the confidence interval is defined by the sample statistic +margin of error. And the uncertainty is denoted by the confidence level. Therefore, this 95% confidence interval is 180 + 1. 86.