Conference Flexible Mechanisms for an Efficient Climate Policy

Conference “Flexible Mechanisms for an Efficient Climate Policy”, Stuttgart, Germany, July 28, 1999 Project-based instruments: economic consequences of the Kyoto and Buenos Aires framework and options for future development Axel Michaelowa Hamburg Institute for Economic Research, Germany michaelo@easynet. fr

Functioning of the CDM

CDM enhances industrial country emission budgets JI CDM Country 2 Country 1 Kyoto commitment

Differences CDM-JI - CDM credits from 2000, JI credits from 2008. - JI credits subtracted from host country emission budget - JI credits “supplemental”; CDM credits cover “part” of the emission target. - JI credits freely tradable; unclear for CDM credits - JI credits from sequestration; unclear for the CDM - Only CDM projects pay adaptation tax/administration fee - CDM credits need independent certification; unclear for JI - No JI credits if investor country does not meet reporting requirements; no such rule for CDM credits - JI credits frozen if compliance is in doubt - Institutional structure of CDM
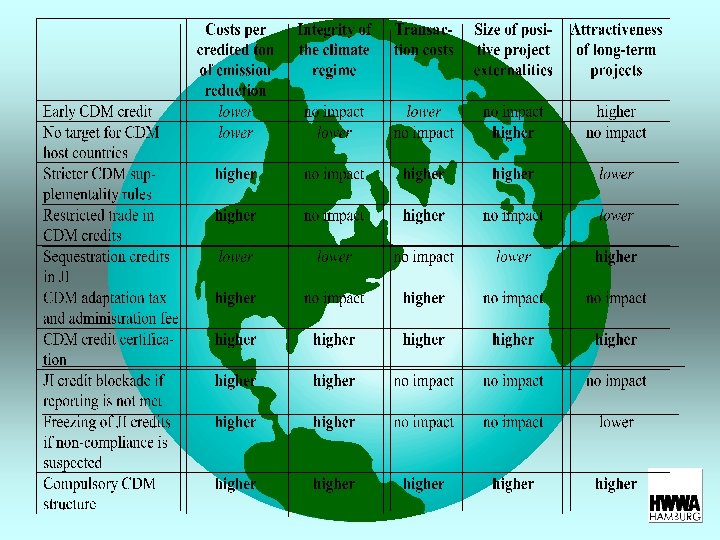

Advantages for JI Lower verification and certification costs Lower need for capacity building No adaptation tax Lower institutional costs Sink projects Advantages for CDM Early crediting Bigger supply of low-cost projects

Estimates for the potential of the CDM

Effects of ceilings on CDM and JI Unclear allocation rules • First come - first serve • Proportional discounting • Discretionary allocation Project-oriented mechanisms disadvantaged as credits accrue only ex-post

Institutional design of the CDM • Multilateral fund – Spread of project risks – Reduction of transaction costs – Bureaucratic inefficiencies? • International clearinghouse – Tender of projects – Reduction of transaction costs – No minimum price! • Project exchange – Collection of information on proposals

Baseline setting Environmental effectiveness Economic efficiency Critical parameters • Economic additionality • Leakage • Lifetime

Economic viability of the project Costs Possible cutoff points Project overall costs Number of projects 0 C B C: only accept projects with positive costs B: accept projects above a negative cost threshold due to A barrier removal or alternative rates A: accept all projects that reduce emissions compared of return to status quo

Lifetime of the baseline Regular revision Surprise Economic lifetime Technical lifetime Project start Time

Simplified approaches • • • Top-down baselines Benchmarks Technology matrix Default project type matrix Project baseline standardization All need strong capacity building in host countries

Spatial benchmarks g CO 2 per k. Wh electricity Global average Texas average U. S. average Regional average Can be used at any degree of spatial aggregation Criteria how to decide on this degree remain to be defined

Time dimension of benchmarks Historical average Past Average of equipment installed during last 5 years now Projected average of equipment installed in next 5 years Future Simplification: calculate Autonomous GHG Efficiency Improvement (AGEI)

Competing baseline approaches or a common framework? „Optimal“ baselines will depend on situation and project type: • forestry, infrastructure, policies, large number of projects in all sectors: highly aggregated benchmarks, top-down • large projects, many projects in a specific sector, fuel substitution: sector-specific, technology or default matrix • small projects such as renewables, retrofits, small number of projects: project-related, technology or default matrix Test different approaches!

Issues for future development of CDM and JI • Alignment of the mechanisms – Adaptation tax on all transfers of permits – Early JI, coupled with “hot air” reduction • Development of models for and decisions on CDM institutions • Development of and decisions on baseline methodologies
- Slides: 17