CONDUCTING MARKETING RESEARCH Chapter Four CONDUCTING MARKETING RESEARCH


- Slides: 22
CONDUCTING MARKETING RESEARCH Chapter Four
CONDUCTING MARKETING RESEARCH & FORECASTING DEMAND §In this Chapter we will address the following questions: §What constitutes good marketing Research? §What are the best metrics for measuring marketing productivity? §How can marketers assess their return on investment of marketing expenditure?
WHAT IS MARKETING RESEARCH? What is Marketing Research? ? §Marketing research is a systematic design, collection, analysis, and reporting of data and findings relevant to a specific marking situation facing the company. §At the end of 2013, global market research revenue totaled $40. 29 billion. §From 2010 -2013, the industry grew at an average of 8. 77% per year, suggesting that the current industry size is just under $45 billion. * §Companies normally budget marketing research at 1 to 2% of company sales.
MARKETING RESEARCH FIRMS TYPES Syndicated-service research firms: Specialty-line marketing research firms: These firms gather consumer and trade information, which they sell for a fee. These firms provide specialized research services. The best example is the fieldservice firm, which sells field interviewing services to other firms. Custom marketing research firms: These firms are hired to carry out specific projects, they design the study and report the findings.
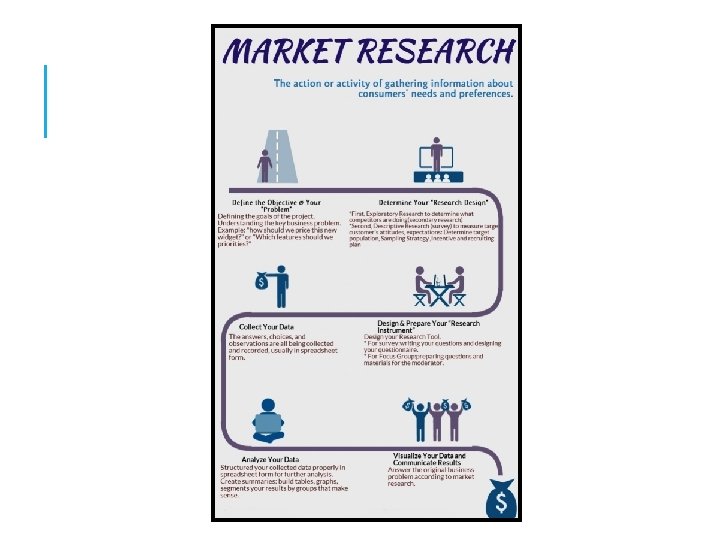
THE MARKETING RESEARCH PROCESS STEPS §Designing a research plan, it includes: decisions on the data sources, research approaches, research instruments, sampling plan, and contact methods. Data Sources The Marketing Research Process Steps: §Step 1: Define the Problem, Problem the decision Alternatives, and the research Objectives. §Step 2: Develop the Research Plan (The Approach) §Developing the most efficient plan for gathering the needed information. §Knowing the cost of the research plan before final approval is an essential step. §Data sources involves secondary data, primary data, or both §Secondary data are data that were collected for another purpose and already exist somewhere. §Primary data are data freshly gathered for a specific purpose or for a specific research project.
RESEARCH APPROACHES Primary data can be collected in six main ways: §Observational research §Ethnographic research (based on social science studies). §Focus Groups research §Survey research §Behavioral data research §Experimental research
Questionnaires RESEARCH INSTRUMENTS §Marketing researchers have a choice of three main research instruments in collecting primary data, they are as follows: Qualitative Measures Technological Devices
QUALITATIVE MEASURES ØSome times consumer actions do not match their answers to survey questions. §Projective techniques (giving people an incomplete puzzle and ask them to complete it). §Qualitative research techniques are: §Visualization (asking people to create a combination from magazine photos to describe their perceptions). § Relatively unstructured measurement approaches that permit a range of possible responses. Qualitative Research Tools & Steps §Word associations (what words come to mind when a brand name is mentioned). §Brand personification (what kind of person they think of when a brand name is mentioned) §Laddering (a serious of WHY questions can reveal more and deep about consumer motivations)
STEP 3: COLLECTING DATA §This stage generally the most expensive and the most prone to error. §In the case of surveys, four major problems usually arise: §Some respondents will not be available where they should be, and must be contacted again or replaced. §Other respondents will refuse to cooperate. §Others will give biased or dishonest answers. §Some interviewers will be biased or dishonest. § Getting the right respondents is critical
STEP 4: SAMPLING PLAN After deciding on the research approach and instruments, sampling plan has to be designed. at this stage three decisions must be taken: Sampling unit: unit Who should be survey? Sample size: size How many people should be surveyed? Sampling procedure: procedure How should the respondents be chosen?
SAMPLING TECHNIQUES Simple random sample A. Probability Sample: Stratified random sample A probability sampling method is any method of sampling that utilizes some form of random selection. In order to have a random selection method, you must set up some process or procedure that assures that the different units in your population have equal probabilities of being chosen. Every member of the population has an equal chance of selection. The population is divided into mutually exclusive groups (such as age groups), and random samples are drawn from each group. Cluster (area) sample The population is divided into mutually exclusive groups (such as city blocks), and the researcher draws a sample of the groups to interview.
Judgment sample SAMPLING TECHNIQUES B. Non-probability Sample A core characteristic of nonprobability sampling techniques is that samples are selected based on the subjective judgment of the researcher, rather than random selection. Convenience sample The researcher selects the most accessible population members. The researcher selects population members who are good prospects for accurate information. Quota sample The researcher finds and interviews a prescribed number of people in each of several categories. Contact Methods Mail questionnaire. Telephone interview. Personal interview. Online interview.
STEP 5: ANALYSE INFORMATION §At this stage findings are extracted from the collected data. §The researcher arranged data in tables. §Averages and measures are computed for the major variables. §Using statistical techniques and decision models to discover any additional findings.
STEP 6: PRESENT FIDINGS Findings that are relevant to the major marketing decisions should be presented to the management. Usually researchers are being asked to play a more proactive, consulting role in translating data and information into insights and recommendations.
STEP 7: MAKING DECISIONS §The managers who commissioned the research need to weigh the evidence. §If their confidence in the findings is low, they may decide against introducing the study. §If they are relieved of launching the study, the findings should support this decision. Research Findings Evaluation High Confidence Low Confidence Findings to be Submitted to Mgt. Study not to be Submitted to Mgt. New or Additional Researches
MARKETING METRICS Marketing metrics are set of measures that helps firms to quantify, compare, and interpret their marketing performance. They are used to design marketing programs and senior management to decide on financial allocations When marketers can estimate the dollar contribution of marketing activities, they are better able to justify the marketing investments to senior management.
SAMPLE MARKETING METRICS 1. External 2. Internal Awareness of goals Market share (volume or value) Commitment to goals Relative price (market share value/volume) Active innovation support Number of complaints (level of dissatisfaction) Resource adequacy Consumer satisfaction Staffing / skill levels Distribution / Availability Desire to learn Total number of customers Willingness to change Perceived quality/esteem Freedom to fail Loyalty / retention Autonomy (Independency) Relative perceived quality Relative employee satisfaction
Marketing Mix Modeling Marketing mix models analyze data from a variety of sources such as: Retailer scanner data Company shipment data – Pricing – Media – Promotion spending data.
MARKETING MIX MODELING Although marketing mix modeling helps to isolate effects, it is less effective at assessing how different marketing elements work in combination. Such modeling also suffers other several things: It focuses on incremental growth instead of baseline sales or long term effects. Despite its important, the integration of metrics such as customer satisfaction, awareness, and brand equity into marketing mix modeling is limited. It fails generally to incorporate metrics related top competitors, the trade, or the sales force.
MARKETING DASHBOARDS Marketing dashboards are like the instrument panel in a car or plane, visually displaying real-time indicators to ensure proper functioning. As input to marketing dashboard, companies should include two key market based scorecards that reflect performance and provide possible early warning signals
PERFORMANCE SCORE CARDS §Customer Performance Scorecard Data §Percentage of new customers to average number of customers. . §Percentage of lost customers to average number of customers. §Percentage of win-back customers to average number of customers. §Percentage of customers who say they would repurchase the product. §Percentage of customers who correctly identify the brand's intended positioning and differentiation. §Average perception of company's product quality relative to chief competitor. §Average perception of company's service quality relative to chief competitor. §Stakeholder Performance scorecard §This card data tracks the satisfaction of various parties who have a critical interest in and impact on company’s performance.