
Concepts of 3 GPP LTE RF Parametric Tests


- Slides: 76
Concepts of 3 GPP LTE RF Parametric Tests Renaud Duverne Wireless R&D Market Initiative Manager © Copyright 2009 Agilent Technologies, Inc.
Agilent LTE Book www. agilent. com/find/ltebook www. amazon. com In print April 16 th The first LTE book dedicated to design and measurement 30 Authors 460 pages
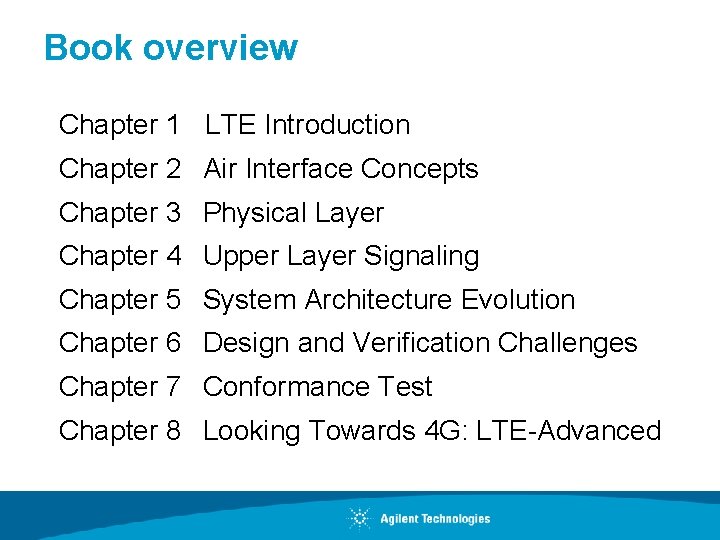
Book overview Chapter 1 LTE Introduction Chapter 2 Air Interface Concepts Chapter 3 Physical Layer Chapter 4 Upper Layer Signaling Chapter 5 System Architecture Evolution Chapter 6 Design and Verification Challenges Chapter 7 Conformance Test Chapter 8 Looking Towards 4 G: LTE-Advanced
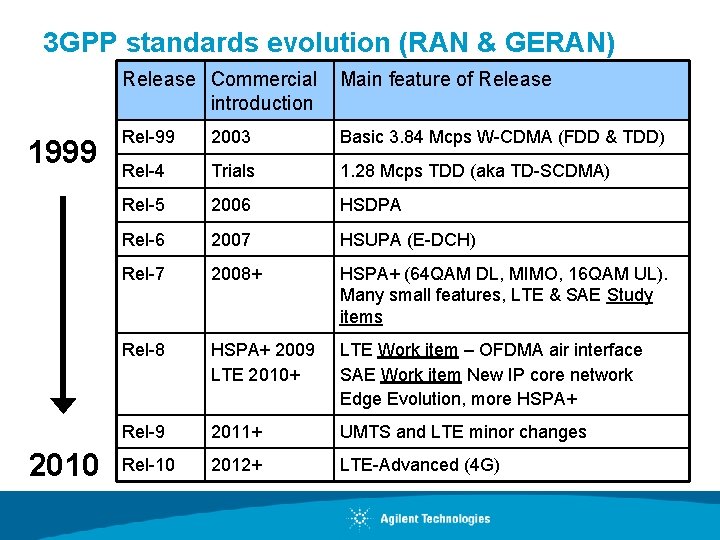
3 GPP standards evolution (RAN & GERAN) 1999 2010 Release Commercial introduction Main feature of Release Rel-99 2003 Basic 3. 84 Mcps W-CDMA (FDD & TDD) Rel-4 Trials 1. 28 Mcps TDD (aka TD-SCDMA) Rel-5 2006 HSDPA Rel-6 2007 HSUPA (E-DCH) Rel-7 2008+ HSPA+ (64 QAM DL, MIMO, 16 QAM UL). Many small features, LTE & SAE Study items Rel-8 HSPA+ 2009 LTE 2010+ LTE Work item – OFDMA air interface SAE Work item New IP core network Edge Evolution, more HSPA+ Rel-9 2011+ UMTS and LTE minor changes Rel-10 2012+ LTE-Advanced (4 G)
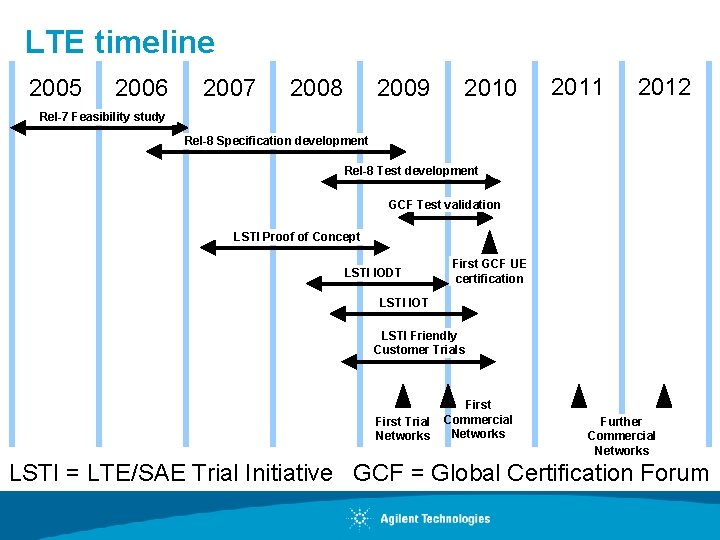
LTE timeline 2005 2006 2007 2008 2009 2010 2011 2012 Rel-7 Feasibility study Rel-8 Specification development Rel-8 Test development GCF Test validation LSTI Proof of Concept LSTI IODT First GCF UE certification LSTI IOT LSTI Friendly Customer Trials First Trial Networks First Commercial Networks Further Commercial Networks LSTI = LTE/SAE Trial Initiative GCF = Global Certification Forum
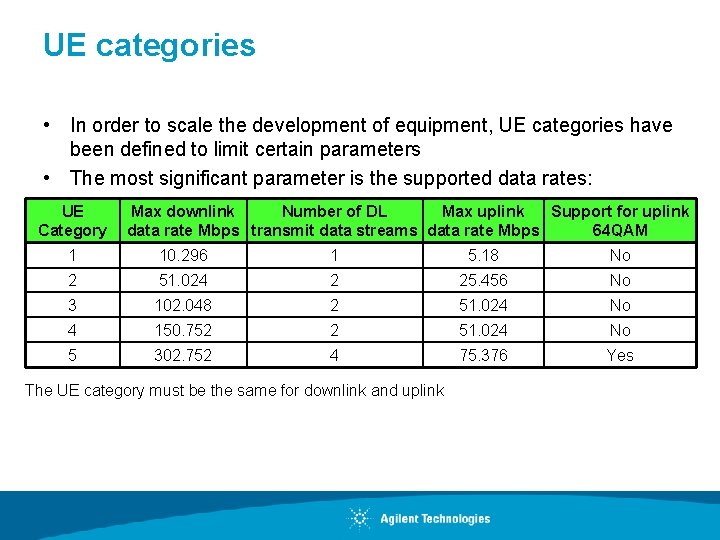
UE categories • In order to scale the development of equipment, UE categories have been defined to limit certain parameters • The most significant parameter is the supported data rates: UE Category Max downlink Number of DL Max uplink Support for uplink data rate Mbps transmit data streams data rate Mbps 64 QAM 1 10. 296 1 5. 18 No 2 51. 024 2 25. 456 No 3 102. 048 2 51. 024 No 4 150. 752 2 51. 024 No 5 302. 752 4 75. 376 Yes The UE category must be the same for downlink and uplink
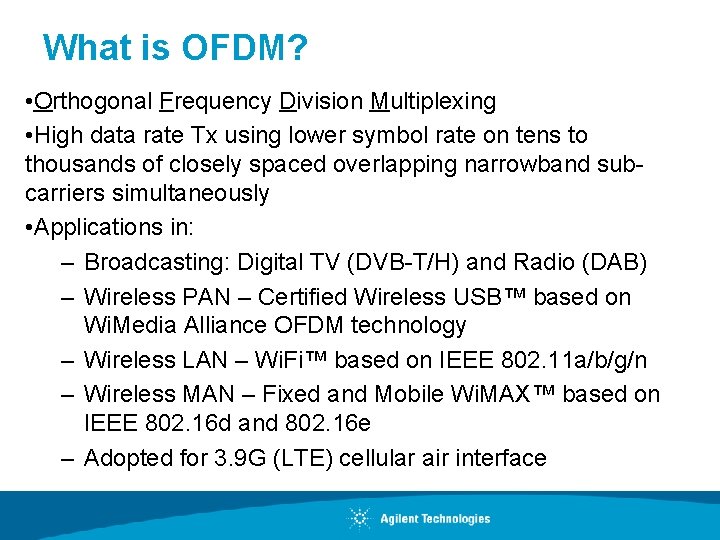
What is OFDM? • Orthogonal Frequency Division Multiplexing • High data rate Tx using lower symbol rate on tens to thousands of closely spaced overlapping narrowband subcarriers simultaneously • Applications in: – Broadcasting: Digital TV (DVB-T/H) and Radio (DAB) – Wireless PAN – Certified Wireless USB™ based on Wi. Media Alliance OFDM technology – Wireless LAN – Wi. Fi™ based on IEEE 802. 11 a/b/g/n – Wireless MAN – Fixed and Mobile Wi. MAX™ based on IEEE 802. 16 d and 802. 16 e – Adopted for 3. 9 G (LTE) cellular air interface
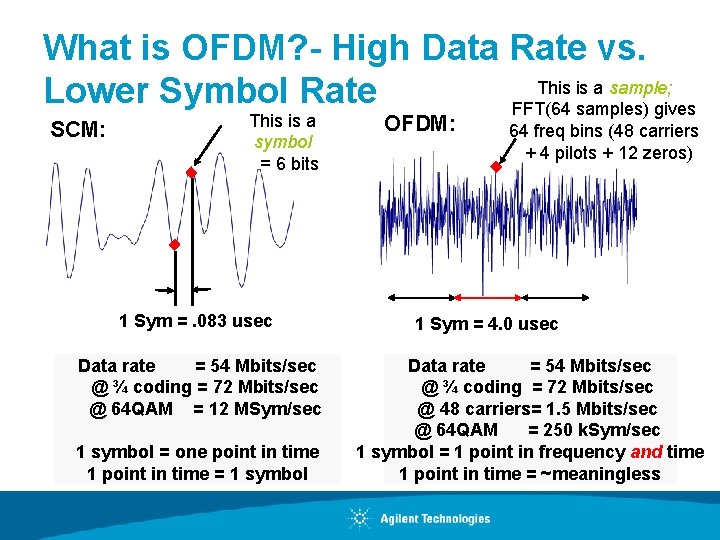
What is OFDM? - High Data Rate vs. This is a sample; Lower Symbol Rate FFT(64 samples) gives SCM: This is a symbol = 6 bits 1 Sym =. 083 usec Data rate = 54 Mbits/sec @ ¾ coding = 72 Mbits/sec @ 64 QAM = 12 MSym/sec 1 symbol = one point in time 1 point in time = 1 symbol OFDM: 64 freq bins (48 carriers + 4 pilots + 12 zeros) 1 Sym = 4. 0 usec Data rate = 54 Mbits/sec @ ¾ coding = 72 Mbits/sec @ 48 carriers= 1. 5 Mbits/sec @ 64 QAM = 250 k. Sym/sec 1 symbol = 1 point in frequency and time 1 point in time = ~meaningless
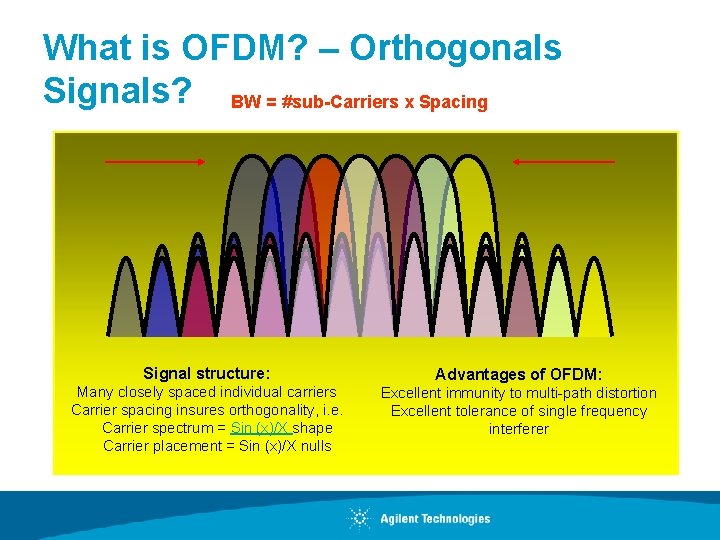
What is OFDM? – Orthogonals Signals? BW = #sub-Carriers x Spacing Signal structure: Advantages of OFDM: Many closely spaced individual carriers Carrier spacing insures orthogonality, i. e. Carrier spectrum = Sin (x)/X shape Carrier placement = Sin (x)/X nulls Excellent immunity to multi-path distortion Excellent tolerance of single frequency interferer
Agenda • List of LTE physical layer transmitter tests • LTE modulation quality test requirements – Downlink – Uplink • Modulation quality signal analysis and troubleshooting techniques • Appendix – LTE physical layer RF measurements
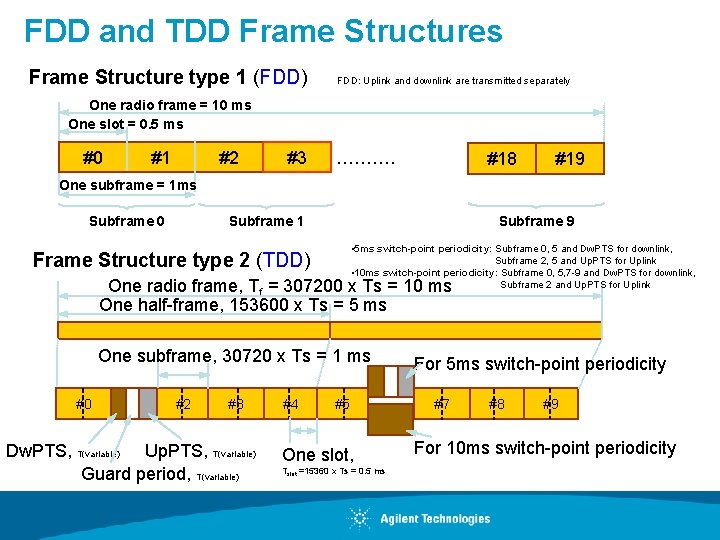
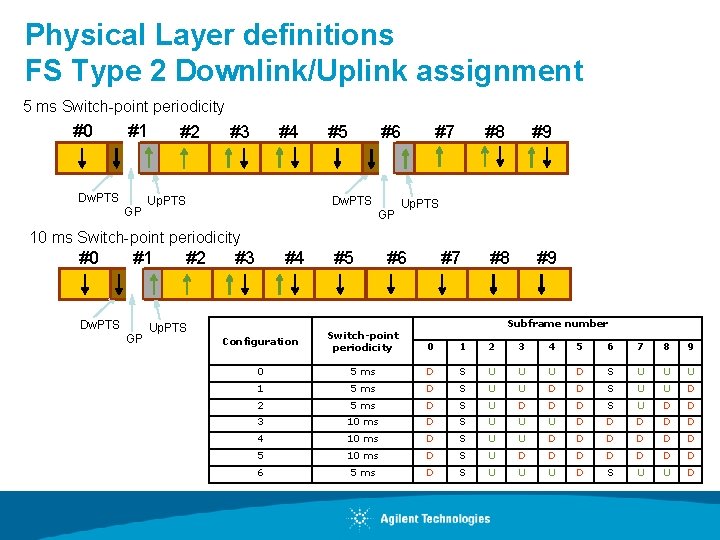
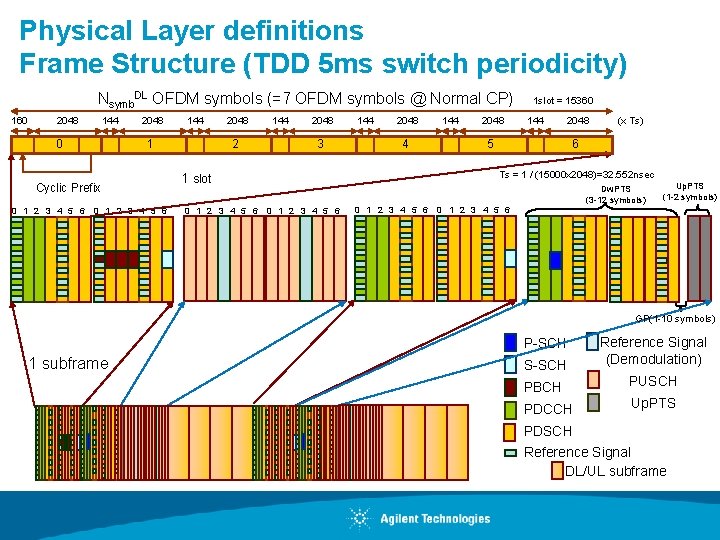
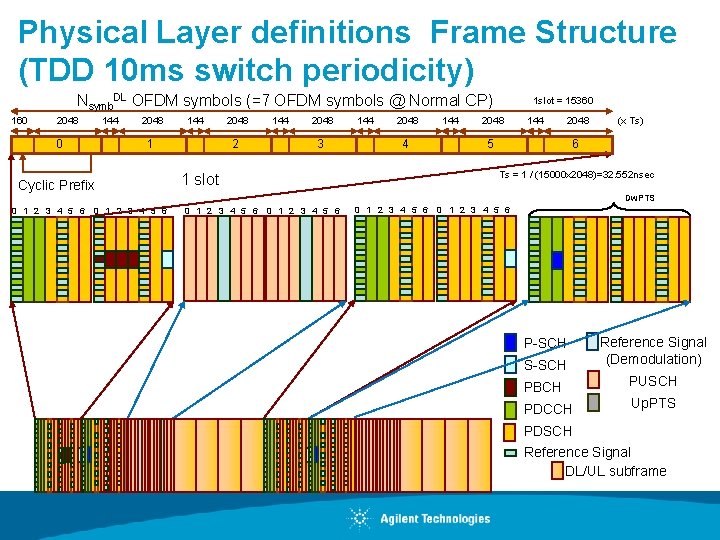
FDD and TDD Frame Structures Frame Structure type 1 (FDD) FDD: Uplink and downlink are transmitted separately One radio frame = 10 ms One slot = 0. 5 ms #0 #1 #2 #3 ………. #18 #19 One subframe = 1 ms Subframe 0 Subframe 1 Subframe 9 • 5 ms switch-point periodicity: Subframe 0, 5 and Dw. PTS for downlink, Subframe 2, 5 and Up. PTS for Uplink • 10 ms switch-point periodicity: Subframe 0, 5, 7 -9 and Dw. PTS for downlink, Subframe 2 and Up. PTS for Uplink Frame Structure type 2 (TDD) One radio frame, Tf = 307200 x Ts = 10 ms One half-frame, 153600 x Ts = 5 ms One subframe, 30720 x Ts = 1 ms #0 #2 #3 Dw. PTS, T(variable) Up. PTS, T(variable) Guard period, T(variable) #4 #5 One slot, Tslot =15360 x Ts = 0. 5 ms For 5 ms switch-point periodicity #7 #8 #9 For 10 ms switch-point periodicity
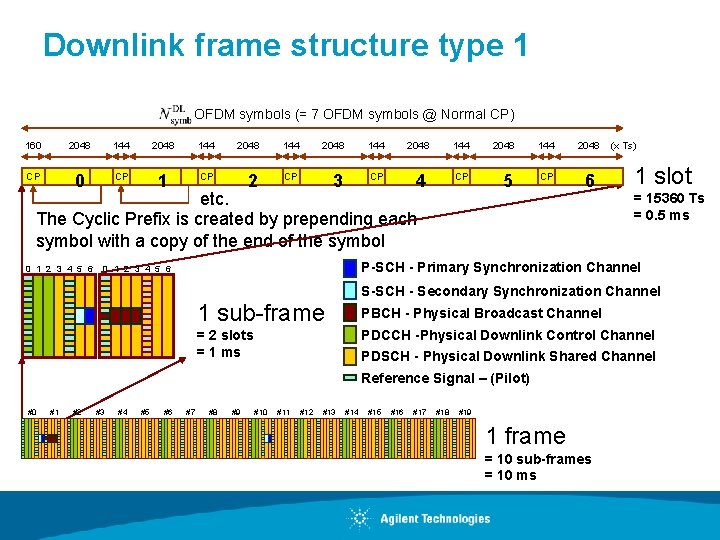
Downlink frame structure type 1 OFDM symbols (= 7 OFDM symbols @ Normal CP) 160 2048 144 2048 144 2048 CP 0 CP 1 CP 2 CP 3 CP 4 CP 5 CP 6 etc. The Cyclic Prefix is created by prepending each symbol with a copy of the end of the symbol 0 1 2 3 4 5 6 (x Ts) 1 slot = 15360 Ts = 0. 5 ms P-SCH - Primary Synchronization Channel 0 1 2 3 4 5 6 S-SCH - Secondary Synchronization Channel 1 sub-frame PBCH - Physical Broadcast Channel = 2 slots = 1 ms PDCCH -Physical Downlink Control Channel PDSCH - Physical Downlink Shared Channel Reference Signal – (Pilot) #0 #1 #2 #3 #4 #5 #6 #7 #8 #9 #10 #11 #12 #13 #14 #15 #16 #17 #18 #19 1 frame = 10 sub-frames = 10 ms
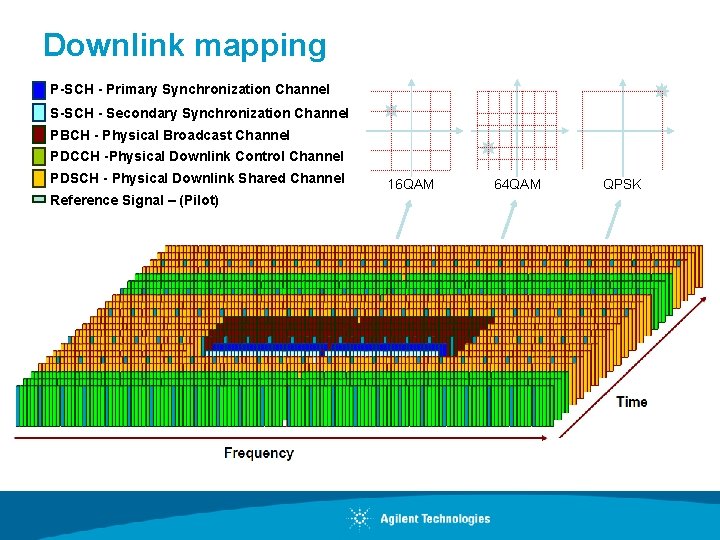
Downlink mapping P-SCH - Primary Synchronization Channel S-SCH - Secondary Synchronization Channel PBCH - Physical Broadcast Channel PDCCH -Physical Downlink Control Channel PDSCH - Physical Downlink Shared Channel Reference Signal – (Pilot) 16 QAM 64 QAM QPSK
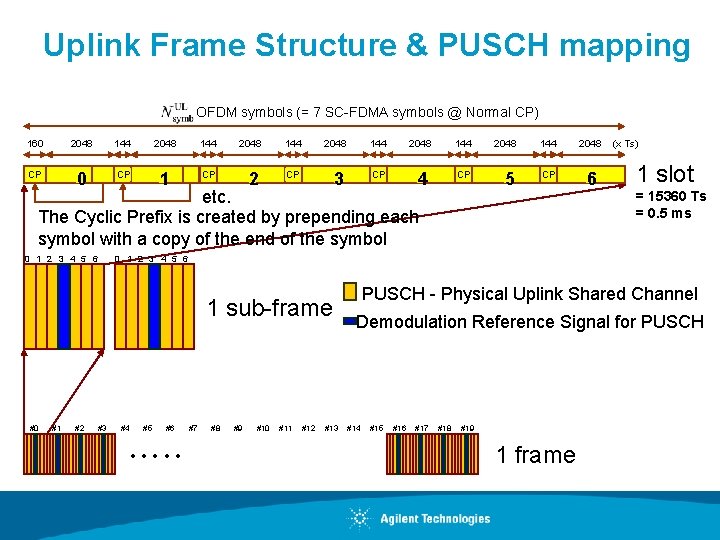
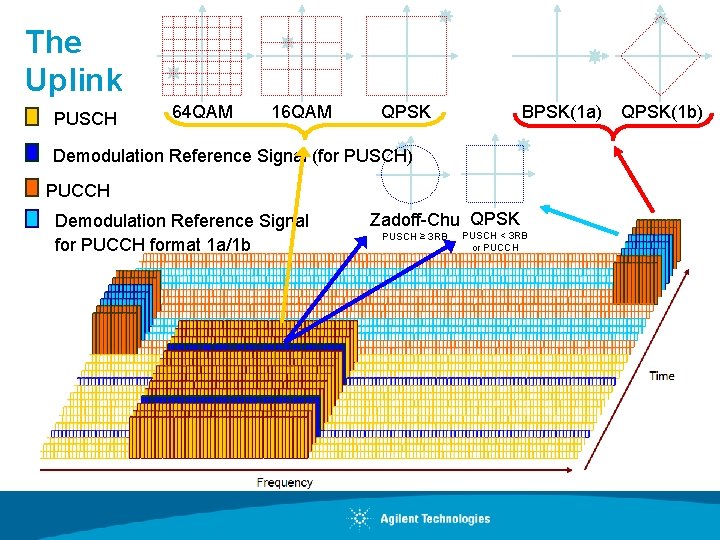
Uplink Frame Structure & PUSCH mapping OFDM symbols (= 7 SC-FDMA symbols @ Normal CP) 160 2048 144 2048 144 2048 CP 0 CP 1 CP 2 CP 3 CP 4 CP 5 CP 6 etc. The Cyclic Prefix is created by prepending each symbol with a copy of the end of the symbol 0 1 2 3 4 5 6 #1 #2 1 slot = 15360 Ts = 0. 5 ms 0 1 2 3 4 5 6 1 sub-frame #0 (x Ts) #3 #4 #5 #6 • • • #7 #8 #9 #10 #11 #12 #13 PUSCH - Physical Uplink Shared Channel Demodulation Reference Signal for PUSCH #14 #15 #16 #17 #18 #19 1 frame
The Uplink PUSCH 64 QAM 16 QAM QPSK BPSK(1 a) Demodulation Reference Signal (for PUSCH) PUCCH Demodulation Reference Signal for PUCCH format 1 a/1 b Zadoff-Chu QPSK PUSCH ≥ 3 RB PUSCH < 3 RB or PUCCH QPSK(1 b)
Physical Layer definitions FS Type 2 Downlink/Uplink assignment 5 ms Switch-point periodicity #0 #1 Dw. PTS GP #2 #3 #4 #5 #6 Dw. PTS Up. PTS GP #7 #8 #9 Up. PTS 10 ms Switch-point periodicity #0 #1 Dw. PTS GP #2 #3 #4 Up. PTS #5 #6 #7 #8 #9 Subframe number Configuration Switch-point periodicity 0 1 2 3 4 5 6 7 8 9 0 5 ms D S U U U 1 5 ms D S U U D 2 5 ms D S U D D 3 10 ms D S U U U D D D 4 10 ms D S U U D D D 5 10 ms D S U D D D D 6 5 ms D S U U U D S U U D
Physical Layer definitions Frame Structure (TDD 5 ms switch periodicity) Nsymb. DL OFDM symbols (=7 OFDM symbols @ Normal CP) 160 2048 144 0 2048 1 Cyclic Prefix 0 1 2 3 4 5 6 144 0 1 2 3 4 5 6 2048 2 144 2048 3 144 2048 5 6 Dw. PTS (3 -12 symbols) 0 1 2 3 4 5 6 Up. PTS (1 -2 symbols) 0 1 2 3 4 5 6 Downlink GP(1 -10 symbols) Uplink S-SCH Reference Signal (Demodulation) PBCH PUSCH PDCCH Up. PTS P-SCH 1 subframe (x Ts) Ts = 1 / (15000 x 2048)=32. 552 nsec 1 slot 0 1 2 3 4 5 6 144 1 slot = 15360 PDSCH Reference Signal DL/UL subframe
Physical Layer definitions Frame Structure (TDD 10 ms switch periodicity) Nsymb. DL OFDM symbols (=7 OFDM symbols @ Normal CP) 160 2048 144 0 2048 1 Cyclic Prefix 0 1 2 3 4 5 6 144 0 1 2 3 4 5 6 2048 2 144 2048 3 144 2048 4 144 1 slot = 15360 2048 144 2048 5 (x Ts) 6 Ts = 1 / (15000 x 2048)=32. 552 nsec 1 slot Dw. PTS 0 1 2 3 4 5 6 Downlink Uplink S-SCH Reference Signal (Demodulation) PBCH PUSCH PDCCH Up. PTS P-SCH PDSCH Reference Signal DL/UL subframe
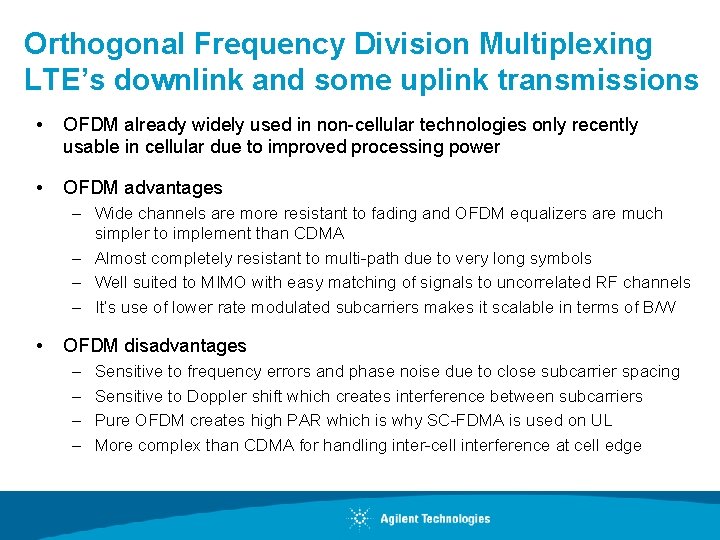
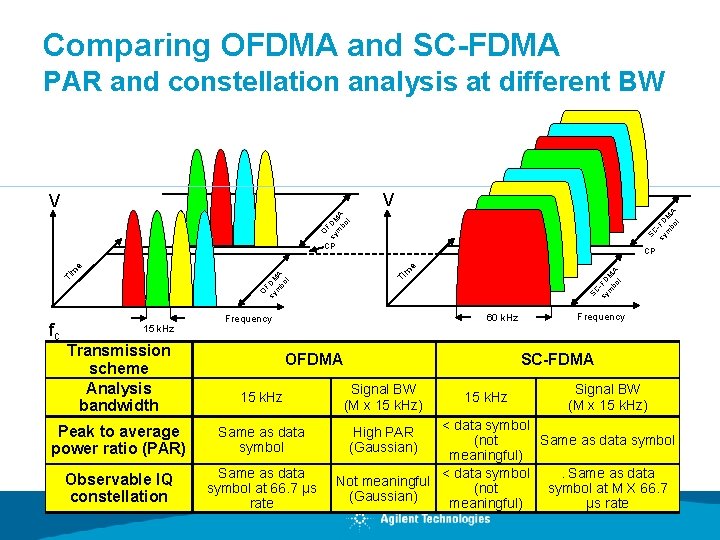
Orthogonal Frequency Division Multiplexing LTE’s downlink and some uplink transmissions • OFDM already widely used in non-cellular technologies only recently usable in cellular due to improved processing power • OFDM advantages – Wide channels are more resistant to fading and OFDM equalizers are much simpler to implement than CDMA – Almost completely resistant to multi-path due to very long symbols – Well suited to MIMO with easy matching of signals to uncorrelated RF channels – It’s use of lower rate modulated subcarriers makes it scalable in terms of B/W • OFDM disadvantages – – Sensitive to frequency errors and phase noise due to close subcarrier spacing Sensitive to Doppler shift which creates interference between subcarriers Pure OFDM creates high PAR which is why SC-FDMA is used on UL More complex than CDMA for handling inter-cell interference at cell edge
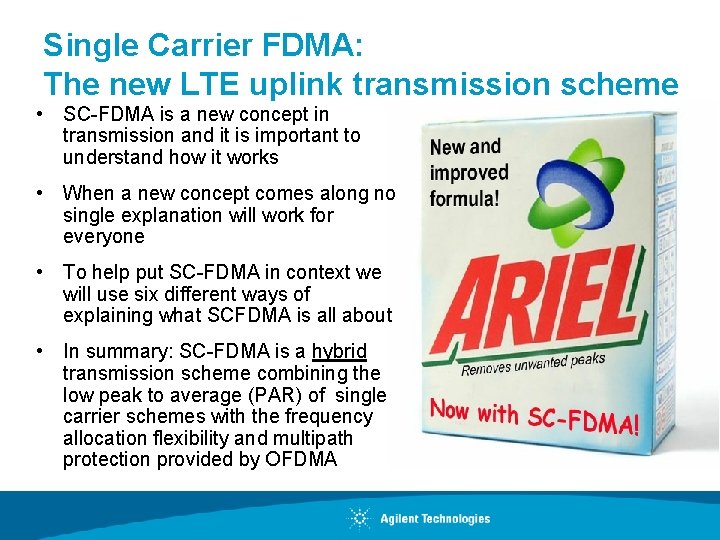
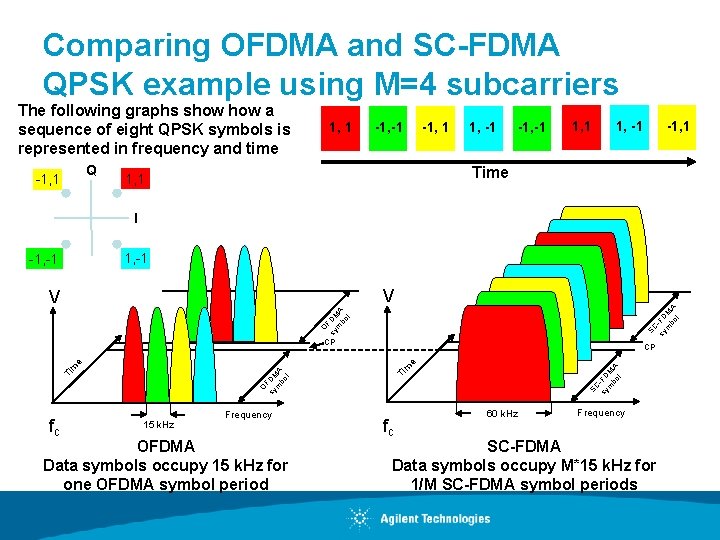
Single Carrier FDMA: The new LTE uplink transmission scheme • SC-FDMA is a new concept in transmission and it is important to understand how it works • When a new concept comes along no single explanation will work for everyone • To help put SC-FDMA in context we will use six different ways of explaining what SCFDMA is all about • In summary: SC-FDMA is a hybrid transmission scheme combining the low peak to average (PAR) of single carrier schemes with the frequency allocation flexibility and multipath protection provided by OFDMA
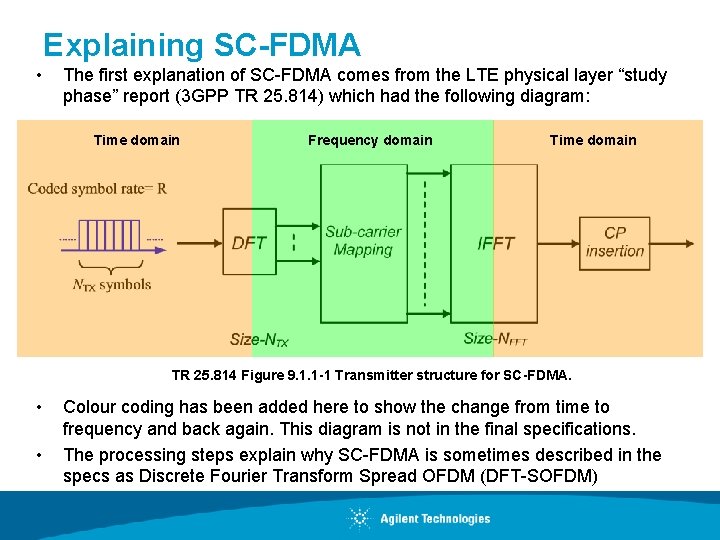
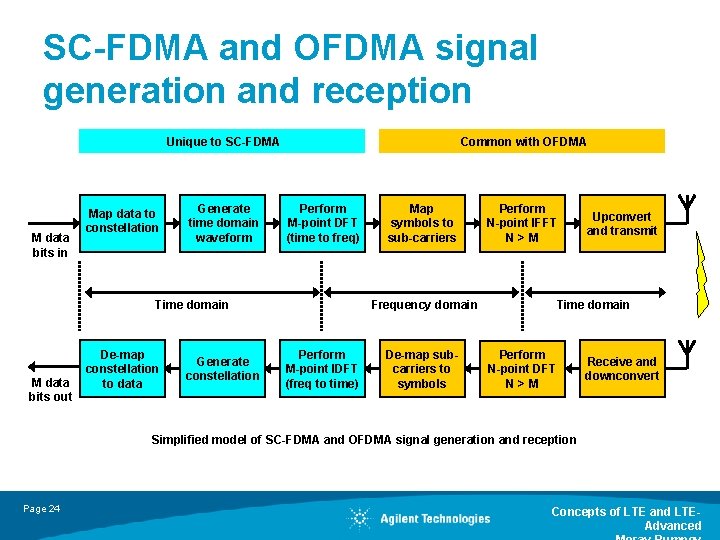
Explaining SC-FDMA • The first explanation of SC-FDMA comes from the LTE physical layer “study phase” report (3 GPP TR 25. 814) which had the following diagram: Time domain Frequency domain Time domain TR 25. 814 Figure 9. 1. 1 -1 Transmitter structure for SC-FDMA. • • Colour coding has been added here to show the change from time to frequency and back again. This diagram is not in the final specifications. The processing steps explain why SC-FDMA is sometimes described in the specs as Discrete Fourier Transform Spread OFDM (DFT-SOFDM)
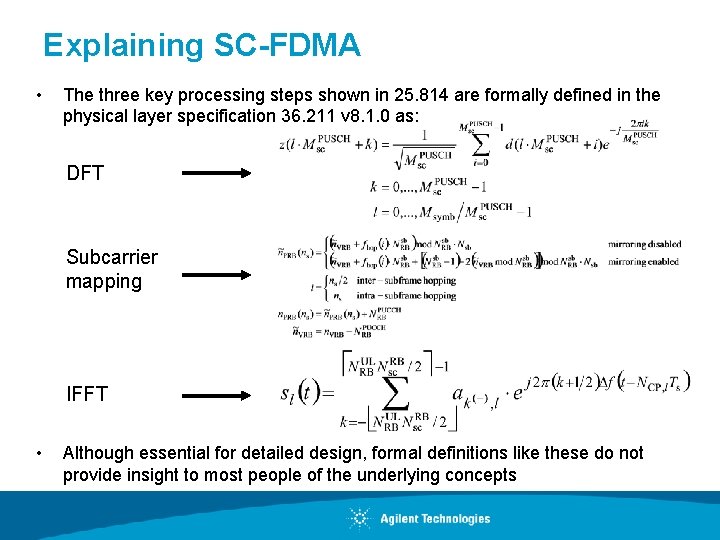
Explaining SC-FDMA • The three key processing steps shown in 25. 814 are formally defined in the physical layer specification 36. 211 v 8. 1. 0 as: DFT Subcarrier mapping IFFT • Although essential for detailed design, formal definitions like these do not provide insight to most people of the underlying concepts
Comparing OFDMA and SC-FDMA QPSK example using M=4 subcarriers The following graphs show a sequence of eight QPSK symbols is represented in frequency and time Q -1, 1 -1, -1 -1, 1 1, -1 -1, -1 -1, 1 Time 1, 1 I 1, -1 -1, -1 O F sy DM m A bo l SC sy -FD m M bo A l V V CP fc Frequency OFDMA Data symbols occupy 15 k. Hz for one OFDMA symbol period SC sy -FD m M bo A l m e 15 k. Hz Ti Ti O F sy DM m A bo l m e CP fc 60 k. Hz Frequency SC-FDMA Data symbols occupy M*15 k. Hz for 1/M SC-FDMA symbol periods
SC-FDMA and OFDMA signal generation and reception Unique to SC-FDMA M data bits in Map data to constellation Generate time domain waveform Common with OFDMA Perform M-point DFT (time to freq) Time domain M data bits out De-map constellation to data Generate constellation Map symbols to sub-carriers Perform N-point IFFT N>M Frequency domain Perform M-point IDFT (freq to time) De-map subcarriers to symbols Upconvert and transmit Time domain Perform N-point DFT N>M Receive and downconvert Simplified model of SC-FDMA and OFDMA signal generation and reception Page 24 Concepts of LTE and LTEAdvanced
Comparing OFDMA and SC-FDMA PAR and constellation analysis at different BW O F sy DM m A bo l SC sy -FD m M bo A l V V CP fc 15 k. Hz Transmission scheme Analysis bandwidth SC sy -FD m M bo A l Ti m O F sy DM m A bo l Ti m e e CP 60 k. Hz Frequency OFDMA 15 k. Hz Peak to average power ratio (PAR) Same as data symbol Observable IQ constellation Same as data symbol at 66. 7 μs rate Frequency SC-FDMA Signal BW (M x 15 k. Hz) 15 k. Hz Signal BW (M x 15 k. Hz) < data symbol (not Same as data symbol meaningful) < data symbol. Same as data Not meaningful (not symbol at M X 66. 7 (Gaussian) meaningful) µs rate High PAR (Gaussian)
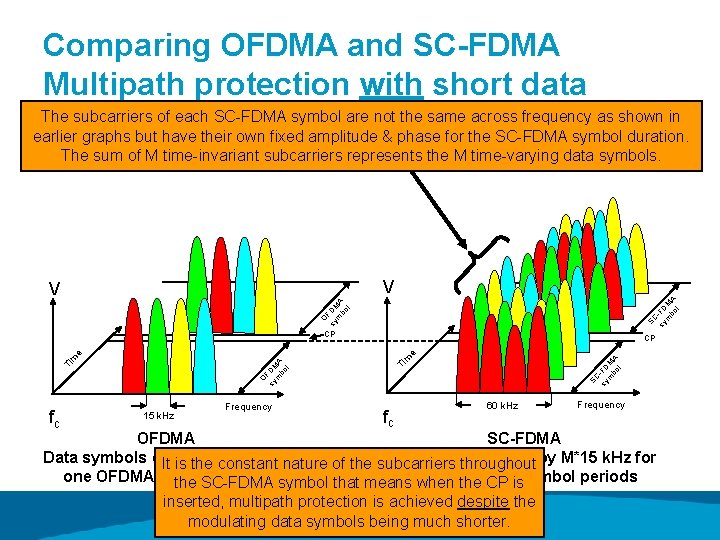
Comparing OFDMA and SC-FDMA Multipath protection with short data The subcarriers of each SC-FDMA symbol are not the same across frequency as shown in symbols earlier graphs but have their own fixed amplitude & phase for the SC-FDMA symbol duration. The sum of M time-invariant subcarriers represents the M time-varying data symbols. O F sy DM m A bo l SC sy -FD m M bo A l V V CP fc 15 k. Hz Frequency SC sy -FD m M bo A l m Ti O F sy DM m A bo l Ti m e e CP fc 60 k. Hz Frequency OFDMA SC-FDMA Data symbols occupy k. Hz fornature of the subcarriers Data symbols occupy M*15 k. Hz for It is the 15 constant throughout one OFDMA symbol period symbol that means 1/M SC-FDMA the SC-FDMA when the CP issymbol periods inserted, multipath protection is achieved despite the modulating data symbols being much shorter.
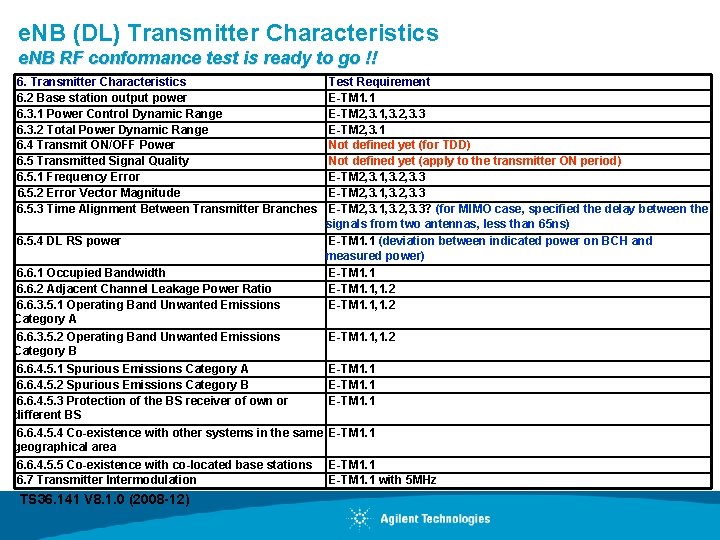
e. NB (DL) Transmitter Characteristics e. NB RF conformance test is ready to go !! 6. Transmitter Characteristics 6. 2 Base station output power 6. 3. 1 Power Control Dynamic Range 6. 3. 2 Total Power Dynamic Range 6. 4 Transmit ON/OFF Power 6. 5 Transmitted Signal Quality 6. 5. 1 Frequency Error 6. 5. 2 Error Vector Magnitude 6. 5. 3 Time Alignment Between Transmitter Branches 6. 5. 4 DL RS power 6. 6. 1 Occupied Bandwidth 6. 6. 2 Adjacent Channel Leakage Power Ratio 6. 6. 3. 5. 1 Operating Band Unwanted Emissions Category A 6. 6. 3. 5. 2 Operating Band Unwanted Emissions Category B 6. 6. 4. 5. 1 Spurious Emissions Category A 6. 6. 4. 5. 2 Spurious Emissions Category B 6. 6. 4. 5. 3 Protection of the BS receiver of own or different BS 6. 6. 4. 5. 4 Co-existence with other systems in the same geographical area 6. 6. 4. 5. 5 Co-existence with co-located base stations 6. 7 Transmitter Intermodulation TS 36. 141 V 8. 1. 0 (2008 -12) Test Requirement E-TM 1. 1 E-TM 2, 3. 1, 3. 2, 3. 3 E-TM 2, 3. 1 Not defined yet (for TDD) Not defined yet (apply to the transmitter ON period) E-TM 2, 3. 1, 3. 2, 3. 3? (for MIMO case, specified the delay between the signals from two antennas, less than 65 ns) E-TM 1. 1 (deviation between indicated power on BCH and measured power) E-TM 1. 1, 1. 2 E-TM 1. 1 with 5 MHz
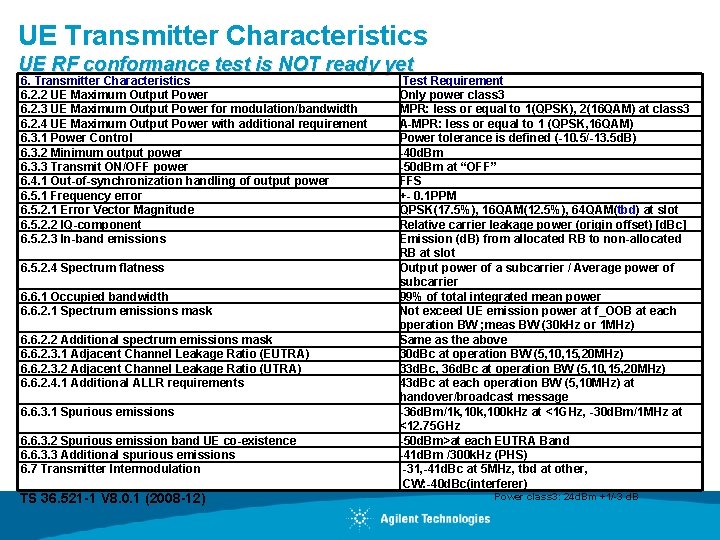
UE Transmitter Characteristics UE RF conformance test is NOT ready yet 6. Transmitter Characteristics 6. 2. 2 UE Maximum Output Power 6. 2. 3 UE Maximum Output Power for modulation/bandwidth 6. 2. 4 UE Maximum Output Power with additional requirement 6. 3. 1 Power Control 6. 3. 2 Minimum output power 6. 3. 3 Transmit ON/OFF power 6. 4. 1 Out-of-synchronization handling of output power 6. 5. 1 Frequency error 6. 5. 2. 1 Error Vector Magnitude 6. 5. 2. 2 IQ-component 6. 5. 2. 3 In-band emissions 6. 5. 2. 4 Spectrum flatness 6. 6. 1 Occupied bandwidth 6. 6. 2. 1 Spectrum emissions mask 6. 6. 2. 2 Additional spectrum emissions mask 6. 6. 2. 3. 1 Adjacent Channel Leakage Ratio (EUTRA) 6. 6. 2. 3. 2 Adjacent Channel Leakage Ratio (UTRA) 6. 6. 2. 4. 1 Additional ALLR requirements 6. 6. 3. 1 Spurious emissions 6. 6. 3. 2 Spurious emission band UE co-existence 6. 6. 3. 3 Additional spurious emissions 6. 7 Transmitter Intermodulation TS 36. 521 -1 V 8. 0. 1 (2008 -12) Test Requirement Only power class 3 MPR: less or equal to 1(QPSK), 2(16 QAM) at class 3 A-MPR: less or equal to 1 (QPSK, 16 QAM) Power tolerance is defined (-10. 5/-13. 5 d. B) -40 d. Bm -50 d. Bm at “OFF” FFS +- 0. 1 PPM QPSK(17. 5%), 16 QAM(12. 5%), 64 QAM(tbd) at slot Relative carrier leakage power (origin offset) [d. Bc] Emission (d. B) from allocated RB to non-allocated RB at slot Output power of a subcarrier / Average power of subcarrier 99% of total integrated mean power Not exceed UE emission power at f_OOB at each operation BW ; meas BW (30 k. Hz or 1 MHz) Same as the above 30 d. Bc at operation BW (5, 10, 15, 20 MHz) 33 d. Bc, 36 d. Bc at operation BW (5, 10, 15, 20 MHz) 43 d. Bc at each operation BW (5, 10 MHz) at handover/broadcast message -36 d. Bm/1 k, 100 k. Hz at <1 GHz, -30 d. Bm/1 MHz at <12. 75 GHz -50 d. Bm>at each EUTRA Band -41 d. Bm /300 k. Hz (PHS) -31, -41 d. Bc at 5 MHz, tbd at other, CW: -40 d. Bc(interferer) Power class 3: 24 d. Bm +1/-3 d. B
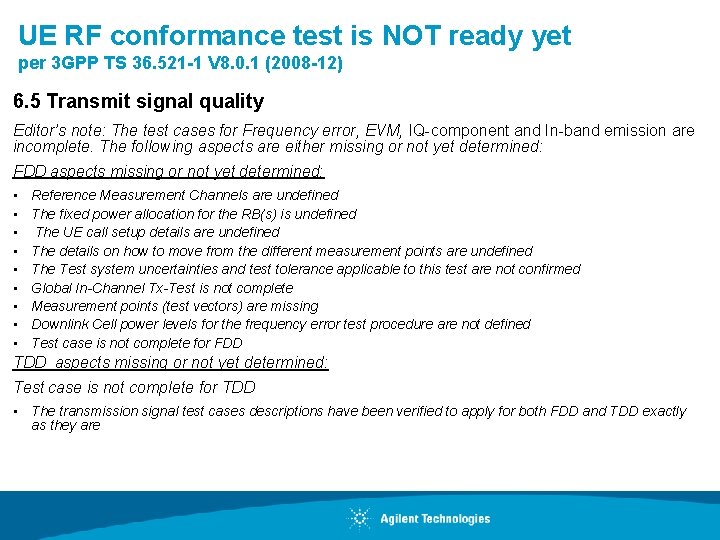
UE RF conformance test is NOT ready yet per 3 GPP TS 36. 521 -1 V 8. 0. 1 (2008 -12) 6. 5 Transmit signal quality Editor’s note: The test cases for Frequency error, EVM, IQ-component and In-band emission are incomplete. The following aspects are either missing or not yet determined: FDD aspects missing or not yet determined: • • • Reference Measurement Channels are undefined The fixed power allocation for the RB(s) is undefined The UE call setup details are undefined The details on how to move from the different measurement points are undefined The Test system uncertainties and test tolerance applicable to this test are not confirmed Global In-Channel Tx-Test is not complete Measurement points (test vectors) are missing Downlink Cell power levels for the frequency error test procedure are not defined Test case is not complete for FDD TDD aspects missing or not yet determined: Test case is not complete for TDD • The transmission signal test cases descriptions have been verified to apply for both FDD and TDD exactly as they are
Agenda • List of LTE physical layer transmitter tests • LTE modulation quality test requirements – Downlink – Uplink • Modulation quality signal analysis and troubleshooting techniques • Appendix – LTE physical layer RF measurements
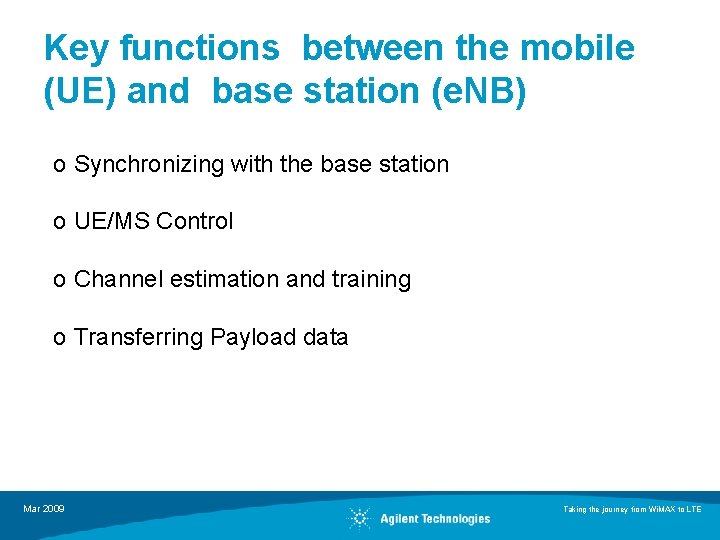
Key functions between the mobile (UE) and base station (e. NB) o Synchronizing with the base station o UE/MS Control o Channel estimation and training o Transferring Payload data Mar 2009 Taking the journey from Wi. MAX to LTE
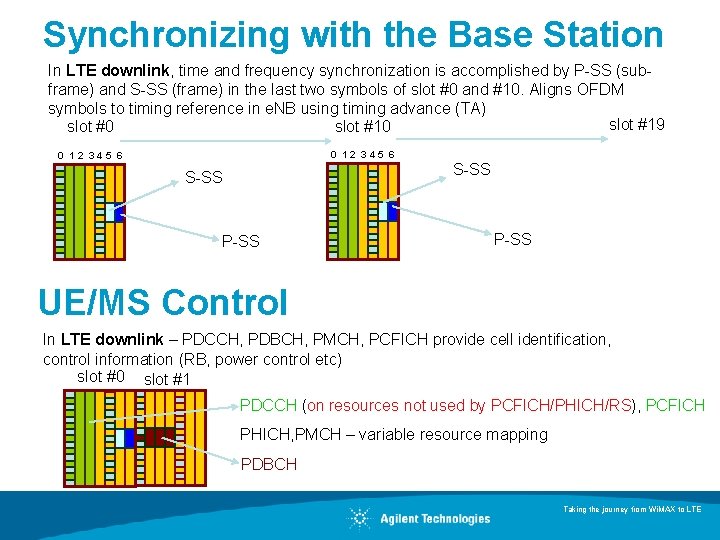
Synchronizing with the Base Station In LTE downlink, time and frequency synchronization is accomplished by P-SS (subframe) and S-SS (frame) in the last two symbols of slot #0 and #10. Aligns OFDM symbols to timing reference in e. NB using timing advance (TA) slot #19 slot #0 slot #10 0 12 345 6 S-SS P-SS UE/MS Control In LTE downlink – PDCCH, PDBCH, PMCH, PCFICH provide cell identification, control information (RB, power control etc) slot #0 slot #1 PDCCH (on resources not used by PCFICH/PHICH/RS), PCFICH PHICH, PMCH – variable resource mapping PDBCH Taking the journey from Wi. MAX to LTE
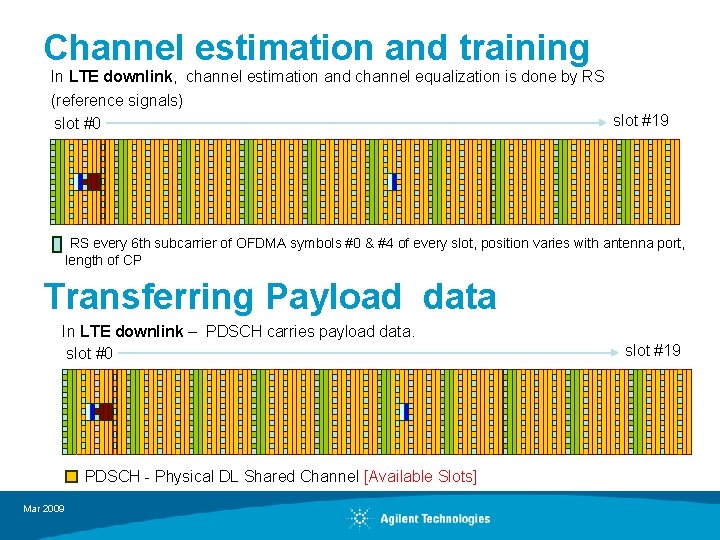
Channel estimation and training In LTE downlink, channel estimation and channel equalization is done by RS (reference signals) slot #19 slot #0 RS every 6 th subcarrier of OFDMA symbols #0 & #4 of every slot, position varies with antenna port, length of CP Transferring Payload data In LTE downlink – PDSCH carries payload data. slot #0 PDSCH - Physical DL Shared Channel [Available Slots] Mar 2009 slot #19
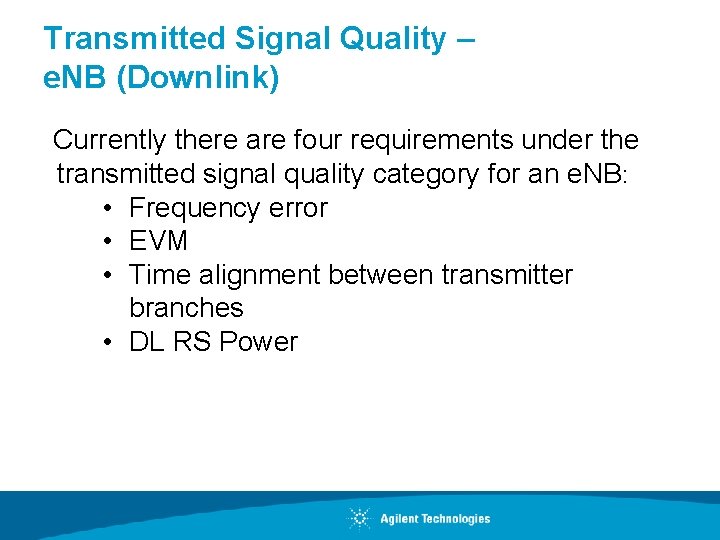
Transmitted Signal Quality – e. NB (Downlink) Currently there are four requirements under the transmitted signal quality category for an e. NB: • Frequency error • EVM • Time alignment between transmitter branches • DL RS Power
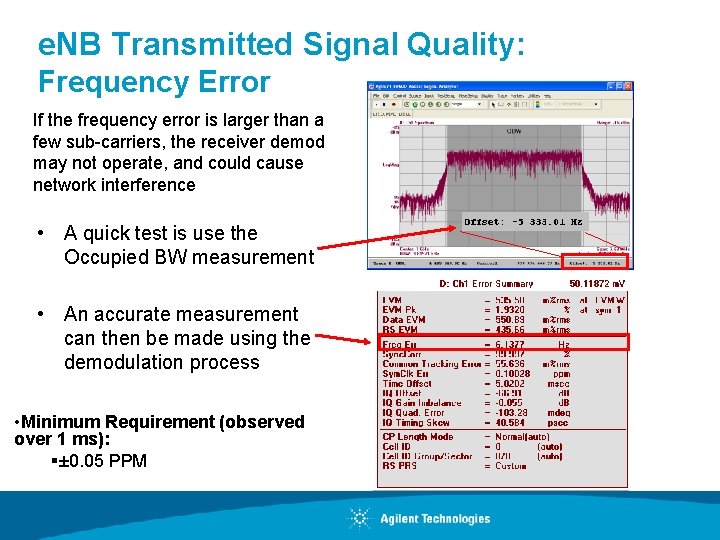
e. NB Transmitted Signal Quality: Frequency Error If the frequency error is larger than a few sub-carriers, the receiver demod may not operate, and could cause network interference • A quick test is use the Occupied BW measurement • An accurate measurement can then be made using the demodulation process • Minimum Requirement (observed over 1 ms): §± 0. 05 PPM
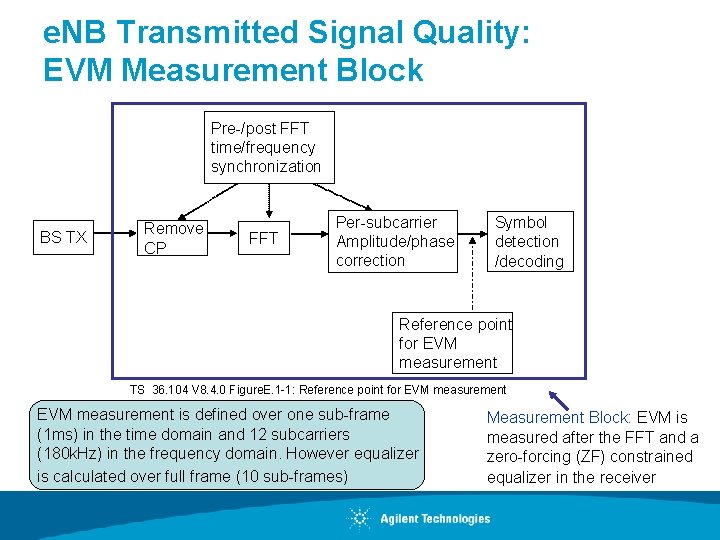
e. NB Transmitted Signal Quality: EVM Measurement Block Pre-/post FFT time/frequency synchronization BS TX Remove CP FFT Per-subcarrier Amplitude/phase correction Symbol detection /decoding Reference point for EVM measurement TS 36. 104 V 8. 4. 0 Figure. E. 1 -1: Reference point for EVM measurement is defined over one sub-frame (1 ms) in the time domain and 12 subcarriers (180 k. Hz) in the frequency domain. However equalizer is calculated over full frame (10 sub-frames) Measurement Block: EVM is measured after the FFT and a zero-forcing (ZF) constrained equalizer in the receiver
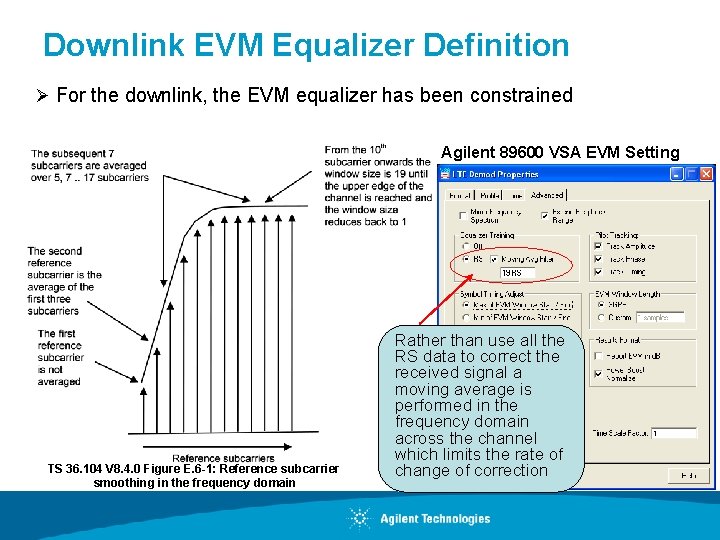
Downlink EVM Equalizer Definition Ø For the downlink, the EVM equalizer has been constrained Agilent 89600 VSA EVM Setting TS 36. 104 V 8. 4. 0 Figure E. 6 -1: Reference subcarrier smoothing in the frequency domain Rather than use all the RS data to correct the received signal a moving average is performed in the frequency domain across the channel which limits the rate of change of correction
Important notes on EVM (DL and UL) No transmit/receive filter will be defined • In UMTS a transmit/receive filter was defined – Root raised cosine α = 0. 22 • This filter was also used to make EVM measurements – Deviations from the ideal filter increased the measured EVM • • In LTE with OFDMA/SC-FDMA no TX/RX filter is defined The lack of a filter creates opportunities and problems: – Signal generation can be optimized to meet in-channel and out of channel requirements – Signal reception and measurement have no standard reference • It is expected that real receivers will use the downlink reference signals (pilots) to correct for frequency and phase – But no standard for how to do this will be specified
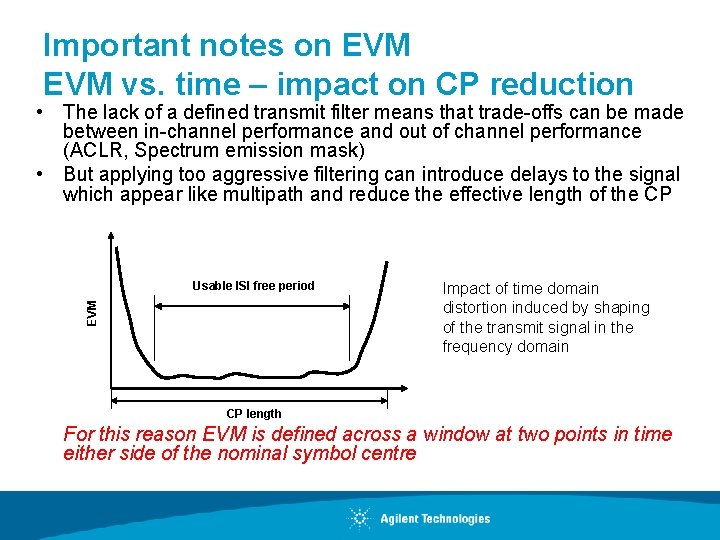
Important notes on EVM vs. time – impact on CP reduction • The lack of a defined transmit filter means that trade-offs can be made between in-channel performance and out of channel performance (ACLR, Spectrum emission mask) • But applying too aggressive filtering can introduce delays to the signal which appear like multipath and reduce the effective length of the CP EVM Usable ISI free period Impact of time domain distortion induced by shaping of the transmit signal in the frequency domain CP length For this reason EVM is defined across a window at two points in time either side of the nominal symbol centre
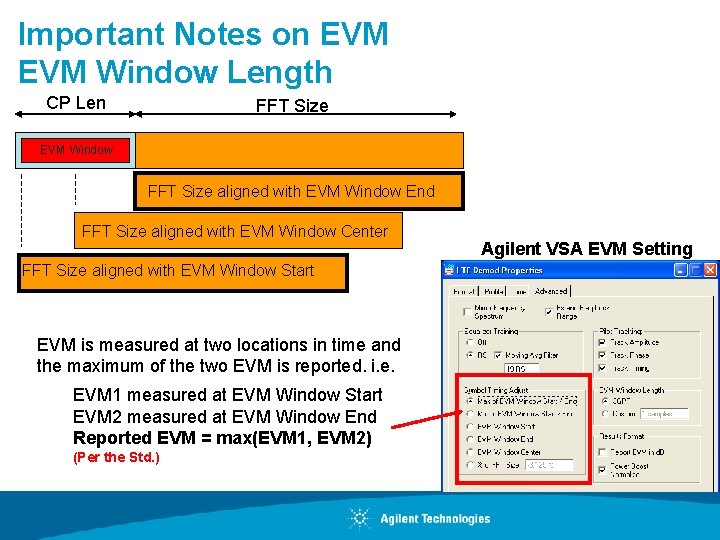
Important Notes on EVM Window Length CP Len FFT Size EVM Window FFT Size aligned with EVM Window End FFT Size aligned with EVM Window Center FFT Size aligned with EVM Window Start EVM is measured at two locations in time and the maximum of the two EVM is reported. i. e. EVM 1 measured at EVM Window Start EVM 2 measured at EVM Window End Reported EVM = max(EVM 1, EVM 2) (Per the Std. ) Agilent VSA EVM Setting
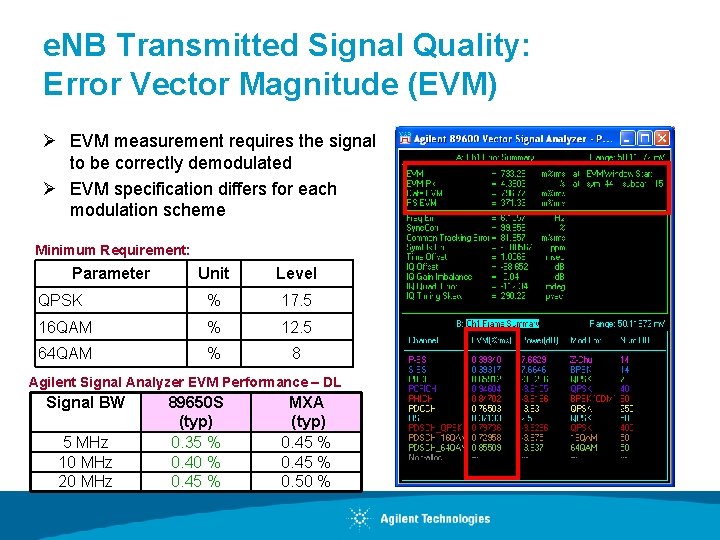
e. NB Transmitted Signal Quality: Error Vector Magnitude (EVM) Ø EVM measurement requires the signal to be correctly demodulated Ø EVM specification differs for each modulation scheme Minimum Requirement: Parameter Unit Level QPSK % 17. 5 16 QAM % 12. 5 64 QAM % 8 Agilent Signal Analyzer EVM Performance – DL Signal BW 5 MHz 10 MHz 20 MHz 89650 S (typ) 0. 35 % 0. 40 % 0. 45 % MXA (typ) 0. 45 % 0. 50 %
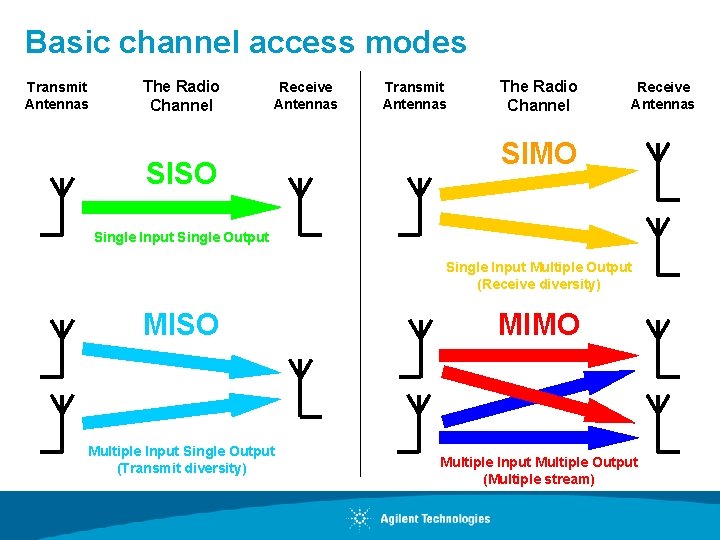
Basic channel access modes Transmit Antennas The Radio Channel Receive Antennas SISO Transmit Antennas The Radio Channel Receive Antennas SIMO Single Input Single Output Single Input Multiple Output (Receive diversity) MISO Multiple Input Single Output (Transmit diversity) MIMO Multiple Input Multiple Output (Multiple stream)
MIMO operation • MIMO gain comes from spatial diversity in the channel • The performance can be optimized using precoding • Depending on noise levels, the rank (number of parallel streams) can be varied • The principles of spatial diversity, precoding and rank adaptation can seem complex but can be readily explained by reference to well-known acoustic principles
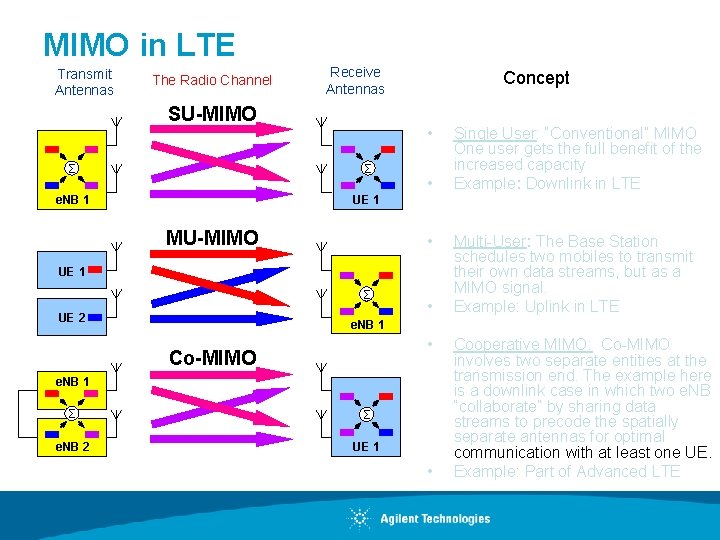
MIMO in LTE Transmit Antennas The Radio Channel Receive Antennas SU-MIMO Concept • Σ Σ e. NB 1 UE 1 MU-MIMO • • UE 1 Σ UE 2 • Single User: “Conventional” MIMO One user gets the full benefit of the increased capacity Example: Downlink in LTE Multi-User: The Base Station schedules two mobiles to transmit their own data streams, but as a MIMO signal. Example: Uplink in LTE e. NB 1 • Co-MIMO e. NB 1 Σ Σ e. NB 2 UE 1 • Cooperative MIMO: Co-MIMO involves two separate entities at the transmission end. The example here is a downlink case in which two e. NB “collaborate” by sharing data streams to precode the spatially separate antennas for optimal communication with at least one UE. Example: Part of Advanced LTE
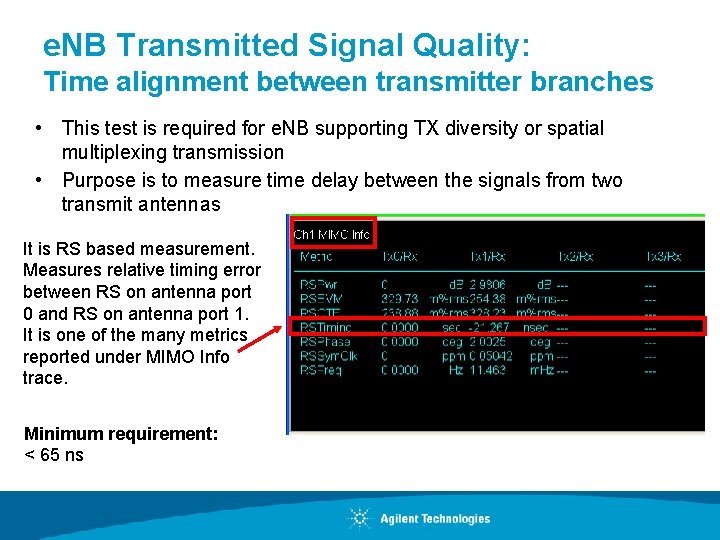
e. NB Transmitted Signal Quality: Time alignment between transmitter branches • This test is required for e. NB supporting TX diversity or spatial multiplexing transmission • Purpose is to measure time delay between the signals from two transmit antennas It is RS based measurement. Measures relative timing error between RS on antenna port 0 and RS on antenna port 1. It is one of the many metrics reported under MIMO Info trace. Minimum requirement: < 65 ns
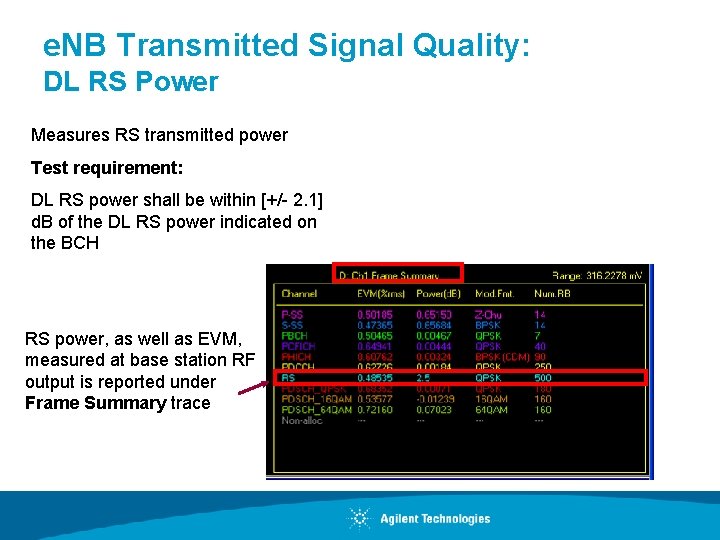
e. NB Transmitted Signal Quality: DL RS Power Measures RS transmitted power Test requirement: DL RS power shall be within [+/- 2. 1] d. B of the DL RS power indicated on the BCH RS power, as well as EVM, measured at base station RF output is reported under Frame Summary trace
Agenda • List of LTE physical layer transmitter tests • LTE modulation quality test requirements – Downlink – Uplink • Modulation quality signal analysis and troubleshooting techniques • Appendix – LTE physical layer RF measurements
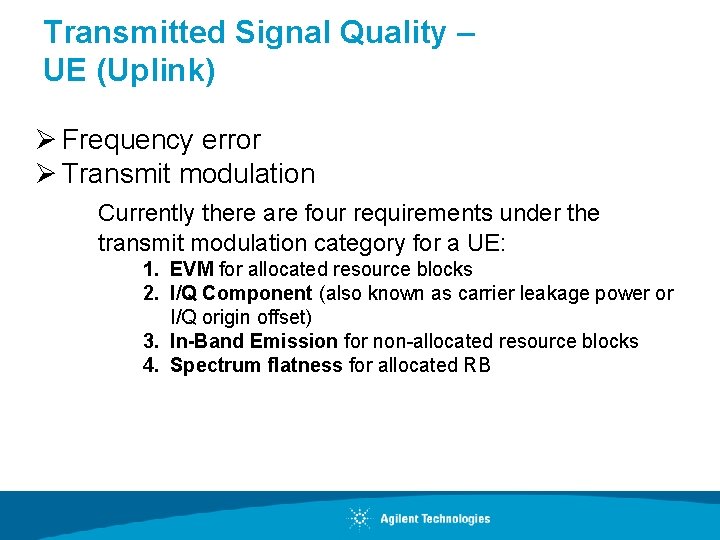
Transmitted Signal Quality – UE (Uplink) Ø Frequency error Ø Transmit modulation Currently there are four requirements under the transmit modulation category for a UE: 1. EVM for allocated resource blocks 2. I/Q Component (also known as carrier leakage power or I/Q origin offset) 3. In-Band Emission for non-allocated resource blocks 4. Spectrum flatness for allocated RB
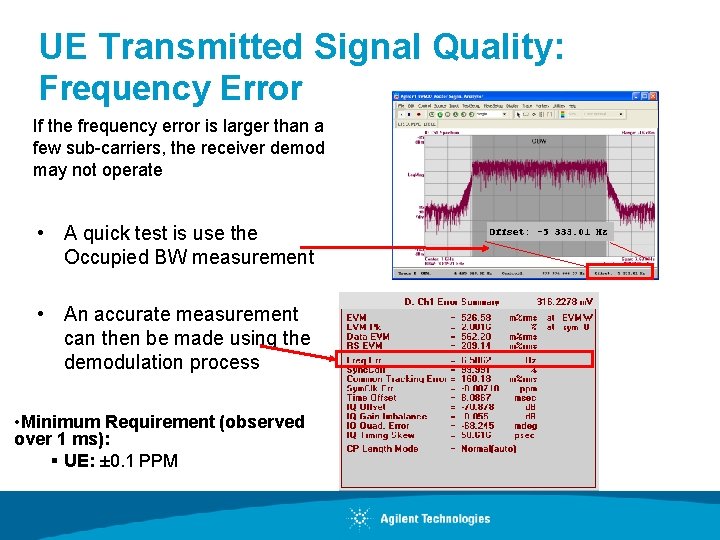
UE Transmitted Signal Quality: Frequency Error If the frequency error is larger than a few sub-carriers, the receiver demod may not operate • A quick test is use the Occupied BW measurement • An accurate measurement can then be made using the demodulation process • Minimum Requirement (observed over 1 ms): § UE: ± 0. 1 PPM
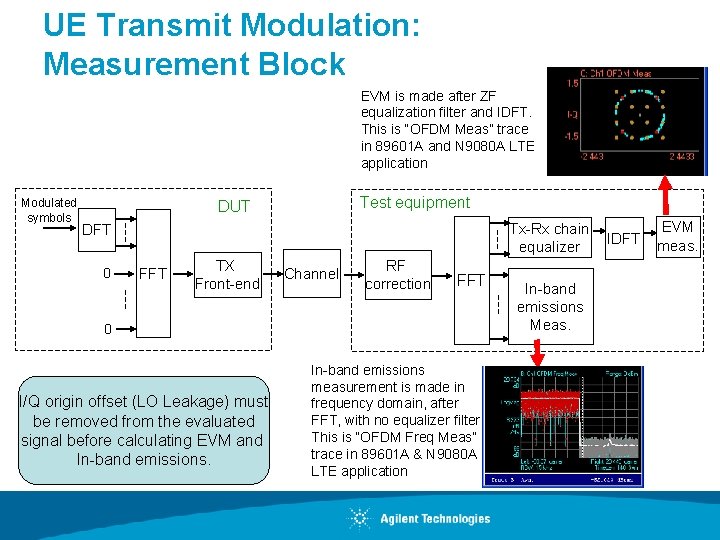
UE Transmit Modulation: Measurement Block EVM is made after ZF equalization filter and IDFT. This is “OFDM Meas” trace in 89601 A and N 9080 A LTE application Modulated symbols Test equipment DUT Tx-Rx chain equalizer DFT 0 FFT TX Front-end Channel RF correction FFT 0 I/Q origin offset (LO Leakage) must be removed from the evaluated signal before calculating EVM and In-band emissions measurement is made in frequency domain, after FFT, with no equalizer filter. This is “OFDM Freq Meas” trace in 89601 A & N 9080 A LTE application In-band emissions Meas. IDFT EVM meas.
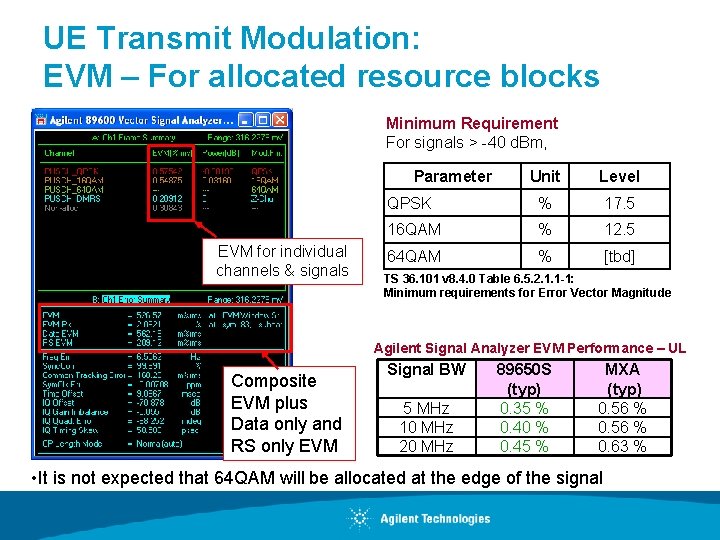
UE Transmit Modulation: EVM – For allocated resource blocks Minimum Requirement For signals > -40 d. Bm, Parameter EVM for individual channels & signals Unit Level QPSK % 17. 5 16 QAM % 12. 5 64 QAM % [tbd] TS 36. 101 v 8. 4. 0 Table 6. 5. 2. 1. 1 -1: Minimum requirements for Error Vector Magnitude Agilent Signal Analyzer EVM Performance – UL Composite EVM plus Data only and RS only EVM Signal BW 5 MHz 10 MHz 20 MHz 89650 S (typ) 0. 35 % 0. 40 % 0. 45 % MXA (typ) 0. 56 % 0. 63 % • It is not expected that 64 QAM will be allocated at the edge of the signal
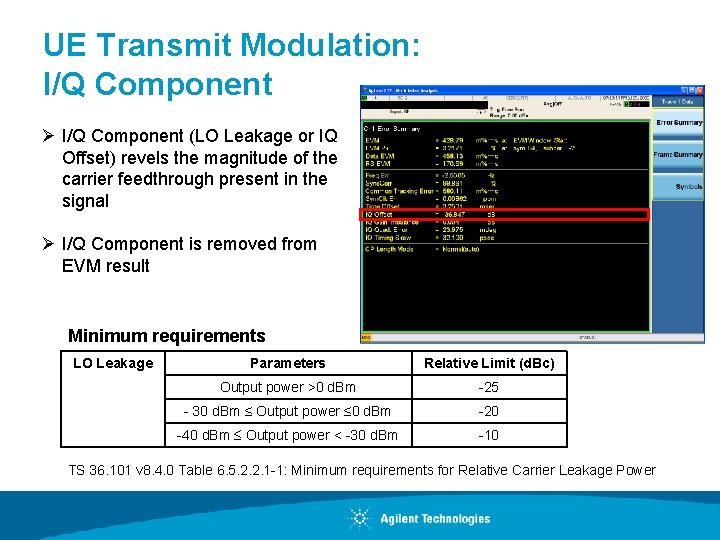
UE Transmit Modulation: I/Q Component Ø I/Q Component (LO Leakage or IQ Offset) revels the magnitude of the carrier feedthrough present in the signal Ø I/Q Component is removed from EVM result Minimum requirements LO Leakage Parameters Relative Limit (d. Bc) Output power >0 d. Bm -25 - 30 d. Bm ≤ Output power ≤ 0 d. Bm -20 -40 d. Bm Output power < -30 d. Bm -10 TS 36. 101 v 8. 4. 0 Table 6. 5. 2. 2. 1 -1: Minimum requirements for Relative Carrier Leakage Power
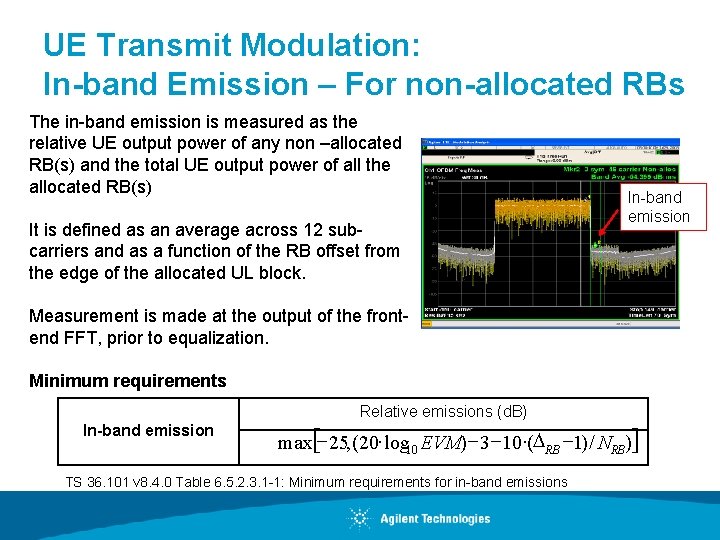
UE Transmit Modulation: In-band Emission – For non-allocated RBs The in-band emission is measured as the relative UE output power of any non –allocated RB(s) and the total UE output power of all the allocated RB(s) It is defined as an average across 12 subcarriers and as a function of the RB offset from the edge of the allocated UL block. In-band emission Measurement is made at the output of the frontend FFT, prior to equalization. Minimum requirements Relative emissions (d. B) In-band emission max[- 25, (20× log 10 EVM) - 3 -10 ×(DRB -1) / NRB)] TS 36. 101 v 8. 4. 0 Table 6. 5. 2. 3. 1 -1: Minimum requirements for in-band emissions
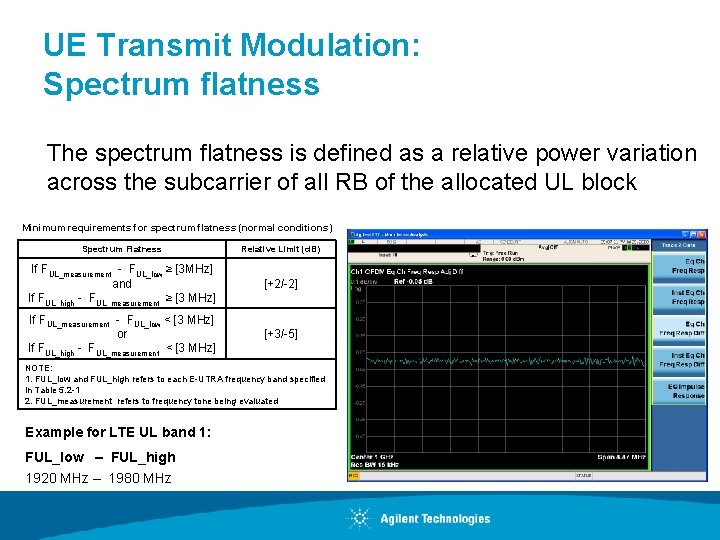
UE Transmit Modulation: Spectrum flatness The spectrum flatness is defined as a relative power variation across the subcarrier of all RB of the allocated UL block Minimum requirements for spectrum flatness (normal conditions) Spectrum Flatness Relative Limit (d. B) If FUL_measurement - FUL_low ≥ [3 MHz] and If FUL_high - FUL_measurement ≥ [3 MHz] [+2/-2] If FUL_measurement - FUL_low < [3 MHz] or If FUL_high - FUL_measurement < [3 MHz] [+3/-5] NOTE: 1. FUL_low and FUL_high refers to each E-UTRA frequency band specified in Table 5. 2 -1 2. FUL_measurement refers to frequency tone being evaluated Example for LTE UL band 1: FUL_low – FUL_high 1920 MHz – 1980 MHz
Agenda • List of LTE physical layer transmitter tests • LTE modulation quality test requirements – Downlink – Uplink • Modulation quality signal analysis and troubleshooting techniques • Appendix – LTE physical layer RF measurements
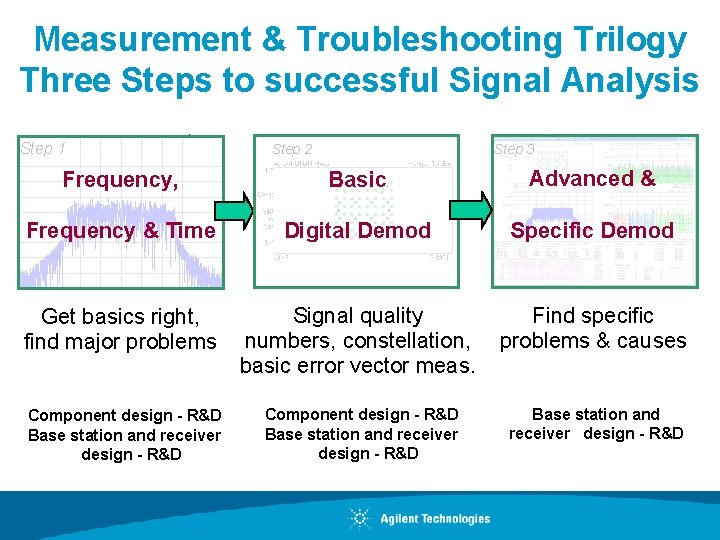
Measurement & Troubleshooting Trilogy Three Steps to successful Signal Analysis Step 1 Step 2 Step 3 Frequency, Basic Advanced & Frequency & Time Digital Demod Specific Demod Get basics right, find major problems Signal quality numbers, constellation, basic error vector meas. Find specific problems & causes Component design - R&D Base station and receiver design - R&D
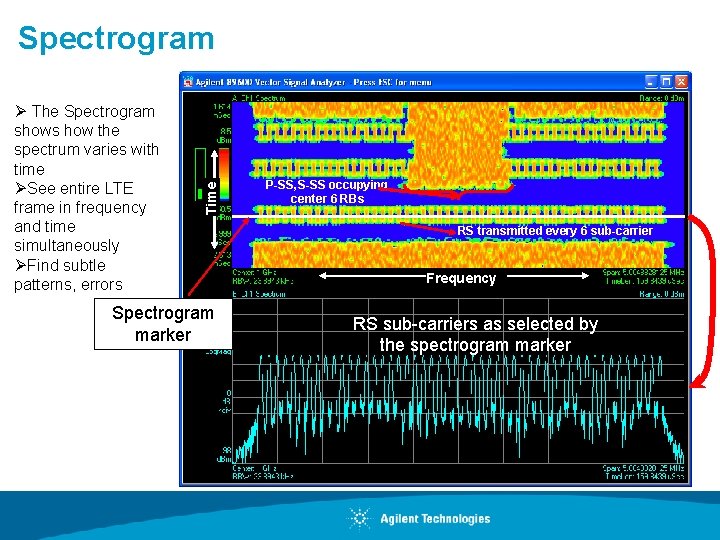
Ø The Spectrogram shows how the spectrum varies with time ØSee entire LTE frame in frequency and time simultaneously ØFind subtle patterns, errors Time Spectrogram marker P-SS, S-SS occupying center 6 RBs RS transmitted every 6 sub-carrier Frequency RS sub-carriers as selected by the spectrogram marker
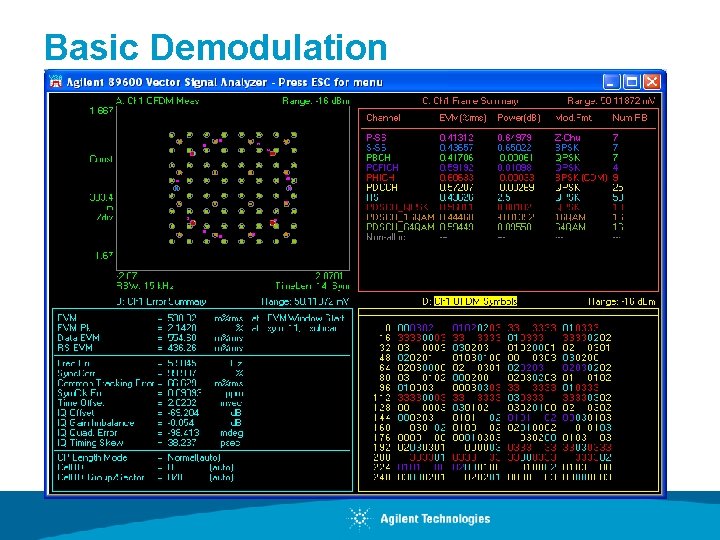
Basic Demodulation
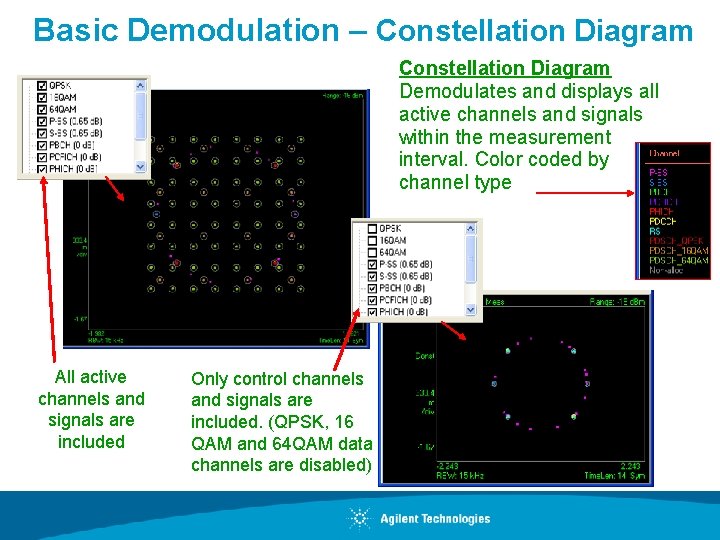
Basic Demodulation – Constellation Diagram Demodulates and displays all active channels and signals within the measurement interval. Color coded by channel type All active channels and signals are included Only control channels and signals are included. (QPSK, 16 QAM and 64 QAM data channels are disabled)
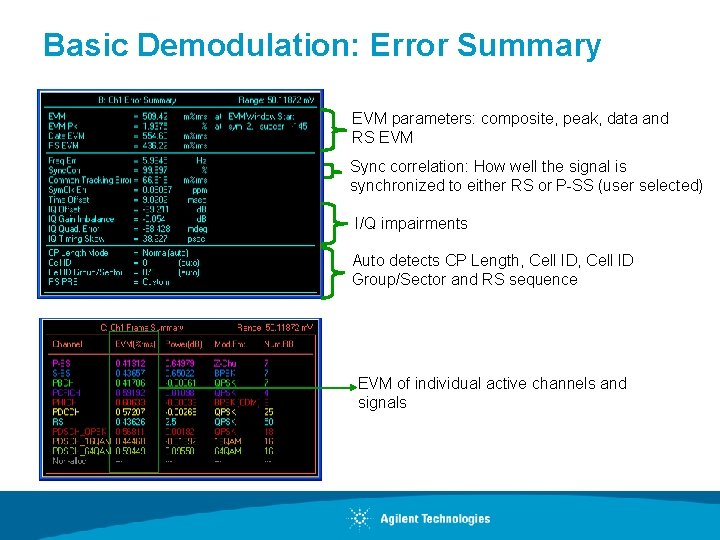
Basic Demodulation: Error Summary EVM parameters: composite, peak, data and RS EVM Sync correlation: How well the signal is synchronized to either RS or P-SS (user selected) I/Q impairments Auto detects CP Length, Cell ID Group/Sector and RS sequence EVM of individual active channels and signals
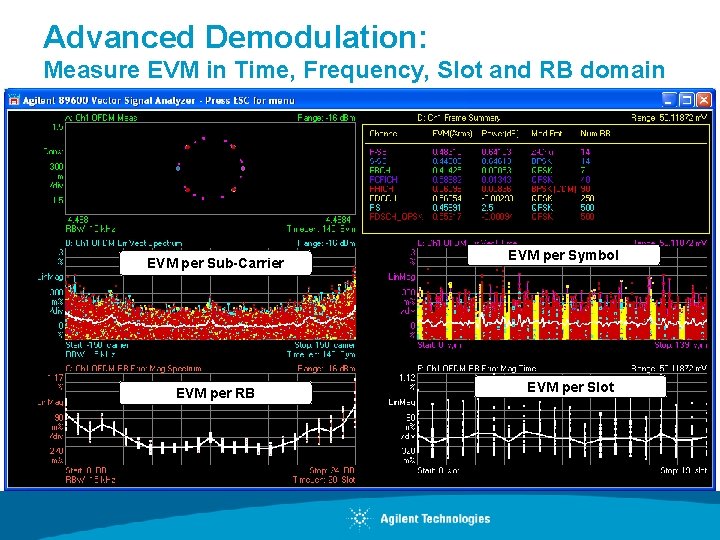
Advanced Demodulation: Measure EVM in Time, Frequency, Slot and RB domain EVM per Sub-Carrier EVM per RB EVM per Symbol EVM per Slot
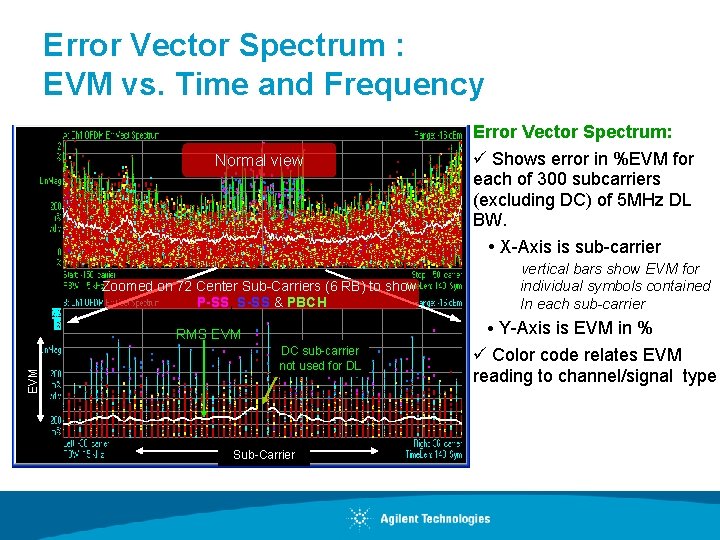
Error Vector Spectrum : EVM vs. Time and Frequency Normal view Error Vector Spectrum: ü Shows error in %EVM for each of 300 subcarriers (excluding DC) of 5 MHz DL BW. X-Axis is sub-carrier Zoomed on 72 Center Sub-Carriers (6 RB) to show P-SS, S-SS & PBCH Y-Axis is EVM in % RMS EVM vertical bars show EVM for individual symbols contained In each sub-carrier DC sub-carrier not used for DL Sub-Carrier ü Color code relates EVM reading to channel/signal type
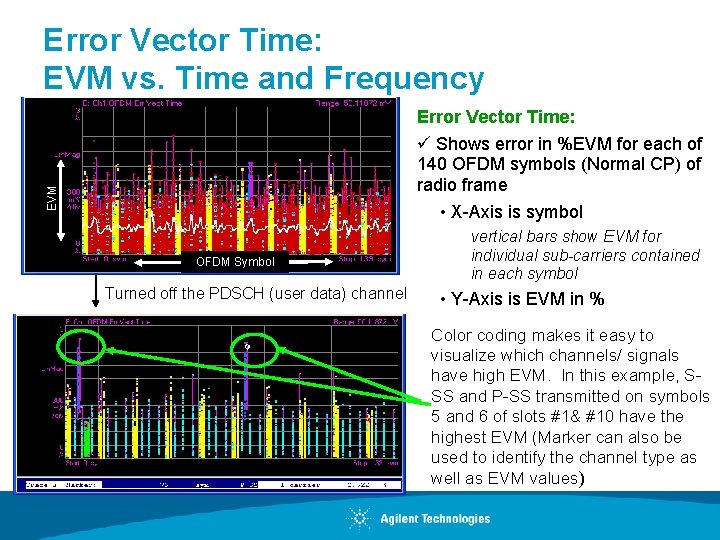
Error Vector Time: EVM vs. Time and Frequency EVM Error Vector Time: ü Shows error in %EVM for each of 140 OFDM symbols (Normal CP) of radio frame • X-Axis is symbol OFDM Symbol Turned off the PDSCH (user data) channel vertical bars show EVM for individual sub-carriers contained in each symbol • Y-Axis is EVM in % Color coding makes it easy to visualize which channels/ signals have high EVM. In this example, SSS and P-SS transmitted on symbols 5 and 6 of slots #1& #10 have the highest EVM (Marker can also be used to identify the channel type as well as EVM values)
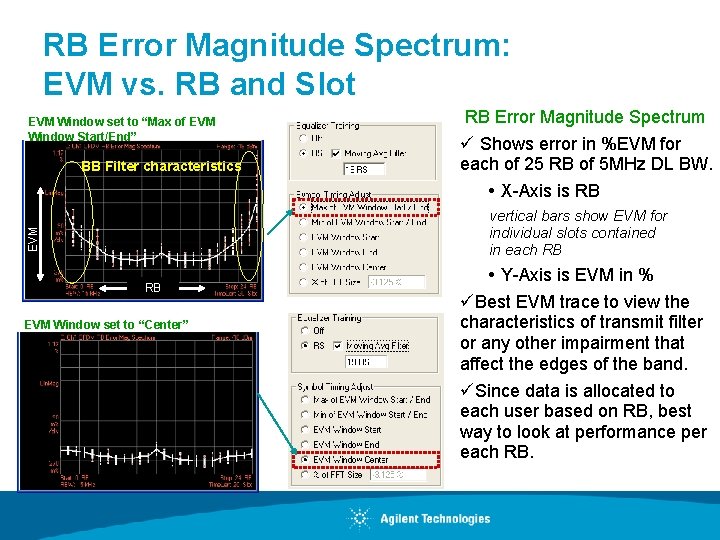
RB Error Magnitude Spectrum: EVM vs. RB and Slot EVM Window set to “Max of EVM Window Start/End” BB Filter characteristics RB Error Magnitude Spectrum ü Shows error in %EVM for each of 25 RB of 5 MHz DL BW. X-Axis is RB EVM vertical bars show EVM for individual slots contained in each RB RB EVM Window set to “Center” Y-Axis is EVM in % üBest EVM trace to view the characteristics of transmit filter or any other impairment that affect the edges of the band. üSince data is allocated to each user based on RB, best way to look at performance per each RB.
Agenda • List of LTE physical layer transmitter tests • LTE modulation quality test requirements – Downlink – Uplink • LTE signal generation techniques – Testing amplifiers – Testing receivers • Modulation quality signal analysis and troubleshooting techniques • Appendix – LTE physical layer RF measurements
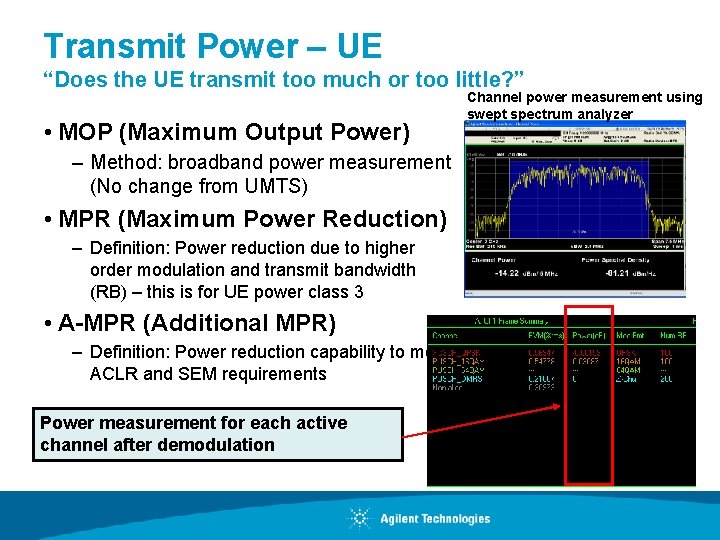
Transmit Power – UE “Does the UE transmit too much or too little? ” • MOP (Maximum Output Power) – Method: broadband power measurement (No change from UMTS) • MPR (Maximum Power Reduction) – Definition: Power reduction due to higher order modulation and transmit bandwidth (RB) – this is for UE power class 3 • A-MPR (Additional MPR) – Definition: Power reduction capability to meet ACLR and SEM requirements Power measurement for each active channel after demodulation Channel power measurement using swept spectrum analyzer
Output RF Spectrum Emissions Unwanted emissions consist of: 1. 2. Occupied Bandwidth: Emission within the occupied bandwidth Out-of-Band (OOB) Emissions – – 3. Adjacent Channel Leakage Power Ratio (ACLR) Spectrum Emission Mask (SEM) Spurious Emissions: Far out emissions
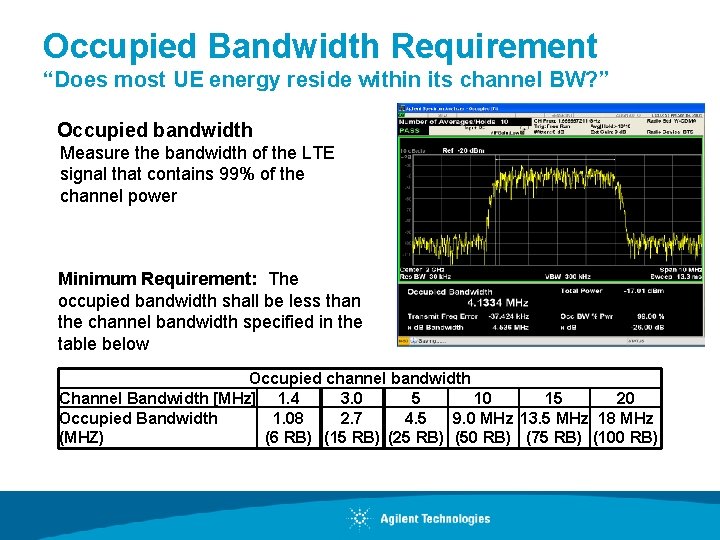
Occupied Bandwidth Requirement “Does most UE energy reside within its channel BW? ” Occupied bandwidth Measure the bandwidth of the LTE signal that contains 99% of the channel power Minimum Requirement: The occupied bandwidth shall be less than the channel bandwidth specified in the table below Occupied channel bandwidth Channel Bandwidth [MHz] 1. 4 3. 0 5 10 15 20 Occupied Bandwidth 1. 08 2. 7 4. 5 9. 0 MHz 13. 5 MHz 18 MHz (MHZ) (6 RB) (15 RB) (25 RB) (50 RB) (75 RB) (100 RB)
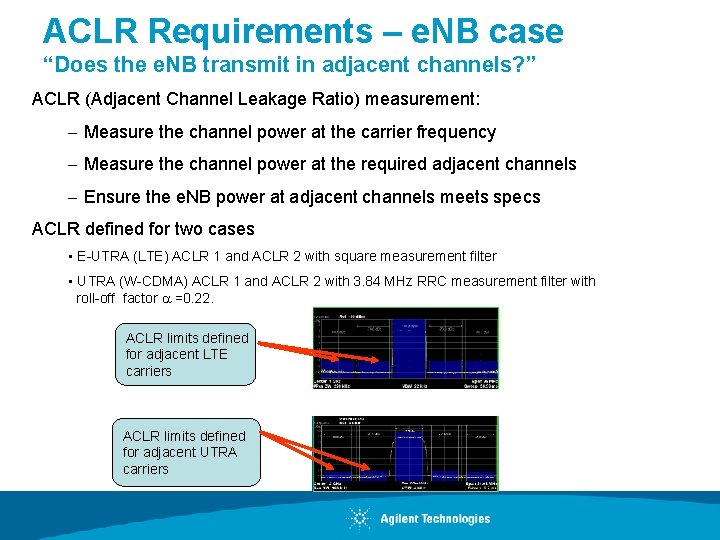
ACLR Requirements – e. NB case “Does the e. NB transmit in adjacent channels? ” ACLR (Adjacent Channel Leakage Ratio) measurement: - Measure the channel power at the carrier frequency - Measure the channel power at the required adjacent channels - Ensure the e. NB power at adjacent channels meets specs ACLR defined for two cases • E-UTRA (LTE) ACLR 1 and ACLR 2 with square measurement filter • UTRA (W-CDMA) ACLR 1 and ACLR 2 with 3. 84 MHz RRC measurement filter with roll-off factor =0. 22. ACLR limits defined for adjacent LTE carriers ACLR limits defined for adjacent UTRA carriers
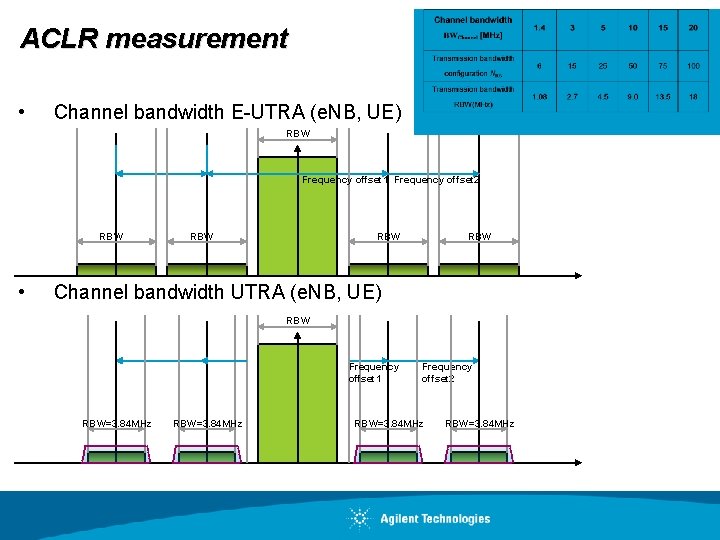
ACLR measurement • Channel bandwidth E-UTRA (e. NB, UE) RBW Frequency offset 1 Frequency offset 2 RBW • RBW RBW Channel bandwidth UTRA (e. NB, UE) RBW Frequency offset 1 RBW=3. 84 MHz Frequency offset 2 RBW=3. 84 MHz
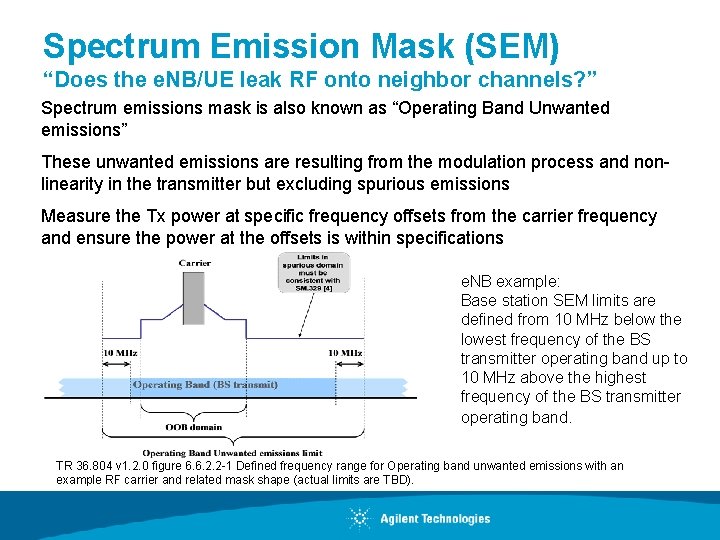
Spectrum Emission Mask (SEM) “Does the e. NB/UE leak RF onto neighbor channels? ” Spectrum emissions mask is also known as “Operating Band Unwanted emissions” These unwanted emissions are resulting from the modulation process and nonlinearity in the transmitter but excluding spurious emissions Measure the Tx power at specific frequency offsets from the carrier frequency and ensure the power at the offsets is within specifications e. NB example: Base station SEM limits are defined from 10 MHz below the lowest frequency of the BS transmitter operating band up to 10 MHz above the highest frequency of the BS transmitter operating band. TR 36. 804 v 1. 2. 0 figure 6. 6. 2. 2 -1 Defined frequency range for Operating band unwanted emissions with an example RF carrier and related mask shape (actual limits are TBD).
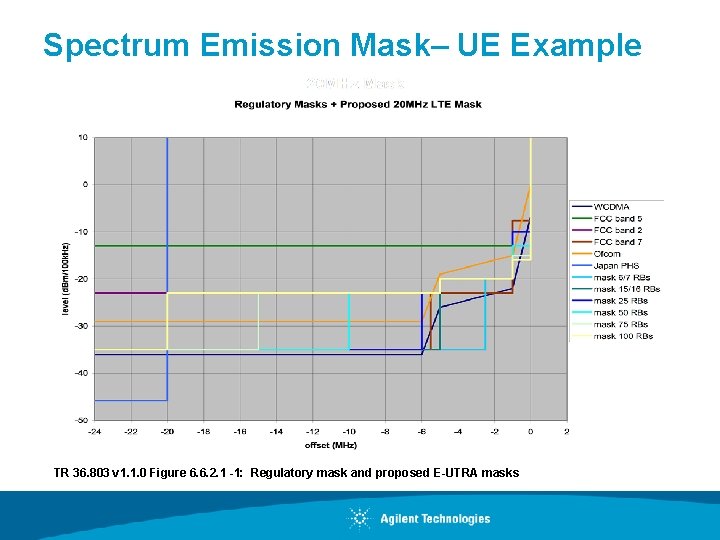
Spectrum Emission Mask– UE Example TR 36. 803 v 1. 1. 0 Figure 6. 6. 2. 1 -1: Regulatory mask and proposed E-UTRA masks
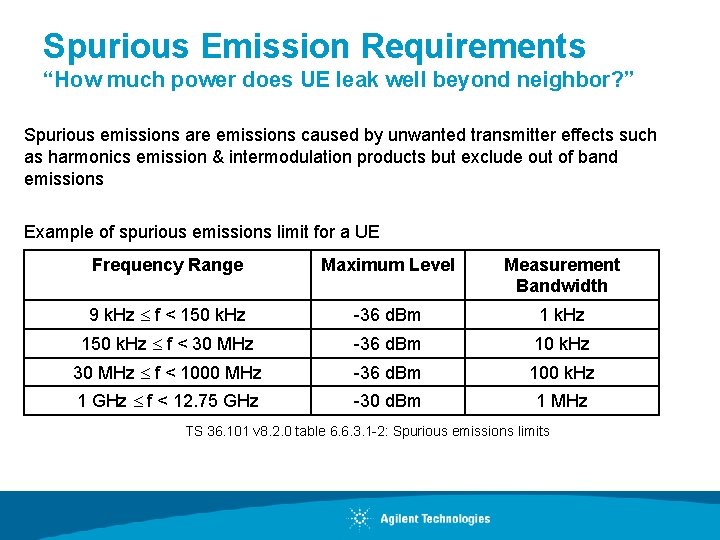
Spurious Emission Requirements “How much power does UE leak well beyond neighbor? ” Spurious emissions are emissions caused by unwanted transmitter effects such as harmonics emission & intermodulation products but exclude out of band emissions Example of spurious emissions limit for a UE Frequency Range Maximum Level Measurement Bandwidth 9 k. Hz f < 150 k. Hz -36 d. Bm 1 k. Hz 150 k. Hz f < 30 MHz -36 d. Bm 10 k. Hz 30 MHz f < 1000 MHz -36 d. Bm 100 k. Hz 1 GHz f < 12. 75 GHz -30 d. Bm 1 MHz TS 36. 101 v 8. 2. 0 table 6. 6. 3. 1 -2: Spurious emissions limits
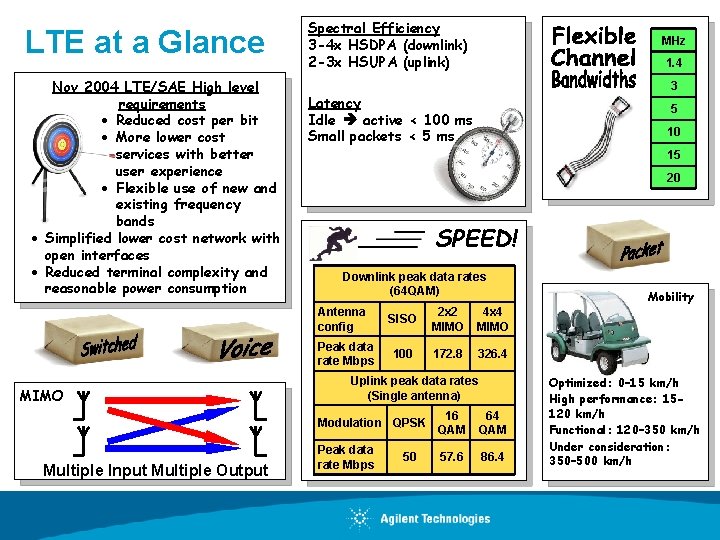
LTE at a Glance Nov 2004 LTE/SAE High level requirements · Reduced cost per bit · More lower cost services with better user experience · Flexible use of new and existing frequency bands · Simplified lower cost network with open interfaces · Reduced terminal complexity and reasonable power consumption Spectral Efficiency 3 -4 x HSDPA (downlink) 2 -3 x HSUPA (uplink) 3 5 10 15 20 S SPEED! Downlink peak data rates (64 QAM) Peak data rate Mbps Multiple Input Multiple Output 1. 4 Latency Idle active < 100 ms Small packets < 5 ms Antenna config MIMO MHz SISO 2 x 2 MIMO 4 x 4 MIMO 100 172. 8 326. 4 Uplink peak data rates (Single antenna) Modulation QPSK 16 QAM 64 QAM Peak data rate Mbps 57. 6 86. 4 50 Mobility Optimized: 0– 15 km/h High performance: 15120 km/h Functional: 120– 350 km/h Under consideration: 350– 500 km/h
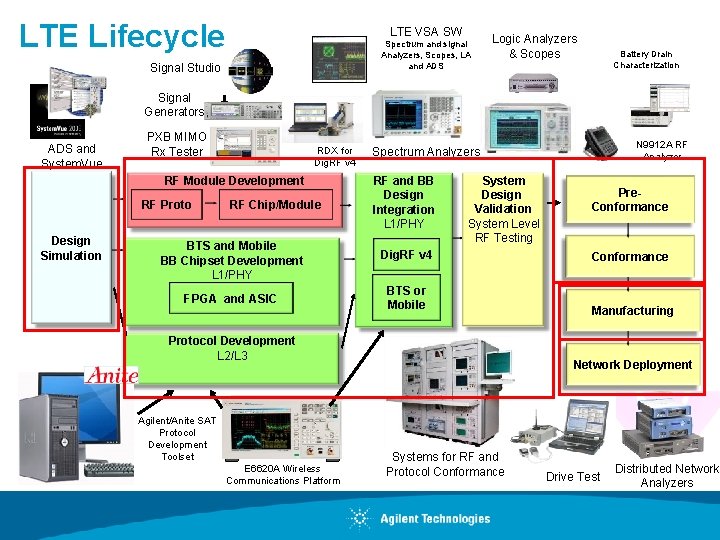
LTE Lifecycle LTE VSA SW Spectrum and signal Analyzers, Scopes, LA and ADS Signal Studio Logic Analyzers & Scopes Battery Drain Characterization Signal Generators ADS and System. Vue PXB MIMO Rx Tester RDX for Dig. RF v 4 RF Module Development RF Proto Design Simulation RF Chip/Module RF and BB Design Integration L 1/PHY BTS and Mobile BB Chipset Development L 1/PHY Dig. RF v 4 FPGA and ASIC BTS or Mobile System Design Validation System Level RF Testing Protocol Development L 2/L 3 Agilent/Anite SAT Protocol Development Toolset E 6620 A Wireless Communications Platform N 9912 A RF Analyzer Spectrum Analyzers Pre. Conformance Manufacturing Network Deployment Systems for RF and Protocol Conformance Drive Test Distributed Network Analyzers
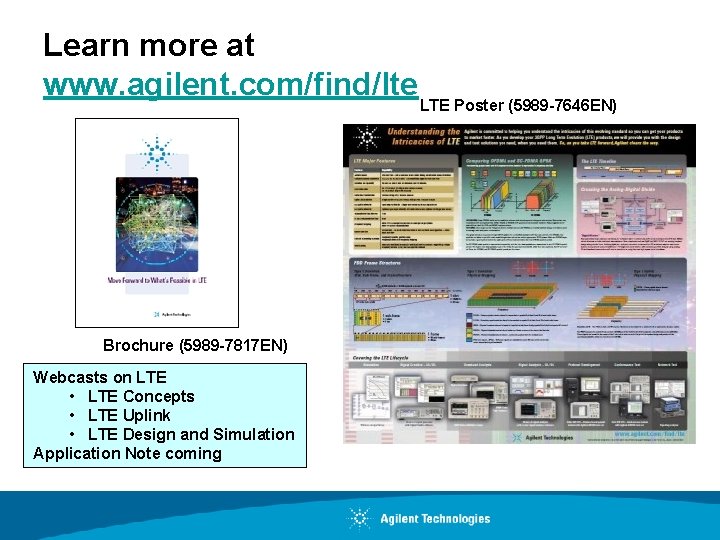
Learn more at www. agilent. com/find/lte LTE Poster (5989 -7646 EN) Brochure (5989 -7817 EN) Webcasts on LTE • LTE Concepts • LTE Uplink • LTE Design and Simulation Application Note coming