Computer Minitab and other printouts Yintercept Slope Standard

Computer, Minitab, and other printouts

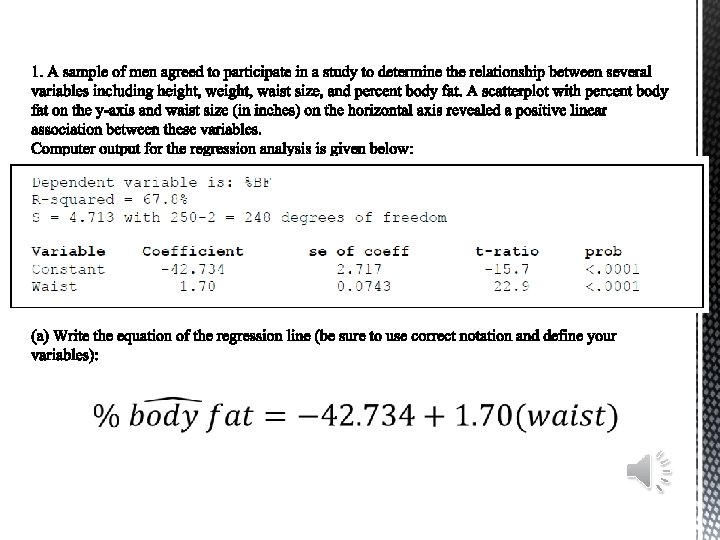
Y-intercept Slope Standard error t - statistic Correlation p - value

r 2 = 67. 8% of the variation in percent body fat can be explained by the variation in waist size.

The correlation of. 823 tells us that there is a fairly strong and positive relationship between percent body fat and waist size.

Residual = 10 – 16. 766 = - 6. 766

Total Variable Count Mean SE Mean St. Dev Variance Coef. Var Minimum Q 1 C 1 16 0. 3281 0. 0480 0. 1920 0. 0369 58. 51 0. 0300 0. 1300 Variable Median Q 3 Maximum C 1 0. 4100 0. 4650 0. 7000 Mean = 0. 3281 Median = 0. 4100

Total Variable Count Mean SE Mean St. Dev Variance Coef. Var Minimum Q 1 C 1 16 0. 3281 0. 0480 0. 1920 0. 0369 58. 51 0. 0300 0. 1300 Variable Median Q 3 Maximum C 1 0. 4100 0. 4650 0. 7000 Standard Deviation = 0. 1920 IQR = Q 3 – Q 1 = 0. 4650 – 0. 1300 = 0. 3350

Total Variable Count Mean SE Mean St. Dev Variance Coef. Var Minimum Q 1 C 1 16 0. 3281 0. 0480 0. 1920 0. 0369 58. 51 0. 0300 0. 1300 Variable Median Q 3 Maximum C 1 0. 4100 0. 4650 0. 7000 Use the IQR = 0. 3350. IQR X 1. 5 = 0. 3350 X 1. 5 = 0. 5025 Q 3 + 0. 5025 = 0. 9675 Q 1 – 0. 5025 = - 0. 3725 Compare to Minimum and Maximum values. If either are outside of this range, there are outliers. If not, there aren’t any. Because Min = 0. 0300 and Max = 0. 7000, there are no outliers.
- Slides: 9