Computer Graphics Assignment 10 marks l With suitable

Computer Graphics

Assignment— 10 marks l With suitable diagrams write a note on the working of following input/output interactive graphics devices l l l Touch Screen Light Pen Joystick Scanner Mechanical and optical mouse Touch Pad

Assignment— 10 marks contd… l l l WAP to draw basic shapes in C WAP program in C to animate a ball in circular motion using putimage/getimage functions and without putimage/getimage functions. Implement bresenham’s midpoint line drawing algorithm in C Implement bresenham’s midpoint circle drawing algorithm in C. WAP in C to perform free hand drawing using mouse functions.

Computer Graphics l l l Till recently the output obtained from a computer has been alphanumeric. It is well known that anything presented in graphical and pictorial form tremendously aids human comprehension. Examples: l l l bar charts, pie charts sales graphs are commonly used by managers. Building plans, perspective views are used by architects. Engineers use mechanical drawings, circuit diagrams in their work.

Chinese proverb “a picture is worth ten thousand words”

Computer Graphics l l l Computer graphics is concerned with the generation, representation, manipulation and display of pictures with the aid of a computer. The Process transforms and presents information in a visual form. Image created by computer is called computer graphics.

Computer Graphics Applications l Computer Graphics may be subdivided into three broad areas: l l l Generative Graphics Cognitive Graphics Image Processing

Generative Graphics system objectives: l It deals with the creation of 2 D and 3 D pictures. l Computer aided generation of pictures from mathematical representation l For display animations, pictures may be transforms, rotated, contracted & expanded.

Applications Of Generative Graphics � Pilot Training: In pilot training the graphic display may be used to mimic the approach of an aircraft to an airstrip as the pilot manipulates the landing controls. � CAD: Design Electrical, Electronic, Mechanical and Structural components and systems. Design Circuits port layouts, VLSI chips, Aircrafts structures and Buildings structures. � CAM: Manufacturing information (such as parts list etc) are automatically generated. The great advantage of computer graphics is the possibility of very quickly modifying drawings based on drawing changes

COGNITIVE GRAPHICS l l It deals with algorithms to recognize and classify pictures. Applications are : l l l Classify peoples’ faces , fingerprints is commonly used now a days in criminal investigation. Microscope pictures of bacterial colonies ECG patterns and x-rays of different parts of the body to perform medical diagnosis of patient by using computers. etc. In such applications, the pictures are converted to digital form by devices called optical scanners The digital information is transformed and classified by specially written pattern recognition programs.

IMAGE PROCESSING GRAPHICS l l l Image processing apply techniques to modify or interpret existing pictures, such as photographs and TV scans. It is used to improve and modify the quality of picture. First image is digitized and there it is given a color pattern for improving color quality. l l For example : Boundaries making, if it is not visible. Two principle uses of image processing are: Ø Ø Improving picture quality. Machine perception of visual information as used in robotics.

IMAGE PROCESSING GRAPHICS l l Image processing are used to analyze satellite photos of earth and photos of galaxies. Medical applications also use extensive use of image processing techniques for picture enhancement, in tomography, in simulation of operation. Image processing has the sub areas like image enhancement, pattern detection and recognition and scene analysis and computer vision. Application of image processing are: face detection, feature detection, medical image processing, microscope image processing, remote sensing and many others.

Image processing l l l Image processing applies techniques to modify or interpret existing pictures , such as photographs and TV scans. Principle applications of image processing is in following areas To improve picture quality l l l To extract information from pictures To help in m/c perception of visual information e. g. in robotics To apply image processing , the picture of first digitized into an image file then digital methods are used to rearrange the picture parts, enhance color separation or to improve quality of shading

l l Computer graphics is concerned with the generation, representation, manipulation and display of pictures with the aid of a computer. Typical graphics system comprises of a host computer with support of fast processor, large memory, frame buffer and l l l Display Devices (color monitors) Input Devices (mouse, keyboard, joystick, trackball, touch screen etc. ) Output Devices (LCD panels, printers, plotters etc)

Conceptual frame work for interactive graphics Application Model Application Program Graphics System

Representative Uses & advantages of computer graphics

GUI Interfaces l Graphical User Interface l Typical components used § § § § § Menus Icons Cursors Dialog boxes Scroll bars Buttons Valuators Grids Sketching( used to draw lines, polylines, arcs, ellipses )

GUI Interfaces l l Most applications have user interfaces on desktop window system to manage multiple simultaneous activities. point – and –click facilities to allow users to select menu items, icons , and objects on the screen Icons and menus take up less space and are also intuitive. E. g. Word-processing, spread sheet and desktop publishing etc.
 plotting l Today graphics is used to create 2 D and 3")
( Interactive) plotting l Today graphics is used to create 2 D and 3 D graphs of mathematical, physical and economic functionsl l l in business, science, & technology Histograms bar and pie chart task scheduling charts Inventory and production charts All these are used to represent meaningfully and concisely the trends from data That clarify complex phenomena and ease the decision making

Office automation and electronic publishing l Office automation and electronic publishing can produce both printed( hardcopy) documents and electronic (softcopy) documents that contain l l Text Tables Graphs Other forms of drawn or scanned –in graphics
 is the")
Computer –aided design and drafting ¦ ¦ ¦ Computer aided design (CAD) is the use of computer technology for the process of design. or, Computer Aided Designing describes the process of designing with a computer. CAD software, or environments, provide the user with input-tools for the purpose of design processes, drafting, documentation, and manufacturing processes. It helps to perform design adjustments and quickly visualize effects Some applications also allow real time animation to test performance of the product 3 D realistic images, multiple angle views , greatly simplifies the design process.

Computer –aided design and drafting ¦ ¦ It is used to design components and systems of After objects are designed the utility programs can post process the design database to make part lists, to process bills of materials etc. Mechanical Electronic devices Electrical Electromechanical Structures such as l l l l Buildings Automobiles bodies Airplane Ship hulls VLSI chips Optical systems Computer network

Computer graphics in CAD ¦ ¦ In CAD graphics is used to design electrical, electronic, mechanical and structural components and systems. It is extensively used in designing printed circuit board layouts, design of VLSI chips. It is also used in making aircraft structures, building structures based on the drawing. A common problem in visualization applications is the display of one surface overlying another. These systems are used to visualize any 3 D objects by the use of computer soft -wares and is used in major designing such as car designing , machine designing etc.

Simulation l l To study abstract mathematical models of such phenomena as fluid flow , relativity, nuclear and chemical reactions etc. Pilot training

Entertainment l l Computer graphic is extensively used in the production of motion pictures, music, videos and TV shows. Sometimes graphic scenes are displayed by themselves and sometimes graphic objects are combined with actors and live scenes Image processing techniques such as morphing can be used to produce transformation of one person or object in another A graphics scenes generated for the movie AVTAAR.

Education and Training l l l Computer generated model of physical, financial and economic system are useful educational aid. They find wide use in education and training institution. Special simulation aids are also made for specialized area for providing training for aircraft pilot, ship captains etc.

Presentation Graphics l l l Reports can be presented on slides and transparencies. They can be used to present scientific, mathematical and economic data using different kind of figures, graphics and charts. 3 D graphics can also be used to provide special effects and more attractive presentations.

Pixels & Resolution l Pixels l l l Graphic images are made up of tiny dots called pixels. Each pixel has a particular address on the screen. Resolution l l It is defined as the maximum number of pixels or dots can be displayed on the screen. Examples: 800 by 600 pixels, 1024 by 768 pixels, 1152 by 864 pixels etc.

Code Name Aspect ratio Width Height XGA e. Xtended Graphics Array 4: 3 1024 768 XGA+ e. Xtended Graphics Array Plus 4: 3 1152 864 WXGA Widescreen e. Xtended Graphics Array 16: 9 1280 720 WXGA Widescreen e. Xtended Graphics Array 16: 10 1280 800 SXGA (UVGA) Super e. Xtended Graphics Array 4: 3 1280 960 SXGA Super e. Xtended Graphics Array 5: 4 1280 1024 HD High Definition 16: 9 1360 768 HD High Definition 16: 9 1366 768 WXGA+ Widescreen e. Xtended Graphics Array Plus 16: 10 1440 900 HD+ High Definition Plus 16: 9 1600 900 UXGA Ultra e. Xtended Graphics Array 4: 3 1600 1200 WSXGA+ Widescreen Super e. Xtended Graphics Array Plus 16: 10 1680 1050 FHD (Full HD) Full High Definition 16: 9 1920 1080 WUXGA Widescreen Ultra e. Xtended Graphics Array 16: 10 1920 1200 QFHD Quad Full High Definition 16: 9 2560 1440 Other

Aspect Ratio l l l The aspect ratio of an image describes the proportional relationship between its width and its height. It is represented as two numbers separated by a colon as 4(Width): 3(Height), 16: 9 etc. A square has the smallest possible aspect ratio 1: 1. For an ellipse, the aspect ratio denotes the ratio of the major axis to the minor axis. An ellipse with an aspect ratio 1: 1 is a circle

BIT DEPTH COLOR RESOLUTION CALCULATION 1 -bit 2 colors 21 2 -bit 4 colors 3 -bit 8 colors 23 (2 x 2 x 2) 4 -bit 16 colors 24 (2 x 2 x 2 x 2) 5 -bit 32 colors 25 (2 x 2 x 2) 6 -bit 64 colors 26 (2 x 2 x 2 x 2) 7 -bit 128 colors 27 (2 x 2 x 2 x 2) 8 -bit 256 colors 28 (2 x 2 x 2) 16 -bit 65, 536 colors 216 24 -bit 16, 777, 215 colors 224 22 (2) (2 x 2)

Display Devices CRT, EGA/CGA/VGA/SVGA monitors, plotters, laser printers, films, flat-panel devices, video digitizers, scanners, LCD panels, keyboard, joystick, mouse, touch screen, track ball etc. Commonly used display device is the MONITOR or CRT MONITOR
 Calligraphic")
Types of CRT Display Devices l l l DVST( Direct View Storage Tube) Calligraphic or Random Scan Display System Refresh and Raster Scan Display System Commonality between these three devices is they all are based on CRT technology

CRT Technology Operation an electron gun with an accelerating anode
,")
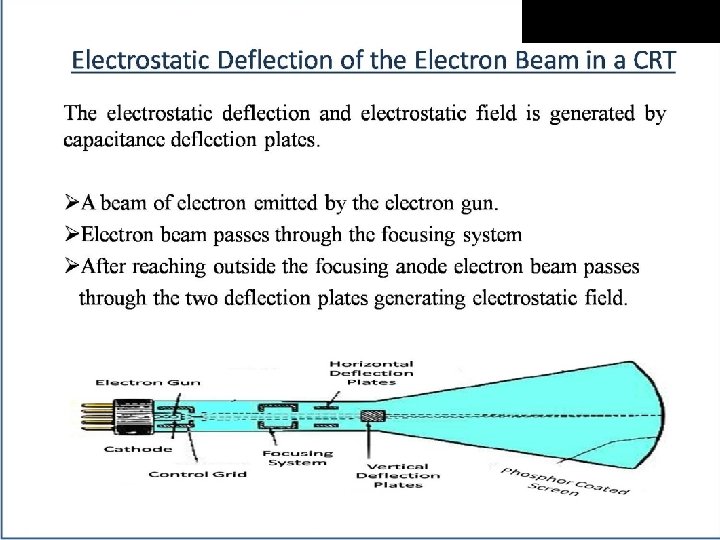
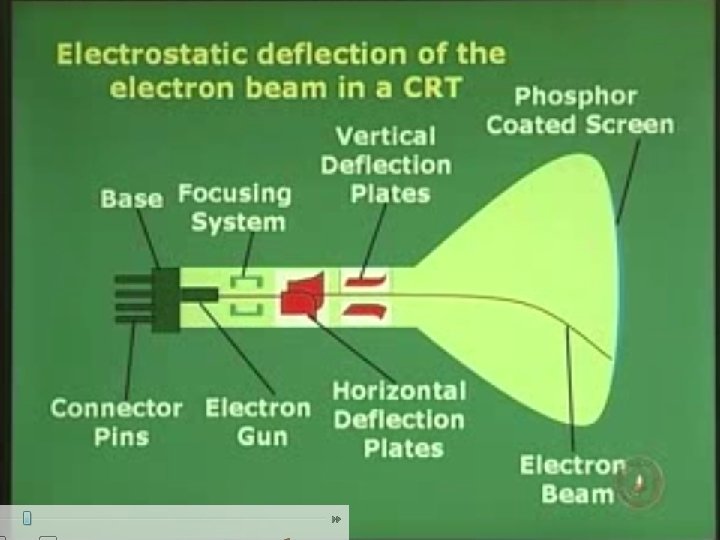
Operation an electron gun with an accelerating anode In a CRT (Cathode Ray Tube), you have heating filament which is responsible to heat up the cathode element of the CRT that is what generates the electrons or you can say when heating filament heat up the cathode electrons simply boil off from the cathode and these electrons are guided by the set of devices which are cylindrical in nature and helps the electron beam to reach to the screen. Emitted electron beam must have the following properties: 1. It must be accurately focused so that it produce the sharp spot of light where it strikes the phosphor. 2. It must have high velocity since brightness depends on the velocity of the beam.

Operation an electron gun with an accelerating anode We have three functions ¦Control Grid ¦Focusing Anode ¦Accelerating Anode

What does the control grid do? l l l When you observe a picture on screen in some parts of the picture may be bright or some picture may be dark. This brightness or darkness is the illumination or intensity on the screen is basically controlled by the intensity of the beam which strikes the particular point on the screen This intensity of the screen is controlled by controlling intensity of the electrons or electron beam coming out of the cathode.

What does the control grid do? l l l Electron beam coming out of the cathode is negatively (-ve) charged. Control grid is also negatively (-ve) charged. It is a high –ve voltage applied to the control grid If both are –vely charged so they repel each other. The amount of voltage at the control grid will essentially allow a certain amount of electrons to pass through the control grid So, we can say the number of electrons pass through the control grid is controlled by the voltage applied on the control grid.

What does the control grid do? l l So, if you reduce the amount of voltage on the control grid , you will allow large number of electrons to pass through the control grid and the intensity of beam will be higher so, the illumination or intensity on the screen will also be higher. and vice-versa

Focusing Anode & Accelerating Anode , unlike the control grid these are +vely charged or +ve voltage

Focusing Anode & Accelerating Anode l Focusing Anode l l helps us to focus the electron beam on the particular location of the screen Accelerating Anode l is required to strike the electron beam on to the screen with a very high speed or velocity to emit light.

l l Till now you can see the electron beam is going straight and will be able to hit the centre of the screen But the screen is the rectangular matrix. To create a picture, this beam should move all over the screen. So, you need horizontal deflection as well as vertical deflection so that you can cover the entire screen.

Basic Design of Magnetic Deflection CRT

Magnetic Deflection l l This beam is deflected by magnetic deflection coils which is available on the top and bottom and also on other side of the CRT Magnetic deflection coils generates the magnetic field which deviate the electron beam.

NOTE: The voltages used for deflection are generated by the display controller from digital values provided by the computer. These values normally represent co-ordinates that are converted into voltages by digital-toanalog converter
 TV system uses deflection system uses capacitive plates electromagnetic")
Oscilloscope deflection (CRO) TV system uses deflection system uses capacitive plates electromagnetic

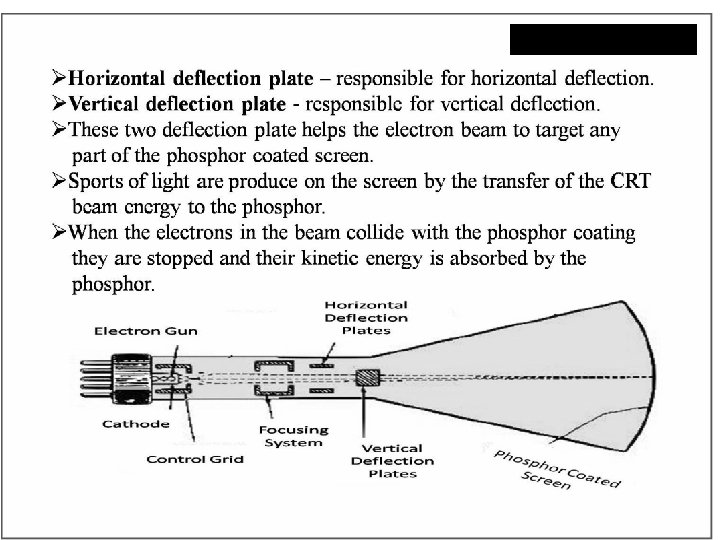
Basic Operation l l l The beam of electrons emitted by an electron gun passes through focusing and deflection system that directs the beam toward specified positions on the phosphor coated screen The phosphor glows when electron beam strikes it. Because light emitted by the phosphor fades very rapidly, a steady picture is maintained by tracing it out repeatedly. This is called refreshing

Refreshing Redraw the picture repeatedly by quickly directing the electron beam back over the same points. This is called refreshing

Properties of phosphor

Properties of phosphor ¦ ¦ ¦ Persistence: -it is defined as time taken for brightness to drop to 1/10 th of its initial value that means how long they continue to emit light. Or, It is defined as the time from the removal of excitation to the moment when phosphorescence has decayed to 10 % of the initial light output. E. g. most phosphors used in graphics equipment it is usually 10 to 60 microseconds. ¦ A phosphor with low persistence is useful for animation. ¦ A phosphor with high persistence is useful for displaying highly complex, static pictures

Properties of phosphor Color: -phosphors are generally available in blue, green & white colors. ¦ Grain size: -grain size is the size of pixels ¦ e. g. if grain size is small pixel will be more. To produce higher resolution grain size must be small. ¦ Efficiency: -it is defined as the amount of electrical energy converted into light energy in which some energy is lost as heat. ¦ Resistance: - To burning under long excitation is an important property of phosphor ¦

l l Note: Any given phosphor has several different quantum levels to which electrons can be excited, each corresponding to a color associated with the return to an unexcited state. Further , electrons on some levels are less stable and return to unexcited state more rapidly than others.

PHOSPHORENCE ¦Phosphorescence is the light given off by the return of relatively more stable(elements that have full outer shell) excited electrons to their unexcited state once the electron beam excitation is removed. ¦With typical phosphors, most of the light emitted is phosphorescence. ¦It is a specific type of photoluminescence related to fluorescence. ¦A phosphorescent material does not immediately re-emit the radiation it absorbs.

FLUORESCENCE ¦A phosphor’s fluorescence is the light emitted as these very unstable electrons lose their excess energy while the phosphor is being struck by electrons. ¦Fluorescence occurs where the energy is supplied by electromagnetic radiation, usually ultraviolet light. The energy kicks an electron of an atom from a lower energy state into an “excited” higher energy state, then the electron releases energy in the form of light when it falls back to a lower energy state.

Refresh Rate l l l Refresh rate of a CRT is the number of times per second the image is redrawn. It is typically 60 per second for raster displays. Refresh rate to avoid flickering – 60 Hz. A flicker free picture appears constant or steady to the viewer. Reducing the refresh rate increases flicker As the refresh rate decreases, flicker develops because the eye can no longer integrate the individual light impulses coming from a pixel.

Critical Fusion Frequency l l The refresh rate above which a picture stops flickering and fuses into a steady image is called Critical Fusion Frequency (CFF). Very high intensity images requires refresh rate of 80 to 90 Hz.

l l l Note: Refresh rate of raster scan display is usually at least 60 frames per second and is independent of picture complexity Refresh rate of vector systems depends directly on the picture complexity (no. of lines , points and characters) Greater the complexity, longer the time taken by a single refresh cycle and lower the refresh rate.

DVST Collector

DVST l l l l The DVST behaves like a CRT with long persistence. A line remains visible for up to an hour before it starts to fade. The writing beam does not write directly on the phosphor but a fine mesh wire grid coated with dielectric( electrical insulator) A pattern of +ve charges is deposited on the grid A continuous flood of electrons is emitted by the electron gun. These flood electron transfers the pattern of charges from the grid to the phosphor. Just behind the storage mesh is a second grid which is called a collector which makes the flow of flood electrons smooth. Where there is +ve charge on the mesh the electrons are attracted and pass through it to strike the phosphor.

Advantages l l It offers the flat screen It is a CRT with long persistence phosphor It provides flicker free display No refreshing is necessary

Limitations l l l Very limited interactive support Modifying any part of the image requires redrawing the entire image. So, animation is ruled out in case of DVST. Change in the image requires to generate a new charge distribution in the DVST Slow processing of drawing(typically a few seconds are necessary for a complex picture) Erasing takes about 0. 5 seconds. Selected parts of the picture can't be erased. All lines and characters must be erased. Only single intensity is possible. The DVST can’t display multiple colors.

RASTER SCAN DISPLAY

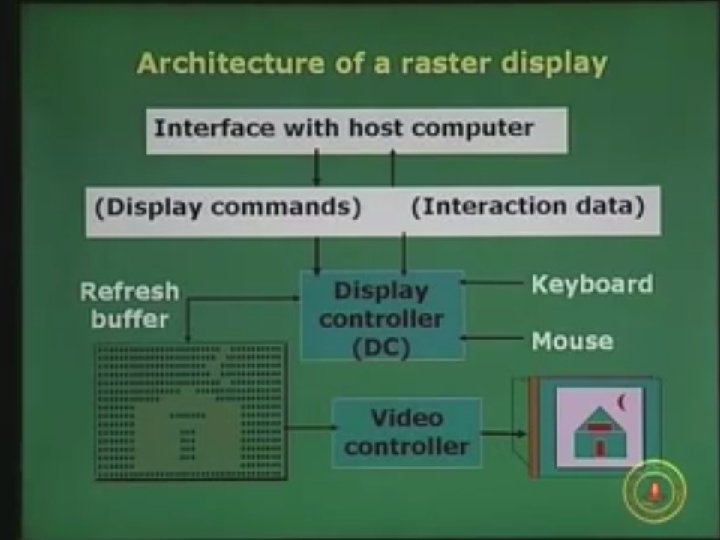
Raster Scan Display l l l Used in television screens Unlike DVST and random scan display which were line drawing , refresh CRT is point- plotting device. Raster displays stores the display primitives (lines, characters, shaded & patterned areas) in refresh buffer. The image is displayed on the screen as a succession of scan lines where each scan line is made up of several pixels. The picture definition is stored in the memory are called the Refresh Buffer or Frame Buffer as rectangular matrix containing intensity value for each dot or pixel on the screen. Or, you can say the refresh buffer stores the drawing primitives in terms of points and pixel components.

Raster Scan Display l l l l l As the electron beam moves across each row, the beam intensity is turned on or off depending on the value of each pixel. In a simple black and white system , each screen point is either on or off i. e. only one pixel is needed. For complex systems displaying several colors, additional bits are required i. e. high color quality system use 24 bits per pixel. Frame buffer which uses one bit per pixel is called bitmap Frame buffer which uses multiple bits per pixel is called pix-map Entire image is scanned out sequentially by the video controller( one raster line at a time) Raster lines are scanned from top to bottom and then back to top Causes the effect of jaggies or staircase effects It is suitable for realistic display of scenes containing different color patterns and shading.

HORIZONTAL RETRACE & VERTICAL RETRACE l l At the end of each scan line, the electron beam returns to the left side of the screen to begin displaying the next scan line. The return to the left of the screen, after refreshing each scan line is called the horizontal retrace. And at the end of each frame, the electron beam returns to the top left corner of the screen to begin the next frame is called the vertical retrace

Fig. shows horizontal and vertical retrace l Starting at the top-left of the screen and going to the bottom-right, the electron beam is turned on a line at a time (1), then turned off to go back to the next line (2), then off once again to go back up to the top (3).

Raster scan display system draws a discrete set of points
 General Lines (b) Special Cases")
Rasterisation (a) General Lines (b) Special Cases

CPU Peripherals System bus System memory Video controller Architecture of a Simple Raster Graphics System CRT

Peripherals CPU System bus System memory Frame buffer Video controller CRT Architecture of a Simple Raster Graphics System with a fixed portion of the system memory reserved for the frame buffer

MEMORY Logical Organization of the video controller

Logical Organization of the video controller l l l Assume that the frame buffer is addressed in x 0 to xmax and in y from 0 to ymax. Then , at the start of a refresh cycle, the X register is set to zero and Y register is set to ymax (the top scan line). As the first scan line is generated, the X address is incremented up through xmax. Each pixel value is fetched and is used to control the intensity of the CRT beam. After the first scan line, the X address is reset to zero and the Y address is decremented by one. The process continues until the last scan line (y=0) is generated
")
ARCHITECTURE OF RASTER SCAN DISPLAY (WITH DISPLAY PROCESSOR)

CPU DISPLAY PROCESSOR MEMORY FRAME BUFFER PERIPHERAL DEVICE SYSTEM MEMORY VIDEO CONTROLLER CRT

A single bit-plane black & white frame buffer raster CRT graphics device.

An N-bit plane gray level frame buffer

Simple color frame buffer

A 24 -bit-plane color frame buffer

Memory Usage l l l If one uses a 512ˣ 512 element, then 218 bits are necessary in a single bit plane. Memory size required = 32 KB A DAC (digital to analog converter) is used to convert the bit value (0, 1) to analog signals for refreshing the screen

Memory Size Required for N-bit plane N Display Color Memory Size 1 Black & White 128 KB 8 256 1 MB 24 16 million colors 3 MB 32 16 million colors 4 MB If one uses 1024ˣ 1024 high resolution CRT

Random Scan Display l l l Also called vector, stroke, line drawing displays. Characters are also made of sequences of strokes (or short lines). Vectored-because electron beam is deflected from end point( vector type of movement ) In random scan display the electron beam is directed only to those parts of screen where picture is to be drawn. Order of deflection is dictated by the arbitrary order of the display commands. The picture is drawn one line at a time and therefore these monitors are also called as “Vector Displays”. The picture definition is stored as a set of line drawing commands in an area of memory called as “Refresh Buffer” or “Refresh Display File”. To display a specified picture the system cycles through a set of commands stored in a display file. After all commands are processed , the system cycle back to the first line command to refresh cycle. Refresh rate is 30 -60 times/sec. It is suitable for line drawing applications but can’t display realistic shaded pictures or scenes.

Block Diagram of Calligraphic Refresh Display Host CPU CRT Display Buffer Vector Generator Display Controller Display Processor

l l The display processor sends digital and point co-ordinate values to vector generator. Vector generator needs the co-ordinate values as well as the intensity value to draw any object. The vector generator converts the digital coordinates values to analog voltages for the beam deflection circuits. Scope of animation is available.


Images l l ¦ An image is a spatial representation of an object, a two dimensional or three dimensional scene or another image. In computer graphics , an image is always a digital image When we generate with the help of computer graphics then two types of images are available: ¦ ¦ BITMAP IMAGES VECTOR IMAGES

Bitmap Images l l l Bitmaps are an image type most appropriate for photo-realistic images and complex drawings require fine details. A bitmap image is simple information matrix describing the individual dots of an image called pixels. The bit-depth determines the number of colors that can be displayed by an individual pixel. We can grab a bitmap image from a screen, scan it with a scanner , download it from a website, or capture it from a video capture device. Limitations: l Large file sizes l Inabilty to scale or resize the image easily while maintaining quality.

Vector Images l l l Vector images are most appropriate for lines , boxes, circles, polygons and other graphic shapes that can be mathematically expressed in angles, co-ordinates and distances. A vector images can be filled with color and patterns and we can select it as a single object. Vector drawn objects use a fraction of memory space required to describe and store the same object in bitmap form. For the web, pages that use the vector graphics use plug-ins such as Flash, and download faster when used for animation draw faster than bitmaps. Most drawing programs can export a vector drawing as a bitmap but converting bitmap to vector drawn object is difficult. Limitations: l Vector images cannot be used for photo-realistic images. l Plug-ins are required.

WHY DO WE NEED STANDARDS ?

l There is a need of certain set of rules, constraints, syntax, procedures and function calls to built a Graphics Package System. l If there are no standards, then everyone will come up with his/her own standards. l So there is a need to define standards , if not defined then, we will not be able to understand one’s software or graphical package. l Certain Compilers provide their own graphical libraries such as Visual Basic, C, C++, Java, Turbo C, Visual C etc.

l l l These systems can be DEVICE DEPENDENT and DEVICE INDEPENDENT. Device Dependent- Assembly language and Solaris. Device Independent- Open- GL, PHIGS. Standard Graphics Packages are. GKS (Graphics Kernel system). l l l first ISO standard low level computer graphics for 2 D vector graphics Applications written to use GKS portable to many platforms and devices Suitable for chart drawings
. PHIGS (Programmers’ Hierarchical Interactive Graphics system). l")
l l SRGP (Simple Raster Graphics Package). PHIGS (Programmers’ Hierarchical Interactive Graphics system). l l Standard for rendering 3 D computer graphics, support features like transformations, texture mapping, shading, light models OPEN-GL-is currently used.

l l l Computer Graphics system could be active or passive In both cases , the input to the system is scene description and output is a static or animated scene to be displayed In case of active system the user controls the display with the help of GUI, using an input device

COLOR CRT MONITORS • Colored pictures can be displayed using a combination of phosphors that emit different color light. • Commonly used techniques for display of colors are: -> Beam Penetration -> Shadow Mask

BEAM PENETRATION • Uses multilayer phosphor. • Used with random scan display. • Two layers of phosphor (usually red and green) are coated on inner side of CRT screen.

• Electron Beam intensity decides the displayed color. • High potential electron beam excite the green phosphor. • Low potential electron beam excite red phosphor. • Intermediate beam gives combinations of green and red light i. e. orange and yellow.

ADVANTAGE • Inexpensive Method. DISADVANTAGES • • • Limited colors are possible. Poor picture quality. Difficulty in changing electron beam potential by large amount.

EXCITES RED PHOSPHER SCREEN GREEN PHOSPHER RED PHOSPHER ELECTRON BEAM

Shadow Mask l. Shadow mask method is used in majority of color TV set and computer monitors. l. It can display wide range of colors. l. This method is commonly used in raster scan displays. Construction: • It has red, green & blue color dots at each pixel position on the screen (forms a delta) l. It also has three electron guns one for each color dot (forms a delta) l. A shadow-mask grid is placed just behind the phosphor-coated screen with holes, corresponding to each pixel on screen.
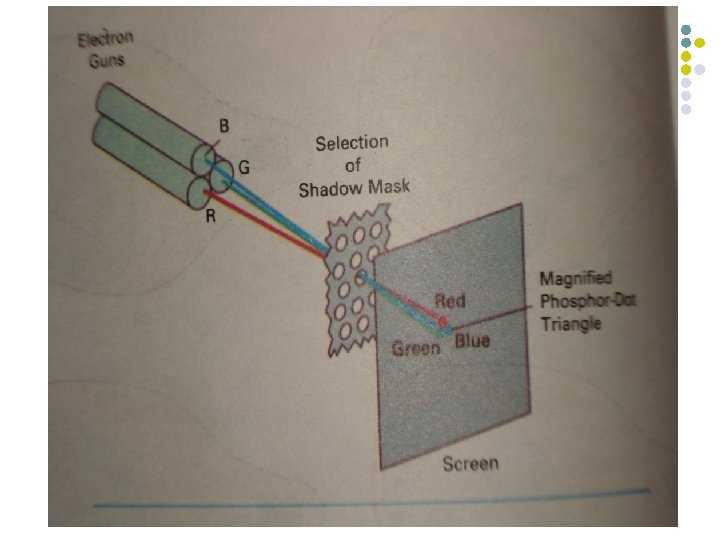
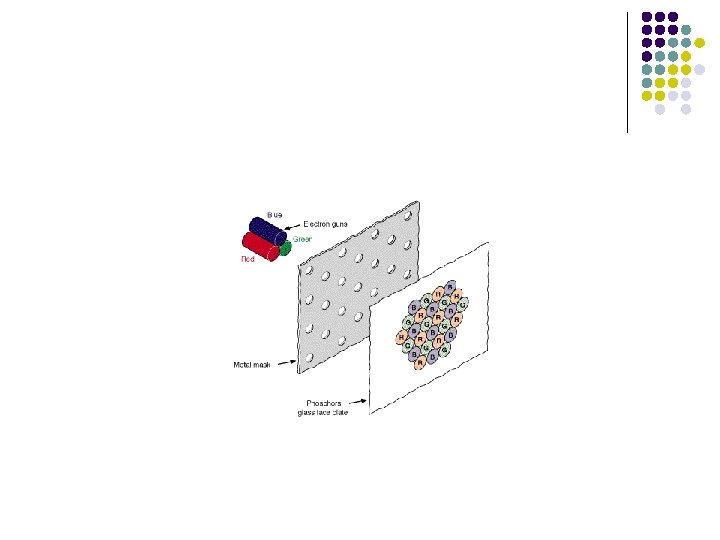

Shadow Mask l l l l A metal plate or shadow mask is placed just behind the phosphor screen. The plate has small holes. The guns placed shape of a triangle. These electron guns group in delta They are responsible for RED, BLUE & GREEN components of light i. e. output of the CRT. The electron beam from all the three guns are brought to the same point of focus on the shadow mask The phosphor is laid down in groups of three spots red , blue and green such that each spot is struck by electrons from appropriate gun.

l l By modulating the beam current the light output in each of the three color components can be controlled Different phosphor light can be combined to get a range of colors

l Advantage: l l produce realistic images also produced different colors and shadows scenes. Disadvantages l low resolution expensive electron beam directed to whole screen

Inherent Memory Devices l l l To avoid repeated refreshing, inherent memory contents are used. These devices store picture information inside the CRT. There are three types of inherent memory devices l l l DVST Plasma Panel display Laser Scan Display

Flat Panel Displays l l l Less volume, weight and power requirement Used in flat and thin TV monitors , laptops, calculators , handheld devices, advertising boards and notice boards etc. Flat panel displays comes in two categories: l l Emissive Displays: They convert electrical energy into light energy. E. g. Plasma Panel Display. Non Emissive Displays: They use optical effects to convert sunlight or light from other sources into graphical patterns. E. g. Liquid Crystal Display

Electroluminescent Display • Electroluminescent display is an example of emissive displays. • It consists of two glass sheets placed very close to each other. • A series of vertical electrodes are attached on inner glass sheet and horizontally on other sheet. • Electroluminescent substances are a kind of phosphor. Electroluminescent phosphors emit light after absorbing electricity. • The region between glass plates is filled with phosphor such as-: • Phosphor doped with manganese. • Zinc sulphide doped with manganese.

Thin film Electroluminescent display device

Electroluminescent Display • • When a sufficient high voltage is applied to a pair of crossing electrodes, the phosphor becomes a conductor in the area of intersection of the two electrodes. Electric energy is then absorbed by the manganese atoms, which then releases energy as a spot of light.

ADVANTAGES: l l Recently blue, red, and green electroluminescent materials have been developed that offer the potential for long life and full color electroluminescent displays. It has high resolution display. DISADVANTAGES: l l High power consumption. Expensive and bulky.

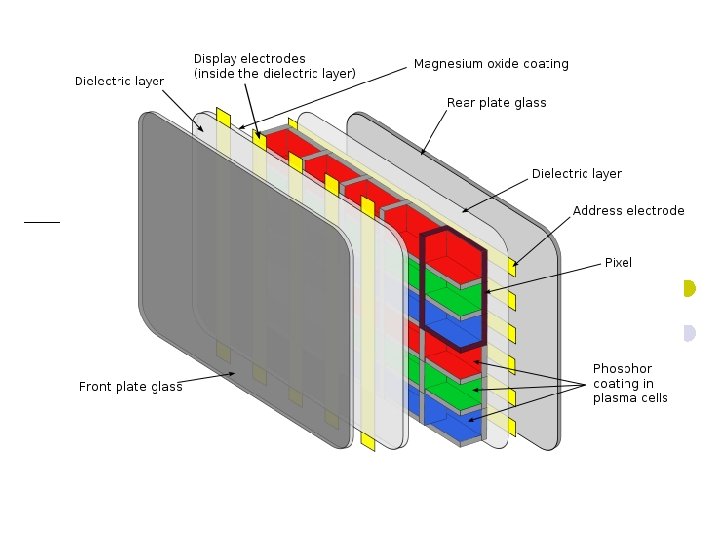
Plasma panel Display l l l It consists of two glass sheets placed face to face and very close to each other. The region between them is filled with a mixture of neon based gas. Thin and closely spaced gold electrodes are attached vertically on the inner side of one sheet and horizontally on another sheet When a sufficiently high voltage is applied the gas dissociates, i. e. electrons are stripped from the atoms. The dissociated gas is called a plasma, hence the name plasma display. When the electrons recombine, energy is released in the form of photons; and the gas glows. This glow can be sustained by maintaining a high frequency alternating voltage across the cell.

Plasma panel Display l l A cell can be switched on by momentarily increasing the sustaining voltage and switched off by lowering the signal. The signal amplitude is chosen so correctly , cells that have not been fired will not be affected.

Plasma panel Display l Advantages: l l It allows both selective writing and selective erase It produces a steady image which is free from flicker. It is less bulky than CRT. Disadvantages: l l l It is monochromatic It has poor resolution It has complex addressing and wiring requirements
 l l l LCDs are commonly used in small systems,")
LIQUID CRYSTAL DISPLAY (LCDs) l l l LCDs are commonly used in small systems, such as calculators, laptop computers. these are the non emissive devices. The term liquid crystal refers to the fact that these compounds have a crystalline arrangement of molecules, yet they flow like a liquid. Flat panel displays commonly used nematic (thread like) liquid crystal compounds that tend to keep the long axes of the rod shape molecules aligned.

l l l Two glass plates, each containing a light – polarizer at right angles to the other plate, sandwich the liquid crystal material. Rows of horizontal transparent conductors are built into one glass plate and columns of vertical conductors are put into the other plate The intersection of two conductors defines a pixel position. The polarized light passing through the material is twisted so that it will pass through the opposite polarizer. The light is then reflected back to the viewer.

l l l To turn off the pixel we apply the voltage to the two intersecting conductors to align the molecules so that the light is not twisted. This type of flat panel displays is referred to as passive-matrix LCD. Colors can be displayed by using different materials and by placing a triad of color pixels at each screen loactions.

l l l Another method for construction LCDs is to place a transistor at each pixel location using thin- film transistor technology. The transistors are used to control the voltage at pixel locations and prevent charge from gradually leaking out of the liquid crystal cells. These devices are called Active Matrix Displays

construction l l l l LCD is made up of six layers. The front layer is the first layer is a vertical polarizer. Second layer with thin grid wire electrode deposited on the surface adjoining the crystals. Third is a thin liquid crystal layer. Fourth is a layer with horizontal grid wires on the surface. Fifth layer is the horizontal polarizer. Last one is reflector.

. . Reflector Horizontal Liquid crystal Vertical polarizer grid wire layer grid wire . . Matrix form Pixel Vertical polarizer

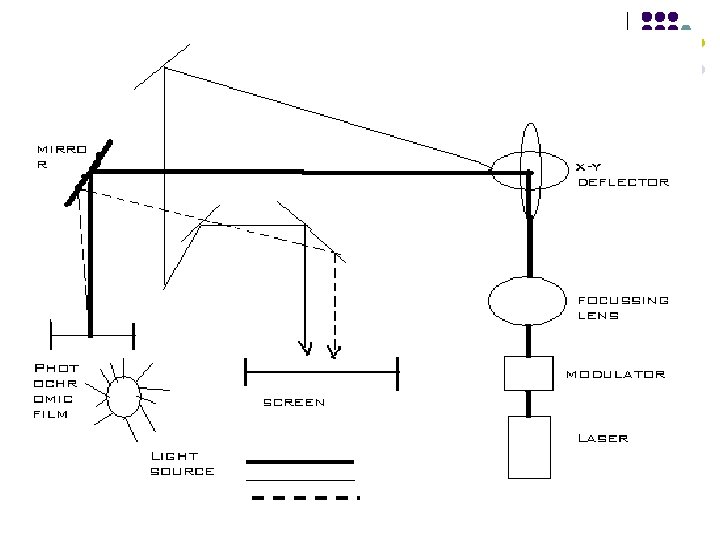
LASER SCAN DISPLAY • Laser scan display is one of the few high resolution large screen display devices. • It has been used in displaying maps, high quality text and elaborate ckt diagrams. • In laser scan display , a laser is deflected by a pair of mirrors so that it traces out the desired image on a sheet of photo chromic film. The material usually transparent but light from the laser leaves a dark trace on it. • A light projection system is used to project light onto a large screen. The image thus deposited on the film. • To produce a fresh image the display simply winds the role of film to bring a blank region under the laser, the mirrors deflecting the laser are extremely small and are controlled by the electrical signals received from the display controller.

Interlacing l l l Each frame has two fields, each containing half the picture. Fields are interlaced and interwoven. Fields are presented alternately every other 1/60 th of a second. l l One field contain odd lines(1, 3, 5, 7, ……. ) One field contain even lines(0, 2, 4, 6, ……. ) Interlacing scan lines on a raster scan display. First all points on even numbered (solid) scan lines are displayed, then all points along the odd numbers (dashed) lines are displayed.

0 1 2 3 4 5 6 7 8 9 10 11
- Slides: 127