Computed Tomography III Reconstruction Image quality Artifacts Simple


 in each pixel, (x,")
 • CT numbers are quantitative • CT scanners measure bone")


 • Contrast resolution is tied to the SNR, which is")
 – For 3 rd generation")
 • Number of rays – For a fixed")
 • Slice thickness – Large slice thicknesses reduce")
 • Reconstruction kernel – Bone filters have the")

 • Slice thickness – Thicker slices uses more")
 • Gantry rotation speed – Most CT systems")

 • The average energy of the x-ray beam becomes greater")
 • The beam-hardening phenomenon induces artifacts in CT because rays")


 • Occasionally a partial volume artifact can mimic pathological")
- Slides: 33
Computed Tomography III Reconstruction Image quality Artifacts
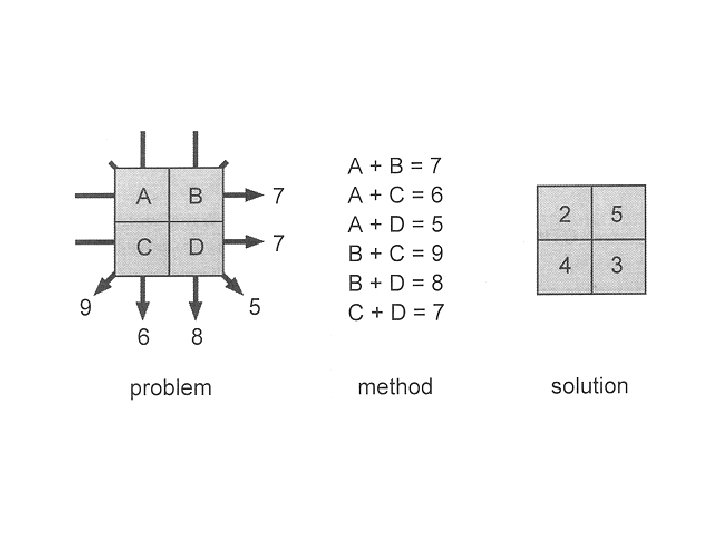
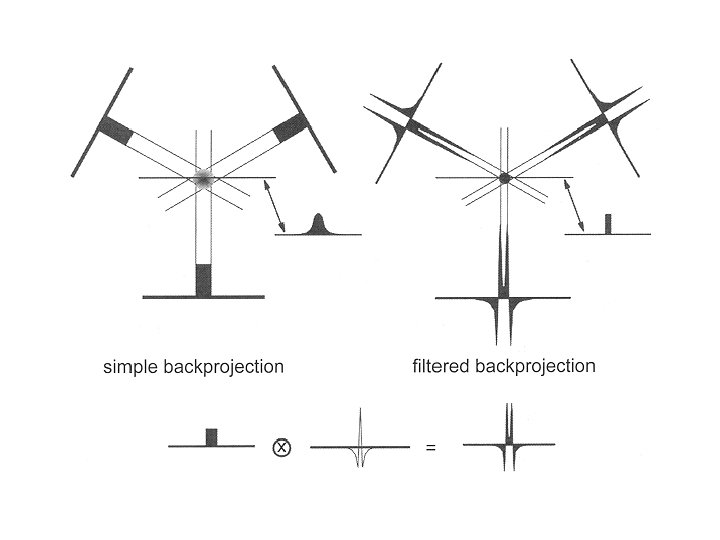
Simple backprojection • Starts with an empty image matrix, and the value from each ray in all views is added to each pixel in a line through the image corresponding to the ray’s path • A characteristic 1/r blurring is a byproduct • A filtering step is therefore added to correct this blurring
Filtered backprojection • The raw view data are mathematically filtered before being backprojected onto the image matrix • Involves convolving the projection data with a convolution kernel • Different kernels are used for varying clinical applications such as soft tissue imaging or bone imaging
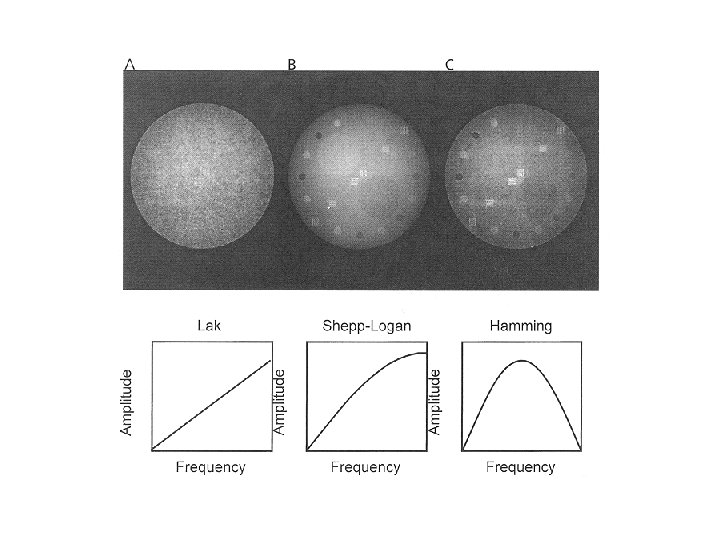
Convolution filters • Lak filter increases amplitude linearly as a function of frequency; works well when there is no noise in the data • Shepp-Logan filter incorporates some roll-off at higher frequencies, reducing high-frequency noise in the final CT image • Hamming filter has even more pronounced highfrequency roll-off, with better high-frequency noise suppression
Bone kernels and soft tissue kernels • Bone kernels have less high-frequency roll-off and hence accentuate higher frequencies in the image at the expense of increased noise • For clinical applications in which high spatial resolution is less important than high contrast resolution – for example, in scanning for metastatic disease in the liver – soft tissue kernels are used – More roll-off at higher frequencies and therefore produce images with reduced noise but lower spatial resolution
CT numbers or Hounsfield units • The number CT(x, y) in each pixel, (x, y), of the image is: • CT numbers range from about – 1, 000 to +3, 000 where – 1, 000 corresponds to air, soft tissues range from – 300 to – 100, water is 0, and dense bone and areas filled with contrast agent range up to +3, 000
CT numbers (cont. ) • CT numbers are quantitative • CT scanners measure bone density with good accuracy – Can be used to assess fracture risk • CT is also quantitative in terms of linear dimensions – Can be used to accurately assess tumor volume or lesion diameter
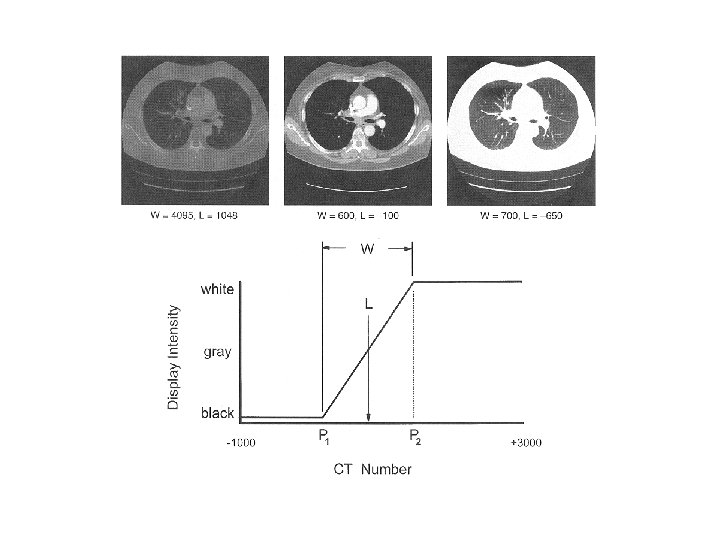
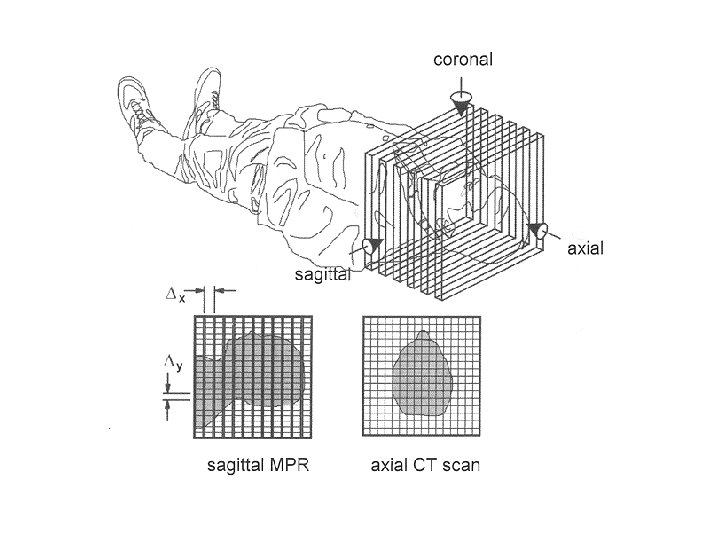
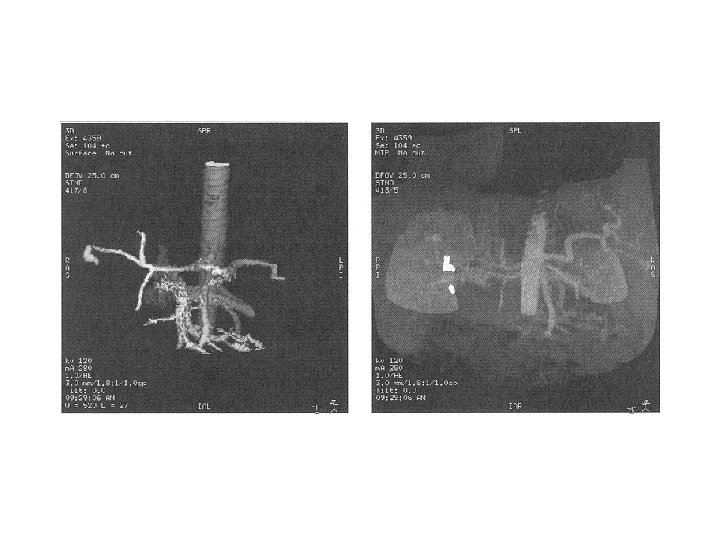
Digital image display • Window and level adjustments can be made as with other forms of digital images • Reformatting of existing image data may allow display of sagittal or coronal slices, albeit with reduced spatial resolution compared with the axial views • Volume contouring and surface rendering allow sophisticated 3 D volume viewing
Image quality • Compared with x-ray radiography, CT has significantly worse spatial resolution and significantly better contrast resolution • Limiting spatial resolution for screen-film radiography is about 7 lp/mm; for CT it is about 1 lp/mm • Contrast resolution of screen-film radiography is about 5%; for CT it is about 0. 5%
Image quality (cont. ) • Contrast resolution is tied to the SNR, which is related to the number of x-ray quanta used per pixel in the image • There is a compromise between spatial resolution and contrast resolution • Well-established relationship among SNR, pixel dimensions ( ), slice thickness (T), and radiation dose (D):
Factors affecting spatial resolution • Detector pitch (center-to-center spacing) – For 3 rd generation scanners, detector pitch determines ray spacing; for 4 th generation scanners, it determines view sampling • Detector aperture (width of active element) – Use of smaller detectors improves spatial resolution • Number of views – Too few views results in view aliasing, most noticeable toward the periphery of the image
Factors affecting spatial resolution (cont. ) • Number of rays – For a fixed FOV, the number of rays increases as detector pitch decreases • Focal spot size – Larger focal spots cause more geometric unsharpness and reduce spatial resolution • Object magnification – Increased magnification amplifies the blurring of the focal spot
Factors affecting spatial resolution (cont. ) • Slice thickness – Large slice thicknesses reduce spatial resolution in the cranial-caudal axis; they also reduce sharpness of edges of structures in the transaxial image • Slice sensitivity profile – A more accurate descriptor of slice thickness • Helical pitch – Greater pitches reduce resolution. A larger pitch increases the slice sensitivity profile
Factors affecting spatial resolution (cont. ) • Reconstruction kernel – Bone filters have the best spatial resolution, and soft tissue filters have lower spatial resolution • Pixel matrix • Patient motion – Involuntary motion or motion resulting from patient noncompliance will blur the CT image proportional to the distance of motion during scan • Field of view – Influences the physical dimensions of each pixel
Factors affecting contrast resolution • m. As – Directly influences the number of x-ray photons used to produce the CT image, thereby influencing the SNR and the contrast resolution • Dose – Dose increases linearly with m. As per scan • Pixel size (FOV) – If patient size and all other scan parameters are fixed, as FOV increases, pixel dimensions increase, and the number of x-rays passing through each pixel increases
Factors affecting contrast resolution (cont. ) • Slice thickness – Thicker slices uses more photons and have better SNR • Reconstruction filter – Bone filters produce lower contrast resolution, and soft tissue filters improve contrast resolution • Patient size – For the same technique, larger patients attenuate more x -rays, resulting in detection of fewer x-rays. Reduces SNR and therefore the contrast resolution
Factors affecting contrast resolution (cont. ) • Gantry rotation speed – Most CT systems have an upper limit on m. A, and for a fixed pitch and a fixed m. A, faster gantry rotations result in reduced m. As used to produce each CT image, reducing contrast resolution
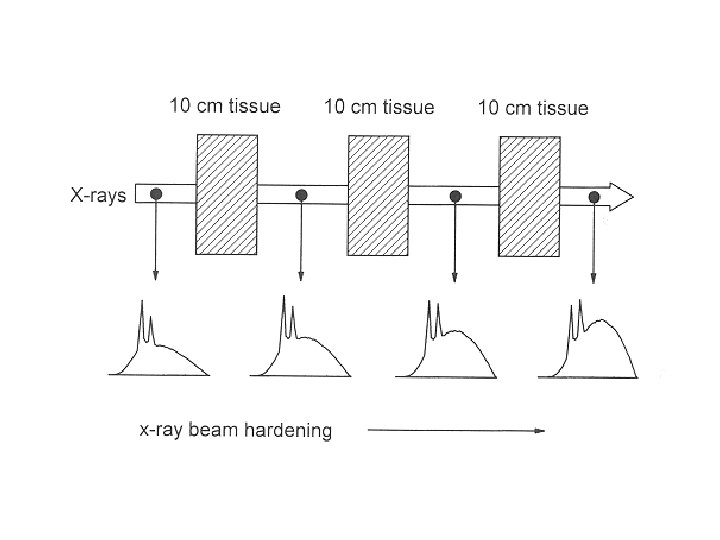
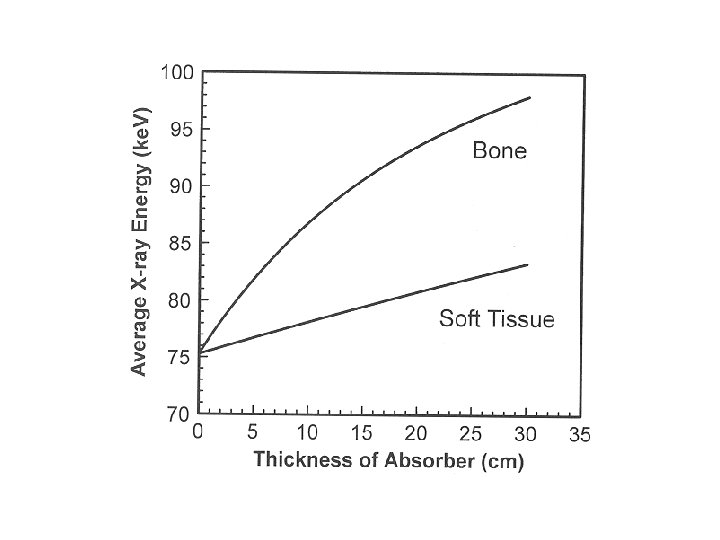
Beam hardening • Like all medical x-ray beams, CT uses a polyenergetic x-ray spectrum • X-ray attenuation coefficients are energy dependent – After passing through a given thickness of patient, lower-energy x-rays are attenuated to a greater extent than higher-energy x-rays are • As the x-ray beam propagates through a thickness of tissue and bones, the shape of the spectrum becomes skewed toward higher energies
Beam hardening (cont. ) • The average energy of the x-ray beam becomes greater (“harder”) as it passes through tissue • Because the attenuation of bone is greater than that of soft tissue, bone causes more beam hardening than an equivalent thickness of soft tissue
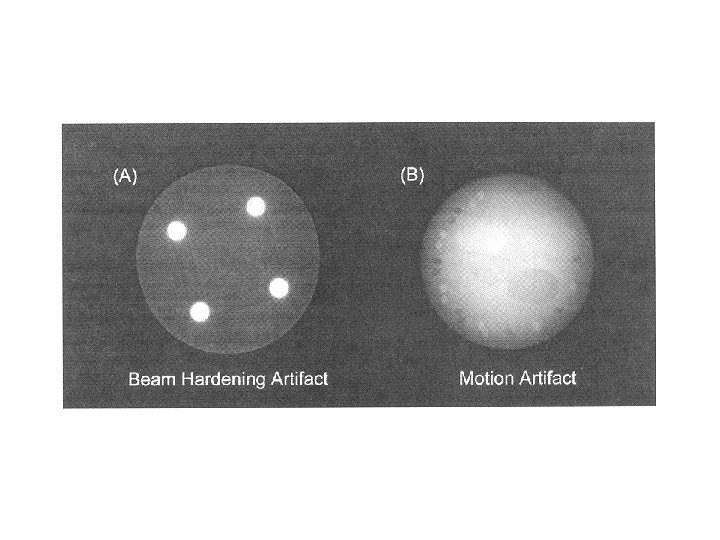
Beam hardening (cont. ) • The beam-hardening phenomenon induces artifacts in CT because rays from some projection angles are hardened to a differing extent than rays from other angles, confusing the reconstruction algorithm • Most scanners include a simple beam-hardening correction algorithm, based on the relative attenuation of each ray • More sophisticated two-pass algorithms determine the path length that each ray transits through bone and soft tissue, and then compensates each ray for beam hardening for the second pass
Motion artifacts • Motion artifacts arise when the patient moves during the acquisition • Small motions cause image blurring • Larger physical displacements produce artifacts that appear as double images or image ghosting
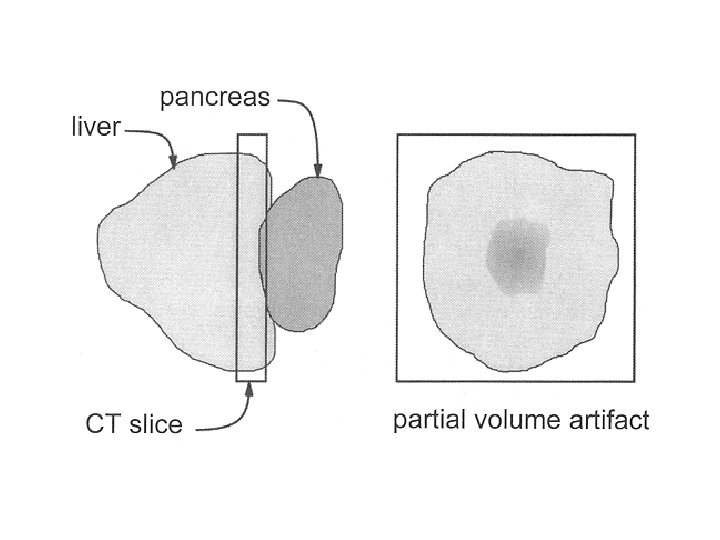
Partial volume averaging • Some voxels in the image contain a mixture of different tissue types • When this occurs, the is not representative of a single tissue but instead is a weighted average of the different values • Most pronounced for softly rounded structures that are almost parallel to the CT slice
Partial volume averaging (cont. ) • Occasionally a partial volume artifact can mimic pathological conditions • Several approaches to reducing partial volume artifacts – Obvious approach is to use thinner CT slices – When a suspected partial volume artifact occurs with a helical study and the raw scan data is still available, additional CT images may be reconstructed at different positions