Computed Radiography Objectives Historical perspectives of computerized imaging

Computed Radiography

Objectives Historical perspectives of computerized imaging n S/F vs CR vs DDR imaging n Basics of CR image capture n CR imaging equipment n Advantages of CR imaging n Radiation Protection n

Digital Imaging • Image acquisition that produces an electronic image that can be viewed and manipulated on a computer. • Analog-to-digital converters.

Development of Digital Imaging • The second major milestone in medical imaging the invention of CT. • Began the coupling of the computers and imaging. • Godfrey Hounsfield in the 1970’s.
")
First-generation CT unit: dedicated head scanner (Photograph taken at Roentgen Museum, Lennep, Germany. )

Digital Imaging Techniques n Are used in: ¨ Computed Tomography ¨ Magnetic Resonance Imaging ¨ Diagnostic Ultrasound ¨ Computerized Radiography ¨ Digital Fluoroscopy

CR & DR imaging n Was limited until sufficient computer technology became available to process the large quantities of data generated n Clinical use began in the 1980’s (CR) 1990’s (DDR)
")
Methods to Digitize an Image • 1. Film Digitizer - Teleradiography system (PACS, DICOM) • 2. Video Camera (vidicon or plumbicon) • 3. Computed Radiography • 4. Direct Radiography

Computed Radiography Terms n n n n PSL = photostimulable luminescence PSP = photostimulable phosphor SPS = storage phosphor screen IP = imaging plate SP = storage phosphor PMT = photomultiplier tube PD = photodiode S/F = screen-film

Computed Radiography Fundamentals of Computerized Radiography

CR IR n Cassette-based digital radiography n In S/F the intensifying screens contain phosphor that emits light in response to xray interaction. n In CR, the response to x-ray interaction is trapped photon energy (e-) on the PSP plate.

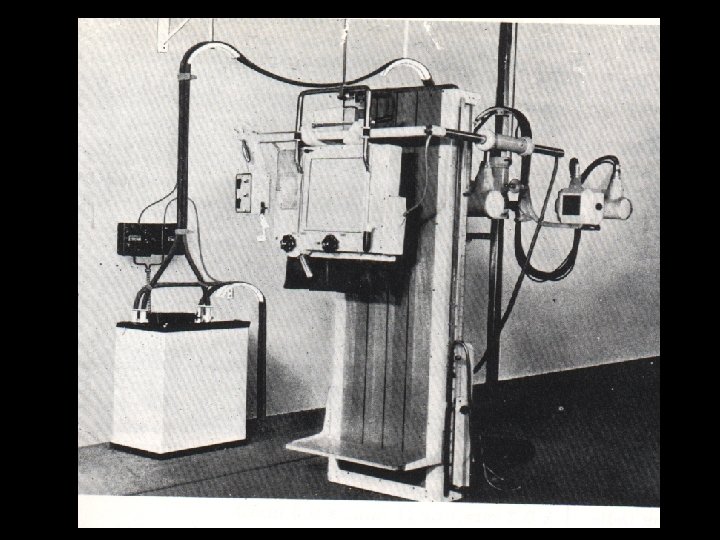
Conventional radiography latent image formation

CR latent image formation

What Is Digital Imaging? n. Digital imaging is the acquisition of images to a computer rather than directly to film. 15

IMAGE CREATION SAME RADIOGRAPHY EQUIPMENT USED n THE DIFFERENCE IS HOW IT IS CAPTURED n STORED n VIEWED n And POST -PROCESSED n

General Overview CR n PSP cassette exposed by conventional x-ray equipment. n Latent image generated as a matrix of trapped electrons in the PSP plate.

CR BASICS • • Eliminates the need for film as a recording, storage & viewing medium. PSP Plate – receiver Archive Manager – storage Monitor - Viewing
-Selenium Computed Radiography (CR)")
Digital DDR CR Radiography Direct Capture Indirect Capture Direct-to-Digital Radiography (DDR)-Selenium Computed Radiography (CR) - PSL Direct-to-Digital Radiography Silicon Scint. Laser Scanning Digitizers
 n ID STATION n IMAGE PREVIEW (QC) STATION")
CR SYSTEM COMPONENTS CASSETTES (phosphor plates) n ID STATION n IMAGE PREVIEW (QC) STATION n DIGITIZER n VIEWING STATION n

ID STATION

CR Readers AKA CR Processors

Computed Radiographic Readers Fuji Agfa Kodak
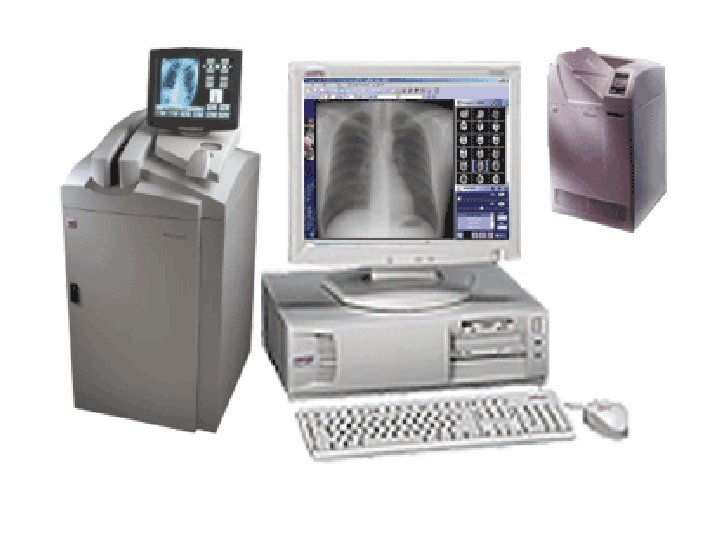
 plate n Exit photons energizes the")
CR – PSP plate n photostimulable phosphor (PSP) plate n Exit photons energizes the PSP plate n The energy is stored in traps on plate (latent image) n PLATE scanned in CR READER
 n Contained in a cassette n Handled the same as S/F")
Imaging Plate (IP) n Contained in a cassette n Handled the same as S/F cassettes n Processed more like daylight processor with no chemicals n IP has lead backing to reduce scatter

Imaging Plate Construction n A thin sheet of plastic n IP’s have several layers ¨A protective layer. This is a very thin, tough, clear plastic that protects the phosphor layer ¨ A phosphor or active layer. This is a layer of photostimulable phosphor that “traps” electrons during exposure

Active Layer - Crystals n The materials that make up the PSP plate are from the barium fluorohalide family. n Barium fluorohalide, chlorohalide, or bromohalide crystals. The most common crystal uses is barium fluorohalide with europium

Acquiring the Image n The remnant beam interacts with electrons in the barium fluorohalide crystals ¨ This interaction stimulates, or gives energy to, electrons in the crystals, allowing them to enter the conductive layer ¨ The Conductuve layer is where they are trapped in an area of the crystal known as the color or phosphor center

Acquiring the Image cont n This trapped signal will remain for hours, even days, although deterioration begins almost immediately. IR should be processed as soon as possible n The trapped signal is never completely lost

Imaging Plate Construction n A reflective layer. This is a layer that sends light in a forward direction when released in the cassette reader. This layer may be black to reduce the spread of stimulating light and the escape of emitted light. Some detail is lost in this process.

Imaging Plate Construction n n Conductive layer. This is a layer of material that absorbs and reduces static electricity A color layer. Newer plates may contain a color layer, located between the active layer and the support, that absorbs the stimulating light but reflects emitted light. A support layer. This is a semirigid material that gives the imaging sheet some strength. A backing layer. This is a soft polymer that protects the back of the cassette.

Cross section of a PSP screen

Needle PSP increase the absorption of xrays and limit the spread of light emission
 n Enhance")
IP Design n Designed to optimize the intensity of light release. (CE) n Enhance the absorption of x-rays (DQE) n Limit the spread of light emission for more detail.

Photostimulable Luminescence n When the cassette is put into the reader, the imaging plate is extracted and scanned ¨ With a helium laser beam or, in more recent systems, solid-state laser diodes ¨ This beam, about 100μm wide with a wavelength of 633 nm (or 670 to 690 nm for solid state), ¨ Scans the plate with red light in a raster pattern and gives energy to the trapped electrons.

X-ray interaction with a PSP screen 1 X-ray interactions with the screen phosphors causes an e - to excited 2 When e- return to ground state visible light is emitted

CR Phosphor Plates ABSORPTION EMISSION LASER STIMULATION X-RAY ELECTRON TRAP LIGHT

CR Reader – PSP plate n Stimulates the matrix of trapped E- by a RED OR ULTRAVIOLET laser light n Trapped E- energy is released in a form of VIOLET/BLUE light n Violet light is captured by PMT – is amplified and converted into a digital signal

Sequence of CR imaging

.")
How CR works n Released light is captured by a PMT (photo multiplier tube). An ultrasensitive photomultiplier tube or CCD (charged couple device) n PSP light is amplified by the PMT or CCD n This light is sent to the analog to digital converter (ADC). To convert light to binary.
 n The intensity (brightness) of the light – correlates to the")
PMT (photomultiplier tube) n The intensity (brightness) of the light – correlates to the density on the image n So lots of light will correlate to what size number & what color on the image? n The digital numeric values are stored in matrix form called pixels for display on a cathode ray tube (CRT) or printed on film

ERASING THE SCREEN n ~50% of trapped electrons released during “read” n After image is recorded n Plate is erased with high intensity white light and re-used n Erasing should be done after every exposure or at minimum every 24 hours to avoid ghosting on future images
 of pixel (picture element)")
Basics of Digital Images • digital images are a (matrix) of pixel (picture element) values

Pixels n Digital images are made of discrete picture elements, arranged in a matrix. The size of the image is described in the binary number system n Modern imaging systems are at least 1024 x 1024 n 4096 x 4096 is being developed for digital radiography

Matrix = each cell corresponds to a specific location on the image

Pixel

Pixels

Digital Images – Bit Depth • Pixel values can be any bit depth (values from 0 to 1023) • Bit depth = # or gray shades available for image display • Image contrast can be manipulated to stretched or contracted to alter the displayed contrast. • Typically use “window width” and “window level” to alter displayed contrast and brightness

Digital - Grayscale Bit depth. n Number of gray shades n ¨ available for display 8 bit 256 n 10 bit 1024 n 12 bit 4096 n 4 bit 16384 n

Display Bit Depth 1 bit 6 bit 8 bit 2 shades 64 shades 256 shades

Computed Radiography n As the plate is scanned “read” data is collected at a specific frequency = Sampling frequency n Spatial resolution determined by sampling frequency n With some systems, the smaller IR’s have higher sampling frequencies & more pixels per mm = more spatial resolution
 Signal-to-Noise Ratio n Principle source of noise on the")
Signal Loss (reducing image quality) Signal-to-Noise Ratio n Principle source of noise on the image is scatter radiation. n Scattering of emitted light off screen. n The efficiency of the photomultiplier tubes (PMTs) and photodiodes (PDs)

Improving Signal-to-Noise Ratio n Optical filter is used to prevent the longerwavelength laser light affecting the image formation. n Increasing exposure to IR. Newer CR systems are better at reducing noise at lower exposure levels.

Technique Selections n What are some factors that technologist must take into consideration when selecting a technique? n What regulates that technologists to select appropriate techniques in F/S? CR & DR ?

Screen / Film Self regulating system n The receptor speed and film H&D curve defined the proper exposure n Achieving optimal OD guaranteed appropriate exposure to the patient n Over exposed = dark image n Correct exposure = correct OD n Under exposed = light image n

Characteristic curve of radiographic film

Characteristic Curve Sometimes called the H&D curve for Hurter and Driffield, who first described the relationship n Describes the relationship between OD and exposure n Exposure changes near the toe or shoulder result in very little OD changes n

Screen / Film Imaging = self regulating 2 m. As Under exposed 6 m. As Correct exposure 24 m. As Over exposed

CR imaging results in 10, 000 shades of gray Fixed k. Vp exposures m. As = 0. 5 S = 357 m. As = 1. 0 S = 175 m. As = 2. 0 S = 86 m. As = 5. 0 S = 35

S/F fundamental principle Keep receptor exposure constant for given receptor response n The receptor exposure level (m. R) depends on. . n Receptor “speed” n 100 speed ~ 2 m. R (to IR for appropriate OD) n 200 speed ~1 m. R n 400 speed ~ 0. 5 m. R n

Speed Class n For CR imaging the speed is determined by the image quality required by the Radiologists or programmed by the service engineer ¨ Dependent on exposure to the PSP plate. ¨ 200 RS = highest quality images. ¨ Increasing RS will reduce contrast resolution patient dose. and n S numbers, Index numbers, Sensitivity numbers, Exposure index n Each imaging system is unique

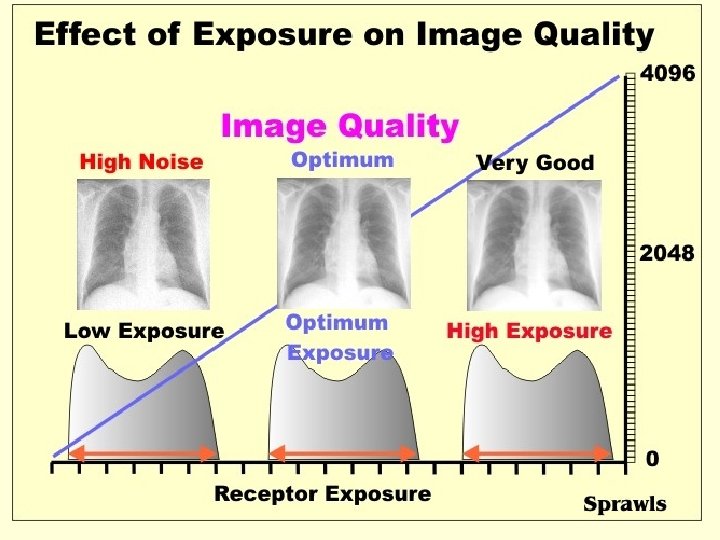
Dose Implications n Images nearly always look better at higher exposures. n F/S system on average used a 400 RS combination ¨ CR looks best at 200 RS. ¨ If you were a manufacture how would you set up your system for image quality? vs ALARA?

80 KVP 5 5 100 30 15 200 500

Dose Implications n Huge dynamic range means nearly impossible to overexpose n Then the COMPUTER corrects majority of exposure errors n Therefore almost ANY technique can be used on the patient – n The computer will fix it.

POST PROCESSING Part Selection

Workstation Menu

n ALGORITHM – a set of mathematical values used to solve a problem or find an average n HISTOGRAM – a bar graph depicting the density distribution (in numerical values) of the imaging plate

Wrong Algorithm

Darker Lighter Histogram showing pixel values in an image. The pixel values in gray are on the horizontal with the total number for each on the vertical.

Histogram Analysis n n n n A histogram is a plot of gray scale value vs. the frequency of occurrence # pixels of the gray value in the image A graph that displays signal value x-axis related to amount of exposure y-axis displays number of pixels for each exposure Series of peaks and valleys Pattern varies for each body part

Statistical plots of the frequency of occurrence of each pixel's value

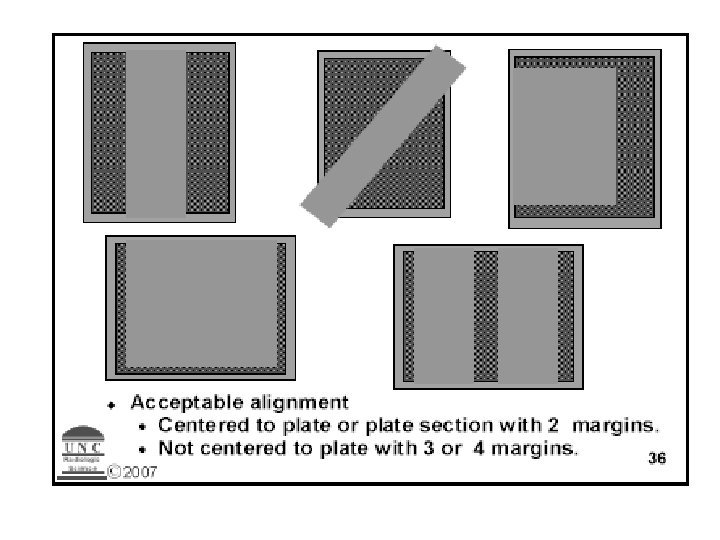
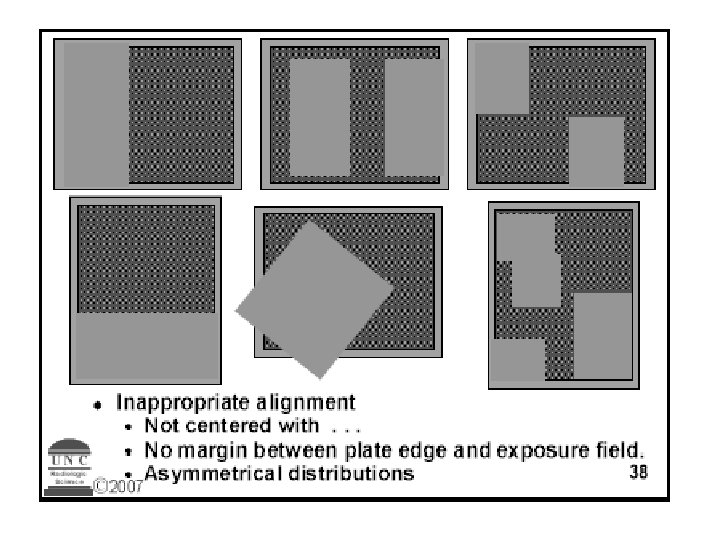
Initial Image Processing n Automated exposure field edge detection n Eliminates signals outside collimation margins n If margin not detected, extraneous data included in the histogram.

EDR Exposure Data Recognition n When laser scans it is looking for area of plate that has exposure n Some read from center out and look for two sides of collimation n Works best when image centered n

Exposure Indicators Imaging plates get a signal from the exposure they receive n The value of the signal is calculated from the region identified as the anatomy of interest n The signal for the plate is an average of all signals given to the plate n

Exposure Values Each system has range of values for appropriate exposure for part n The range used by vendor is very broad n Each facility should develop its own exposure range taking into account n ¨ Radiologist ¨ ALARA preference

S numbers, Index numbers, Sensitivity numbers, Exposure index The total signal is not a measure of the dose to the patient but indicates how much radiation was absorbed by the plate n A 1 m. R exposure will give n ¨ Fuji S# 200 ¨ Kodak/Carestream EI 2, 000 ¨ Agfa 200 speed lgm reference value for site

EXPOSURE VALUES n Exposure indicator ¨ Plates sensitive to 0. 1 m. R – 100 m. R ¨ “S” number for Fuji n S number inverse to exposure ¨ S=2 n (100 m. R), S=200 (1 m. R) Carestream/Kodak uses exposure index – direct relationship ¨ 2000 (1 m. R), 3000 (10 m. R)

Using Exposure Numbers n Fuji, if appropriate # is 200 then ¨At 400, too light, double m. As for 200 ¨At 100, too dark, half m. As for 200 n Kodak, if appropriate # is 1800 ¨At 1500, too light, double m. As for 1800 ¨At 2100, to dark, half m. As for 1800

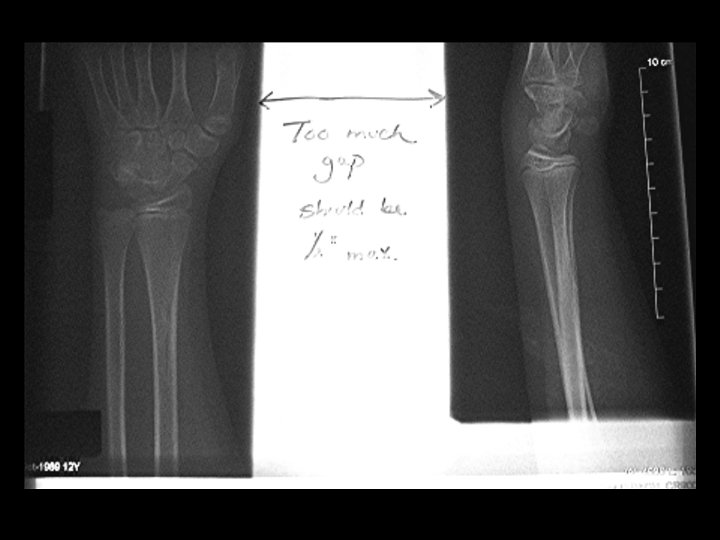
Exposure Numbers n The exposure numbers can only be used if all other parameters are correct ¨ Centering to plate ¨ Collimation n Position over AEC, look at m. As readout to determine if poor positioning caused light or dark image

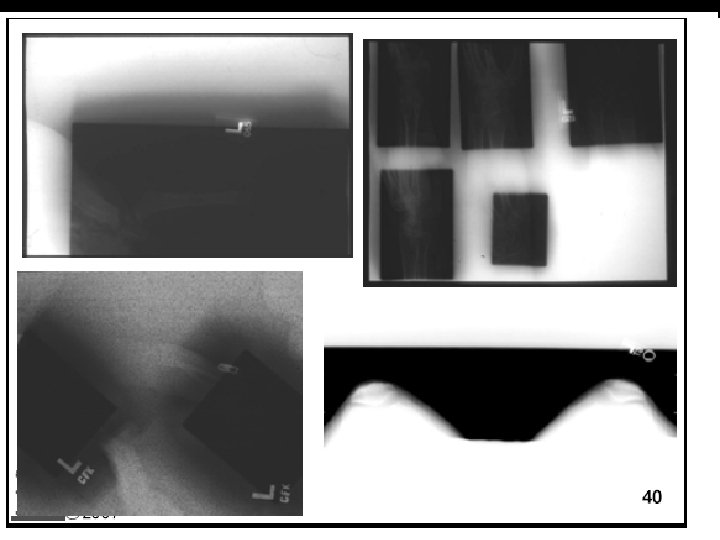
S# 8, 357 S# 12, 361 lat CXR

Same technique, different centering and collimation S# 592 S# 664

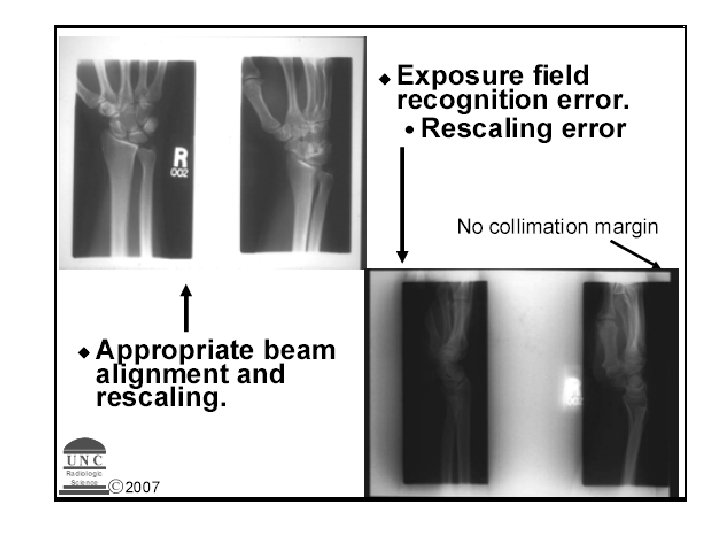
�� 2 on 24 X 30 �� Technique adjusted 2 on 24 X 30 �� Same technique �� Rescaling error.

Histogram Analysis n Collimation is very important n If plate reader cannot find collimated edges then all the exposure on plate will be included in the histogram n Histogram from plate is compared to body part histogram stored in computer

Characteristic curve & histogram

Histogram with H&D curve

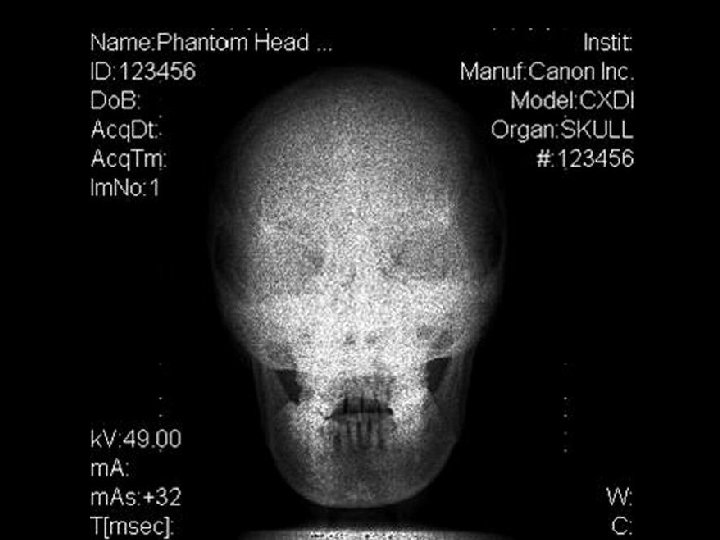
Underexposed

Overexposed

Just right!

Changes to Histogram Hip prosthesis Line caused from dirt collected in a CR Reader

Higher k. Vp • Smaller signal difference • Narrower data range • Photons to IR

Lower k. Vp • Larger signal difference • Wider data range • More photons will be absorbed

k. Vp vs. Data Width • • Very difficult concept for radiographer Focused on exposure vs. appearance High k. Vp = longer scale = wider Low k. Vp = shorter scale = narrower Change focus to underlying physics High k. Vp = less differential attenuation Smaller signal difference
 n Each anatomic area has a LUT or Algorithm")
LUT Look Up Table (LUT) n Each anatomic area has a LUT or Algorithm n Used to adjust contrast and density n Other terms that may be used for this n ¨ Contrast rescaling ¨ Contrast processing ¨ Gradation processing ¨ Tone scaling

LUT The image data from the histogram is rescaled for application of the LUT n The LUT maps the adjusted data through a “S” curve that is similar to an H & D curve n The result is an image that has the correct contrast and brightness (density) n

Automatic rescaling Mapping grayscale to “pixel values of interest” to achieve specific display levels. n Critical elements n ¨ Peaks ¨ Troughs ¨ Width ¨ Locates VOI (values of interest) ¨ Exposure index determination

LUT 1. is unprocessed, 2. algorithm finds anatomy, 3. finished

Myths for CR #1 & 2 n 1. m. As – myth: digital is m. As driven ¨ Truth: n 2. . k. Vp – myth: digital is k. Vp driven. ¨ Truth:

Contrast n n n n What determines contrast ? Which factors have more impact on contrast than k. Vp for all systems? Anatomical structure Contrast media Grid utilization Grid vs. non-grid Grid efficiency Processing algorithm

TECHNIQUE CONISDERATIONS n k. Vp energy dependant n Now COMPUTER controls CONTRAST n Higher k. Vp to stimulate electron traps ¨k. Vp range for CR 45 - 120

Using Higher k. Vp with Digital n There is a limit ! ! ¨ If higher k. Vp is used to limit dose. ¨ Remember basic physics. Higher k. Vp – more transmission n Lower k. Vp – more photoelectric n Too low m. As can cause quantum mottle regardless of k. Vp used n

k. Vp Selection Anatomical contrast n Inherent Δ attenuation due to structure n Grid utilization n Yes, No, Efficiency n ¨ Ratio, frequency, lead content. Contrast improvement n Default processing algorithm n

k. Vp Selection Determined by anatomy and grid n Adults: �� Optimal range 60 – 120 n �� Pediatrics < 100 lbs: Optimal range 50 90 n May use higher k. Vp than with S/F. n Helps limit dose increase n Narrows acquired data range. n

k. Vp ranges for CR n n Infant extremities 50 60 k. Vp Adult extremities 65 75 k. Vp Bucky extremities 75 – 90 k. V AP spine 85 - 95 k. Vp n n Lateral spine 85 – 100 k. Vp Chest 110 – 130 k. Vp Skull 80 – 90 k. Vp Only 1 k. Vp is not reccomended

Another set of suggested k. Vp ranges. n n n Distal Extremities = 65 – 75 Ped. extremities = 50 - 65 KUB = 80 - 85 IVU = 70 – 80 BE = 110 -120 n n n Grid extremities = 85 90 L-spine/Pelvis = 85 – 90 Chest / grid = 110 – 130 Ped. chest NG 70 – 80 Ribs = 80 – 90 T-spine = 90 – 100

Collimation n Proper collimation is the best way to enhance your CR image. Why? n What is shuttering? n Is it the same as collimating?

Myths for CR #3 n Collimation collimate. ¨Truth: – myth: you cannot

Shuttering

If radiologist object. Apply back border.

Collimation n Less water irradiated n Less scatter produced n Improves contrast n Reduces effective dose n Reduces automatic rescaling errors n
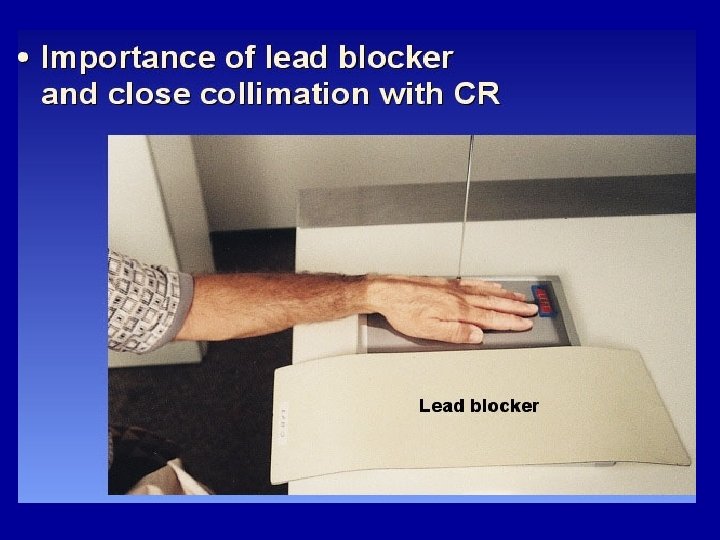

Exposure Field Recognition If the exposure field is not recognized the entire plate is used in image construction

Myths for CR #4 n Grid – myth: cannot use grids and don’t need them. ¨ Truth:

Grid vs. Non-grid

Myths for CR #5 n 5. SID – myth: magnification doesn’t occur with digital so SID is unimportant. ¨Truth:

Myths for CR #6 n Speed class – myth: it is a 200 speed class, you need to double your m. As and increase your k. Vp by 10. ¨ Truth:

Myth for CR #7 & 8 n 7. Fog – myth: digital systems can’t be fogged by scatter or background radiation. ¨ Truth: n Myth: fluorescent lights fog PSP plates. ¨ Truth:

ADVANTAGE OF CR/DR vs FS Rapid storage n retrieval of images NO LOST FILMS! n PACS (storage management) n Teleradiology - long distance transmission of image information n Economic advantage - at least in the long run? n

ADVANTAGE OF CR/DR n Can optimize image quality by manipulating digital data to improve visualization of anatomy and pathology AFTER EXPOSURE TO PATIENT

Image Preprocessing n Data recognition is very important n Two on one imaging? Is it good practice? n Carter pg. 87 Can it be done?

Improves Exam Times ?

High resolution with digital imaging

• towel that was used to help in positioning a child • CR is MORE sensitive to • ARTIFACTS NEW IMAGE

Questions ?
- Slides: 132