
Compton Laser and Systematics for PREx Abdurahim Rakhman
Compton Laser and Systematics for PREx Abdurahim Rakhman Syracuse University PREx Collaboration Meeting, JLab January 30, 2011
Outline Laser & Cavity Performance Optical Setup SHG Green Beam Characteristics Mode Matching Cavity Performance Cavity Characterization Laser Polarization Polarized Beam Transport Polarization Measurement Transfer Function Polarization Analysis Summary
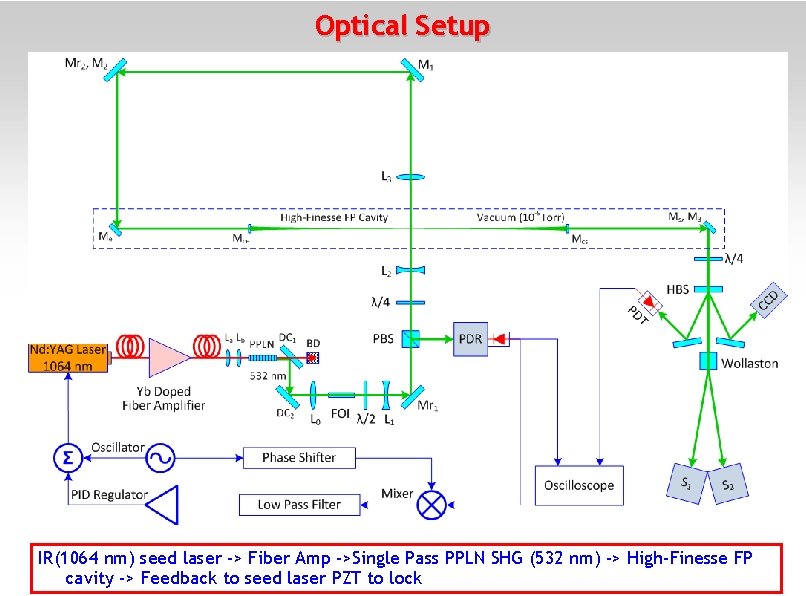
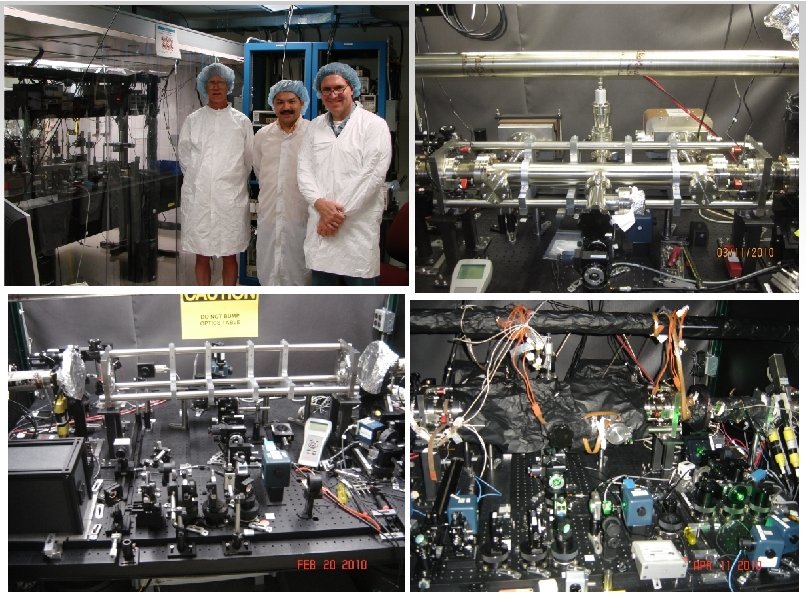
Optical Setup IR(1064 nm) seed laser -> Fiber Amp ->Single Pass PPLN SHG (532 nm) -> High-Finesse FP cavity -> Feedback to seed laser PZT to lock
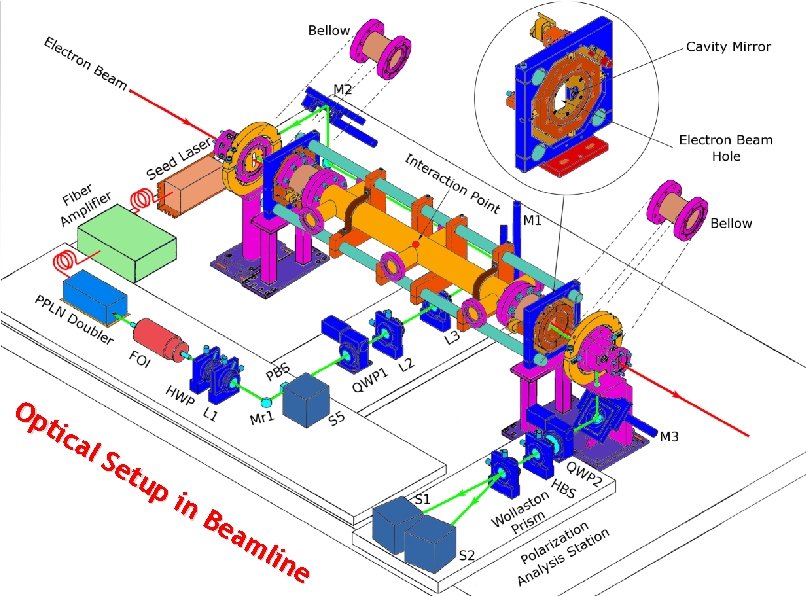
Op tic al Se tup in Be am lin e 4
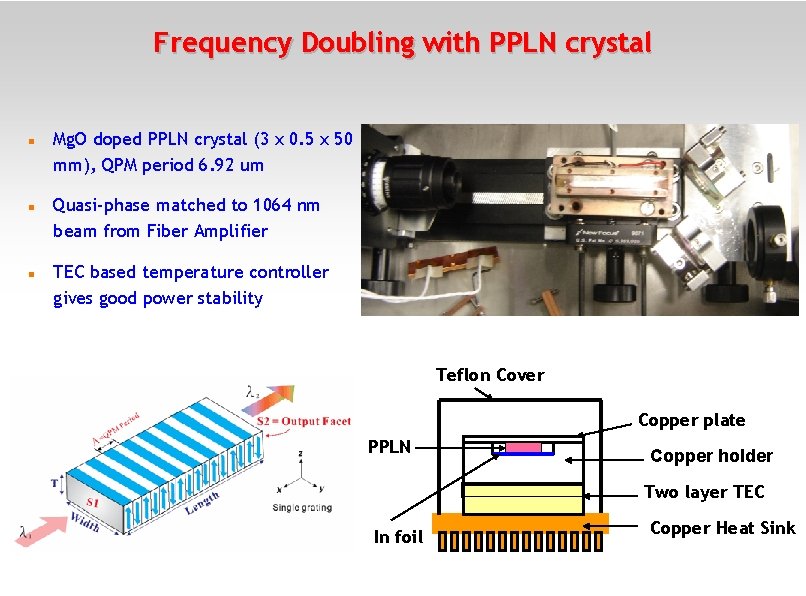
Frequency Doubling with PPLN crystal Mg. O doped PPLN crystal (3 x 0. 5 x 50 mm), QPM period 6. 92 um Quasi-phase matched to 1064 nm beam from Fiber Amplifier TEC based temperature controller gives good power stability Teflon Cover Copper plate PPLN Copper holder Two layer TEC In foil Copper Heat Sink
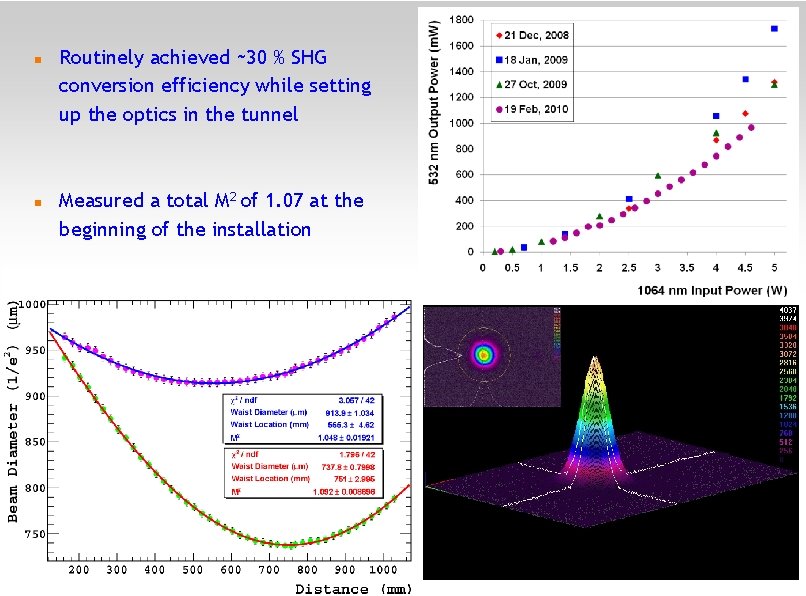
Routinely achieved ~30 % SHG conversion efficiency while setting up the optics in the tunnel Measured a total M 2 of 1. 07 at the beginning of the installation 6
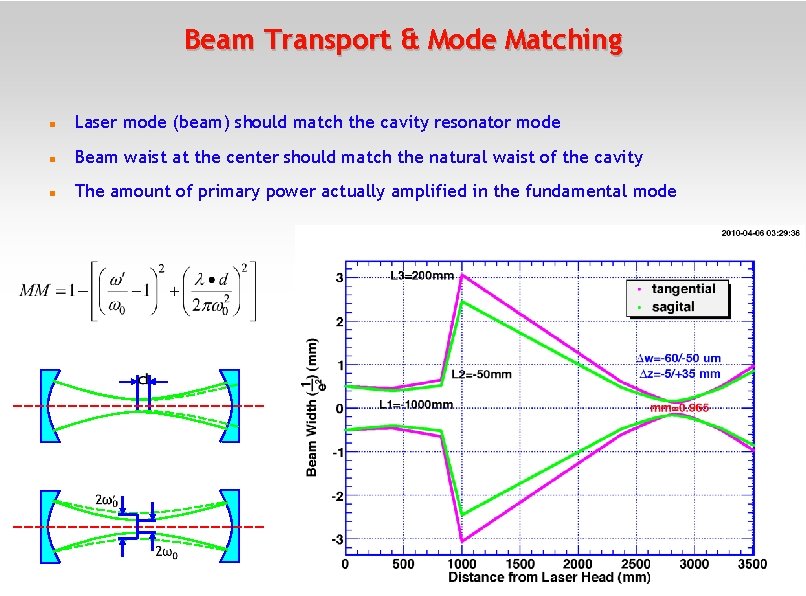
Beam Transport & Mode Matching Laser mode (beam) should match the cavity resonator mode Beam waist at the center should match the natural waist of the cavity The amount of primary power actually amplified in the fundamental mode 7
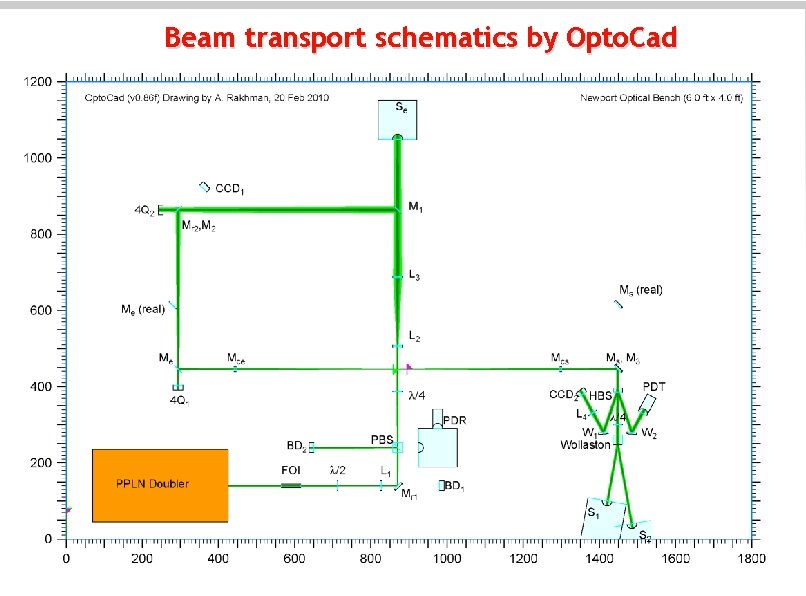
Beam transport schematics by Opto. Cad 8
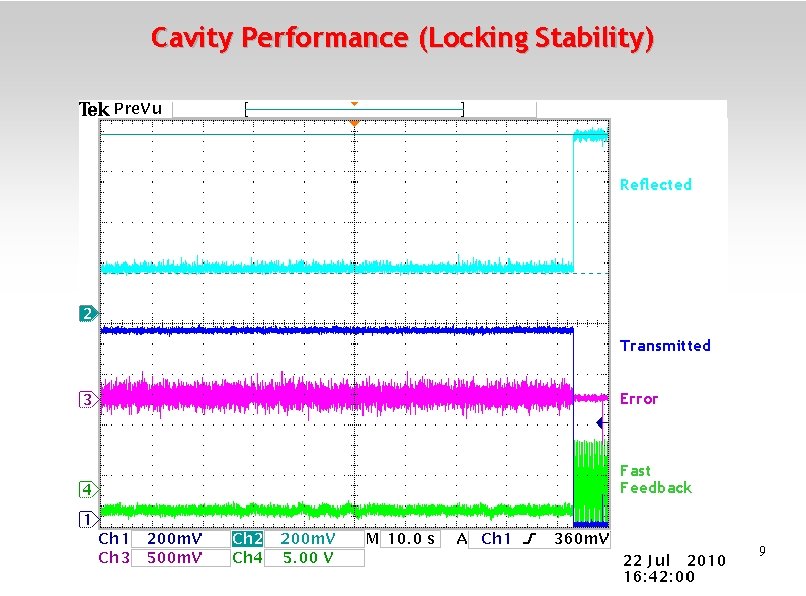
Cavity Performance (Locking Stability) Reflected Transmitted Error Fast Feedback 9
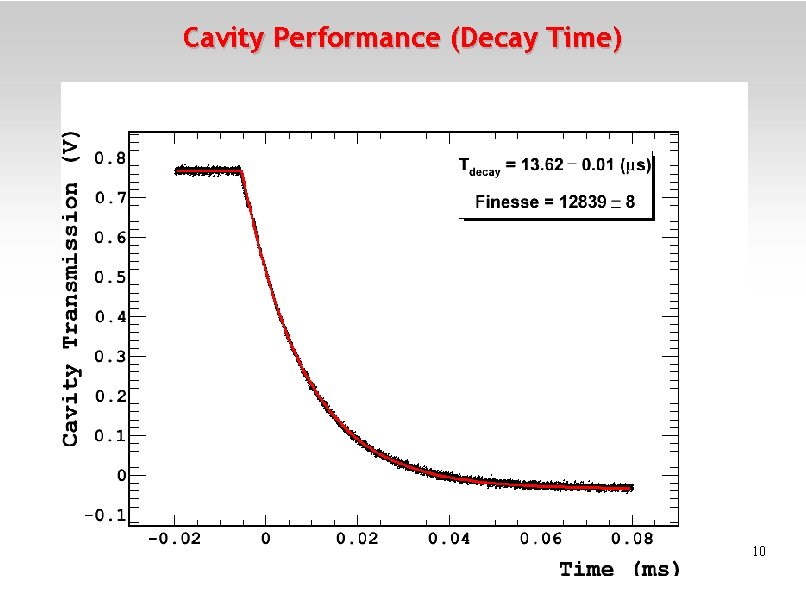
Cavity Performance (Decay Time) 10
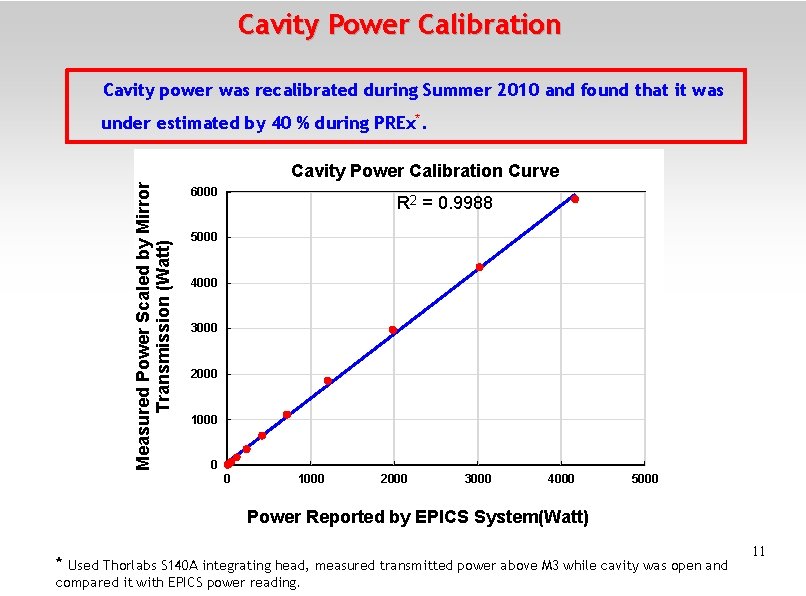
Cavity Power Calibration Cavity power was recalibrated during Summer 2010 and found that it was under estimated by 40 % during PREx*. Measured Power Scaled by Mirror Transmission (Watt) Cavity Power Calibration Curve 6000 R 2 = 0. 9988 5000 4000 3000 2000 1000 0 0 1000 2000 3000 4000 5000 Power Reported by EPICS System(Watt) * Used Thorlabs S 140 A integrating head, measured transmitted power above M 3 while cavity was open and compared it with EPICS power reading. 11
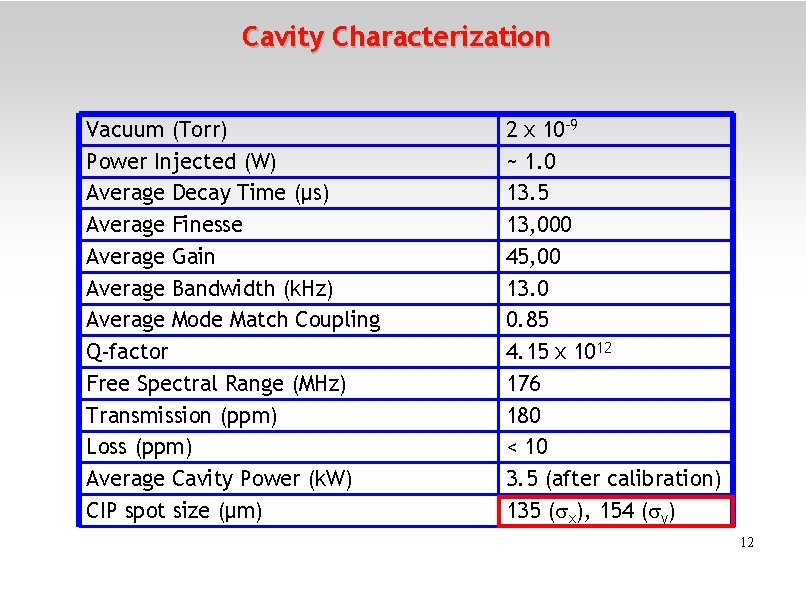
Cavity Characterization Vacuum (Torr) Power Injected (W) Average Decay Time (μs) Average Finesse Average Gain Average Bandwidth (k. Hz) Average Mode Match Coupling Q-factor Free Spectral Range (MHz) Transmission (ppm) Loss (ppm) Average Cavity Power (k. W) CIP spot size (μm) 2 x 10 -9 ~ 1. 0 13. 5 13, 000 45, 00 13. 0 0. 85 4. 15 x 1012 176 180 < 10 3. 5 (after calibration) 135 ( x), 154 ( y) 12
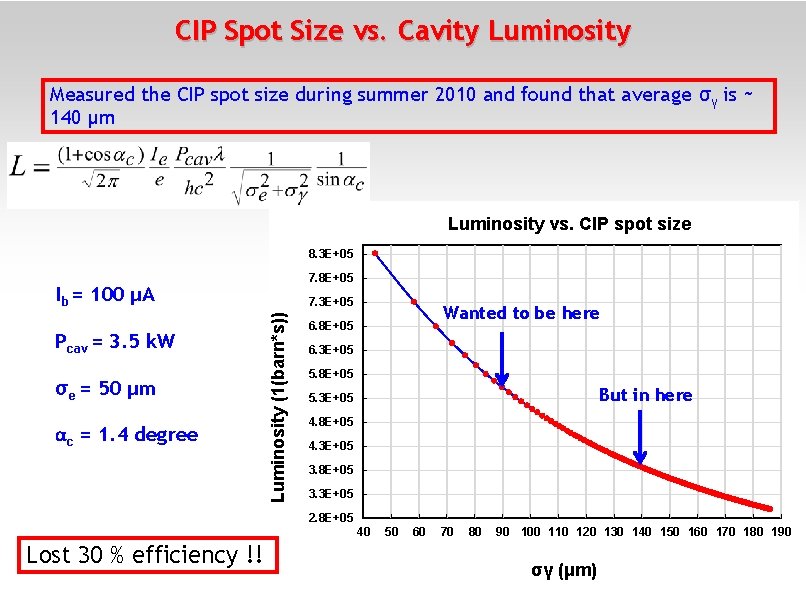
CIP Spot Size vs. Cavity Luminosity Measured the CIP spot size during summer 2010 and found that average σγ is ~ 140 µm Luminosity vs. CIP spot size 8. 3 E+05 7. 8 E+05 Ib = 100 μA σe = 50 μm αc = 1. 4 degree Luminosity (1(barn*s)) Pcav = 3. 5 k. W 7. 3 E+05 Wanted to be here 6. 8 E+05 6. 3 E+05 5. 8 E+05 But in here 5. 3 E+05 4. 8 E+05 4. 3 E+05 3. 8 E+05 3. 3 E+05 2. 8 E+05 40 Lost 30 % efficiency !! 50 60 70 80 90 100 110 120 130 140 150 160 170 180 190 13 σγ (μm)
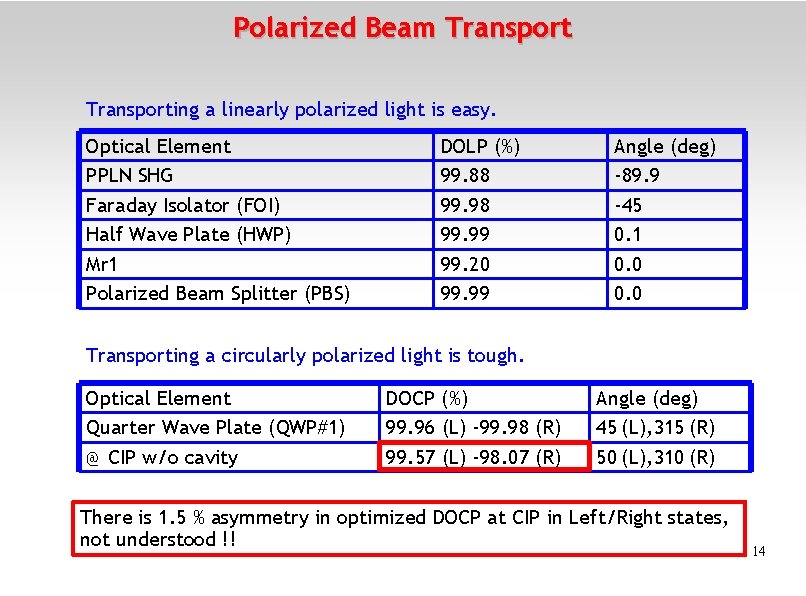
Polarized Beam Transporting a linearly polarized light is easy. Optical Element PPLN SHG Faraday Isolator (FOI) Half Wave Plate (HWP) Mr 1 Polarized Beam Splitter (PBS) DOLP (%) 99. 88 99. 99 99. 20 99. 99 Angle (deg) -89. 9 -45 0. 1 0. 0 Transporting a circularly polarized light is tough. Optical Element Quarter Wave Plate (QWP#1) @ CIP w/o cavity DOCP (%) 99. 96 (L) -99. 98 (R) 99. 57 (L) -98. 07 (R) Angle (deg) 45 (L), 315 (R) 50 (L), 310 (R) There is 1. 5 % asymmetry in optimized DOCP at CIP in Left/Right states, not understood !! 14
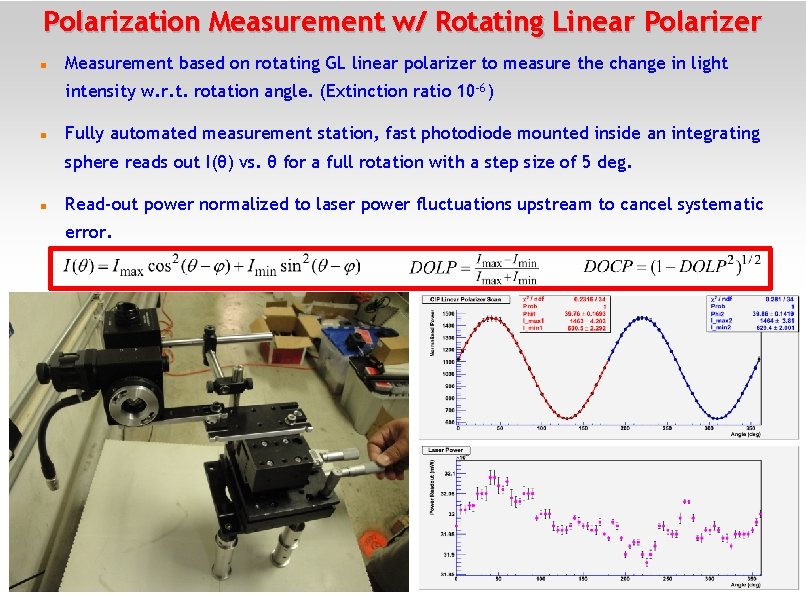
Polarization Measurement w/ Rotating Linear Polarizer Measurement based on rotating GL linear polarizer to measure the change in light intensity w. r. t. rotation angle. (Extinction ratio 10 -6) Fully automated measurement station, fast photodiode mounted inside an integrating sphere reads out I(θ) vs. θ for a full rotation with a step size of 5 deg. Read-out power normalized to laser power fluctuations upstream to cancel systematic error. 15
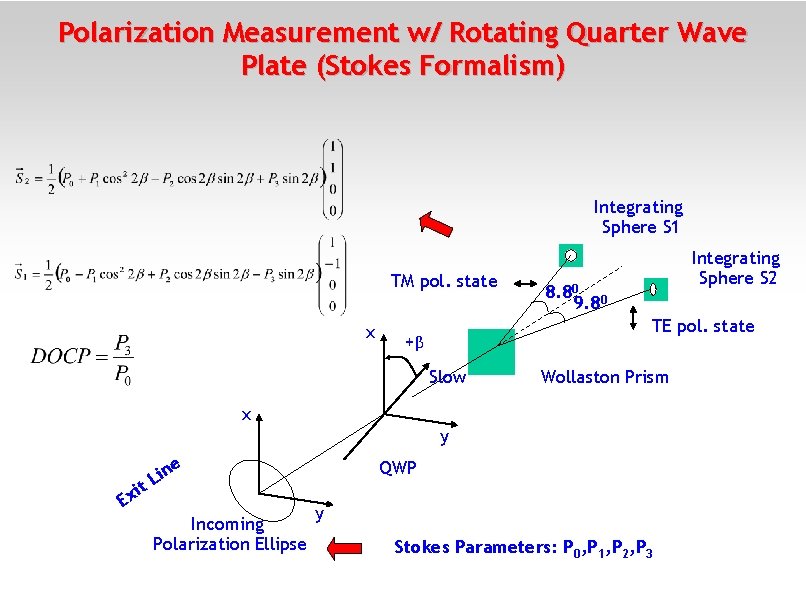
Polarization Measurement w/ Rotating Quarter Wave Plate (Stokes Formalism) Integrating Sphere S 1 TM pol. state x Integrating Sphere S 2 8. 80 0 9. 8 TE pol. state +β Slow Wollaston Prism x y it Ex e n i L Incoming Polarization Ellipse QWP y Stokes Parameters: P 0, P 1, P 2, P 3
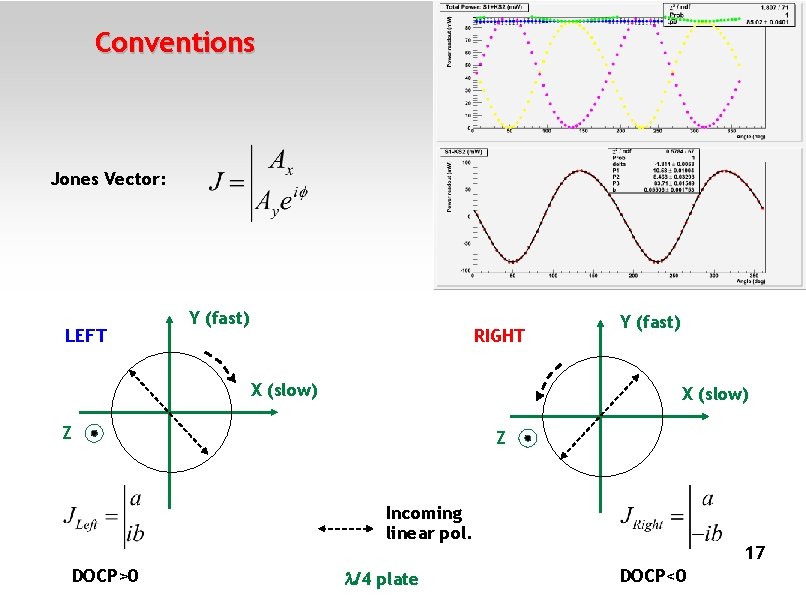
Conventions Jones Vector: LEFT Y (fast) RIGHT X (slow) Y (fast) X (slow) Z Z Incoming linear pol. DOCP>0 /4 plate 17 DOCP<0
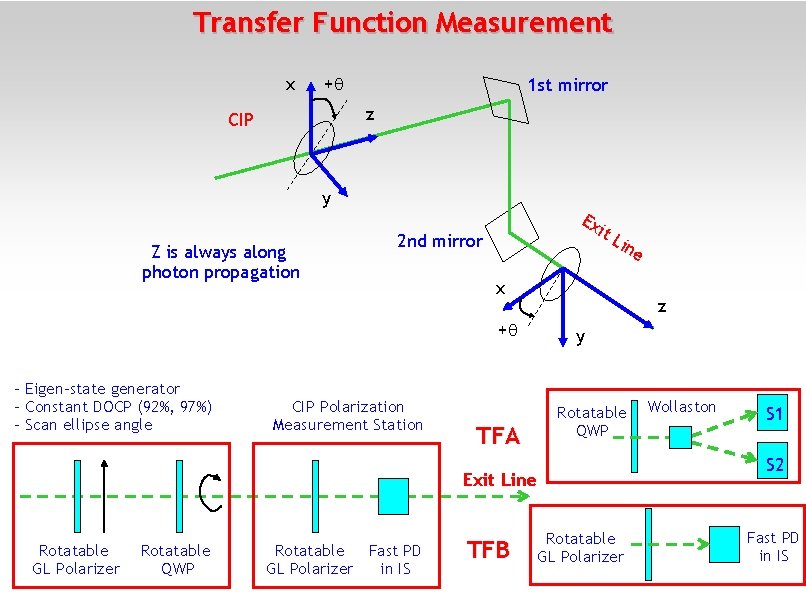
Transfer Function Measurement x + 1 st mirror z CIP y Z is always along photon propagation Ex it L 2 nd mirror x z + - Eigen-state generator - Constant DOCP (92%, 97%) - Scan ellipse angle CIP Polarization Measurement Station ine y Rotatable QWP TFA Exit Line Rotatable GL Polarizer Rotatable QWP Rotatable Fast PD GL Polarizer in IS TFB Rotatable GL Polarizer Wollaston S 1 S 2 Fast PD in IS
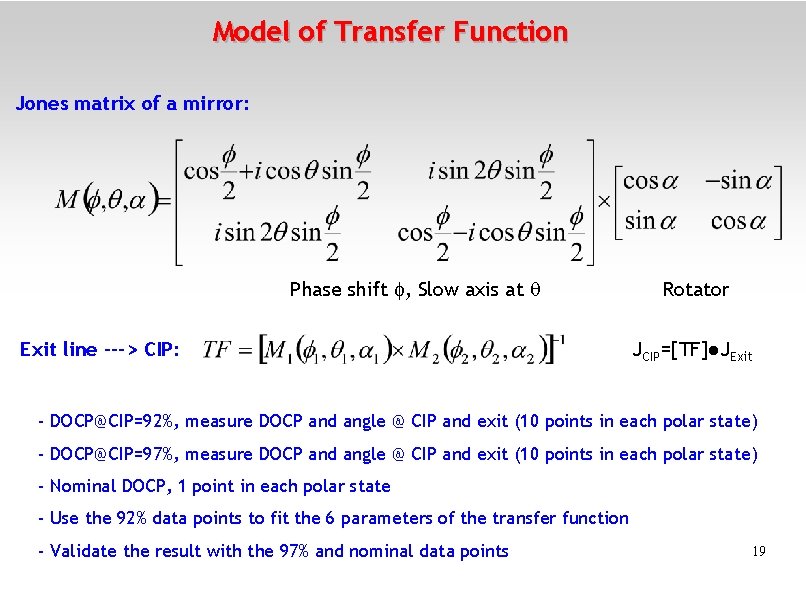
Model of Transfer Function Jones matrix of a mirror: Phase shift , Slow axis at Exit line ---> CIP: Rotator JCIP=[TF]●JExit - DOCP@CIP=92%, measure DOCP and angle @ CIP and exit (10 points in each polar state) - DOCP@CIP=97%, measure DOCP and angle @ CIP and exit (10 points in each polar state) - Nominal DOCP, 1 point in each polar state - Use the 92% data points to fit the 6 parameters of the transfer function - Validate the result with the 97% and nominal data points 19
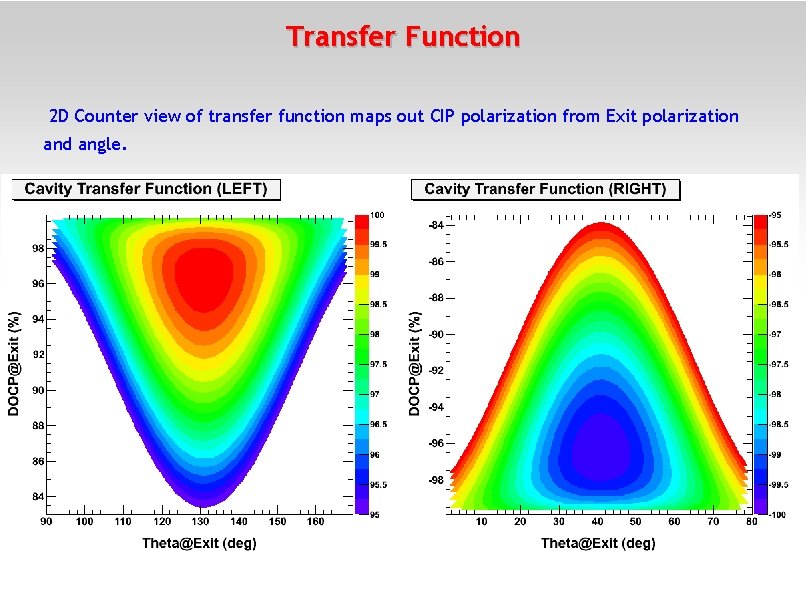
Transfer Function 2 D Counter view of transfer function maps out CIP polarization from Exit polarization and angle. 20
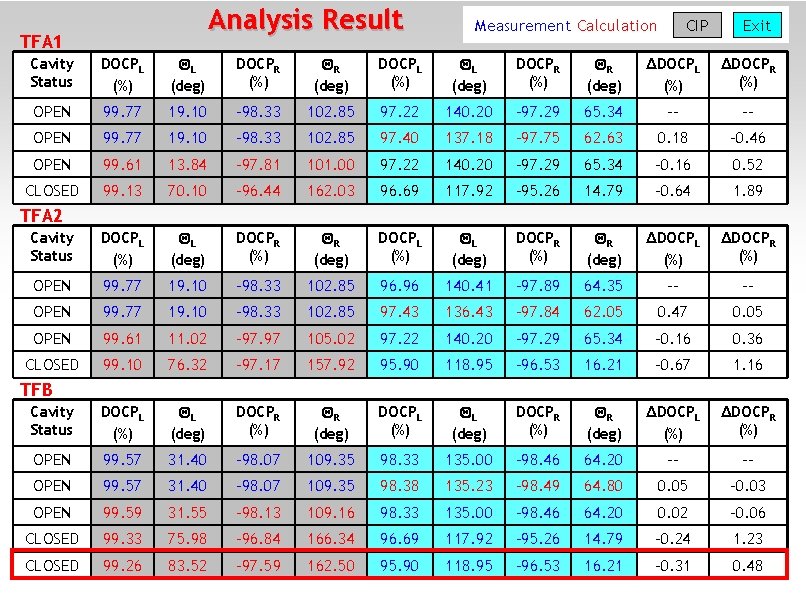
Analysis Result TFA 1 Measurement Calculation CIP Exit Cavity Status DOCPL (%) L (deg) DOCPR (%) R (deg) ΔDOCPL (%) ΔDOCPR (%) OPEN 99. 77 19. 10 -98. 33 102. 85 97. 22 140. 20 -97. 29 65. 34 -- -- OPEN 99. 77 19. 10 -98. 33 102. 85 97. 40 137. 18 -97. 75 62. 63 0. 18 -0. 46 OPEN 99. 61 13. 84 -97. 81 101. 00 97. 22 140. 20 -97. 29 65. 34 -0. 16 0. 52 CLOSED 99. 13 70. 10 -96. 44 162. 03 96. 69 117. 92 -95. 26 14. 79 -0. 64 1. 89 Cavity Status DOCPL (%) L (deg) DOCPR (%) R (deg) ΔDOCPL (%) ΔDOCPR (%) OPEN 99. 77 19. 10 -98. 33 102. 85 96. 96 140. 41 -97. 89 64. 35 -- -- OPEN 99. 77 19. 10 -98. 33 102. 85 97. 43 136. 43 -97. 84 62. 05 0. 47 0. 05 OPEN 99. 61 11. 02 -97. 97 105. 02 97. 22 140. 20 -97. 29 65. 34 -0. 16 0. 36 CLOSED 99. 10 76. 32 -97. 17 157. 92 95. 90 118. 95 -96. 53 16. 21 -0. 67 1. 16 Cavity Status DOCPL (%) L (deg) DOCPR (%) R (deg) ΔDOCPL (%) ΔDOCPR (%) OPEN 99. 57 31. 40 -98. 07 109. 35 98. 33 135. 00 -98. 46 64. 20 -- -- OPEN 99. 57 31. 40 -98. 07 109. 35 98. 38 135. 23 -98. 49 64. 80 0. 05 -0. 03 OPEN 99. 59 31. 55 -98. 13 109. 16 98. 33 135. 00 -98. 46 64. 20 0. 02 -0. 06 CLOSED 99. 33 75. 98 -96. 84 166. 34 96. 69 117. 92 -95. 26 14. 79 -0. 24 1. 23 CLOSED 99. 26 83. 52 -97. 59 162. 50 95. 90 118. 95 -96. 53 16. 21 -0. 31 0. 48 TFA 2 TFB 21
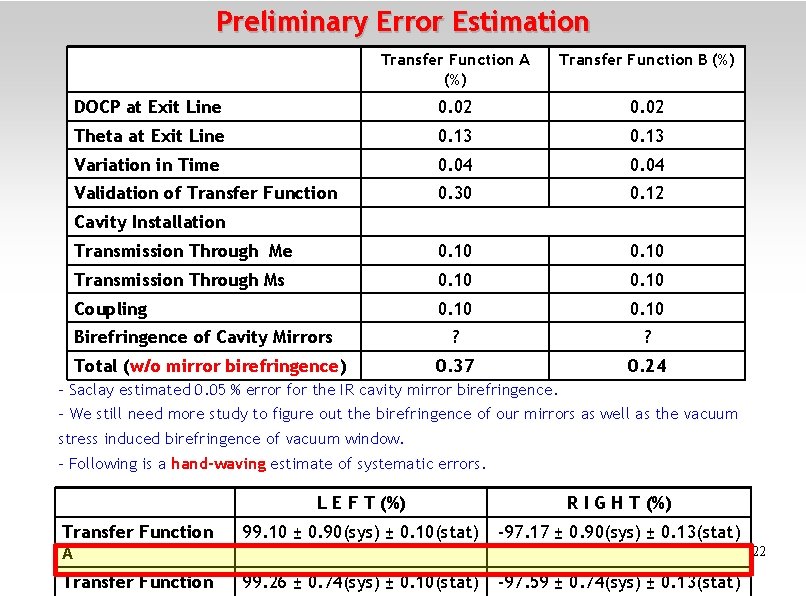
Preliminary Error Estimation Transfer Function A (%) Transfer Function B (%) DOCP at Exit Line 0. 02 Theta at Exit Line 0. 13 Variation in Time 0. 04 Validation of Transfer Function 0. 30 0. 12 Transmission Through Me 0. 10 Transmission Through Ms 0. 10 Coupling 0. 10 ? ? 0. 37 0. 24 Cavity Installation Birefringence of Cavity Mirrors Total (w/o mirror birefringence) - Saclay estimated 0. 05 % error for the IR cavity mirror birefringence. - We still need more study to figure out the birefringence of our mirrors as well as the vacuum stress induced birefringence of vacuum window. - Following is a hand-waving estimate of systematic errors. L E F T (%) R I G H T (%) Transfer Function A 99. 10 ± 0. 90(sys) ± 0. 10(stat) -97. 17 ± 0. 90(sys) ± 0. 13(stat) Transfer Function 99. 26 ± 0. 74(sys) ± 0. 10(stat) 22 -97. 59 ± 0. 74(sys) ± 0. 13(stat)
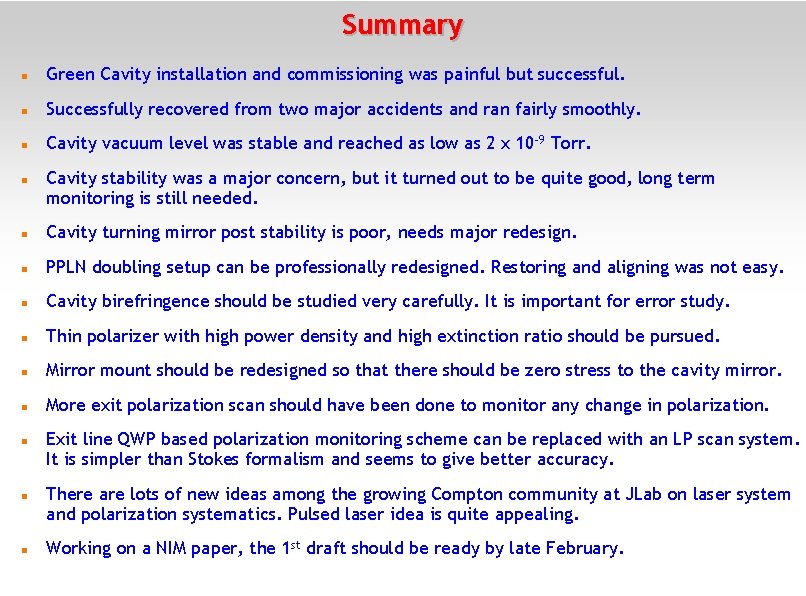
Summary Green Cavity installation and commissioning was painful but successful. Successfully recovered from two major accidents and ran fairly smoothly. Cavity vacuum level was stable and reached as low as 2 x 10 -9 Torr. Cavity stability was a major concern, but it turned out to be quite good, long term monitoring is still needed. Cavity turning mirror post stability is poor, needs major redesign. PPLN doubling setup can be professionally redesigned. Restoring and aligning was not easy. Cavity birefringence should be studied very carefully. It is important for error study. Thin polarizer with high power density and high extinction ratio should be pursued. Mirror mount should be redesigned so that there should be zero stress to the cavity mirror. More exit polarization scan should have been done to monitor any change in polarization. Exit line QWP based polarization monitoring scheme can be replaced with an LP scan system. It is simpler than Stokes formalism and seems to give better accuracy. There are lots of new ideas among the growing Compton community at JLab on laser system and polarization systematics. Pulsed laser idea is quite appealing. Working on a NIM paper, the 1 st draft should be ready by late February.
Acknowledgment Many thanks to those who have contributed, helped and supported to make the green Compton project successful. Special thanks to JLab machine shop. 24
25
Thank you ! 26

27
- Slides: 27