Composite Bar Charts Worksheet A Worksheets increase in

Composite Bar Charts – Worksheet A Worksheets increase in difficulty. There is also a mixed worksheet.

Printing To print handouts from slides Select the slide from the left. Then click: File > Print > ‘Print Current Slide’ To print multiple slides Click on a section title to highlight all those slides, or press ‘Ctrl’ at the same time as selecting slides to highlight more than one. Then click: File > Print > ‘Print Selection’ To print double-sided handouts Highlight both slides before using ‘Print Selection’. Choose ‘Print on Both Sides’ and ‘Flip on Short Edge’.
 A cafe recorded the drinks it sold over 4")
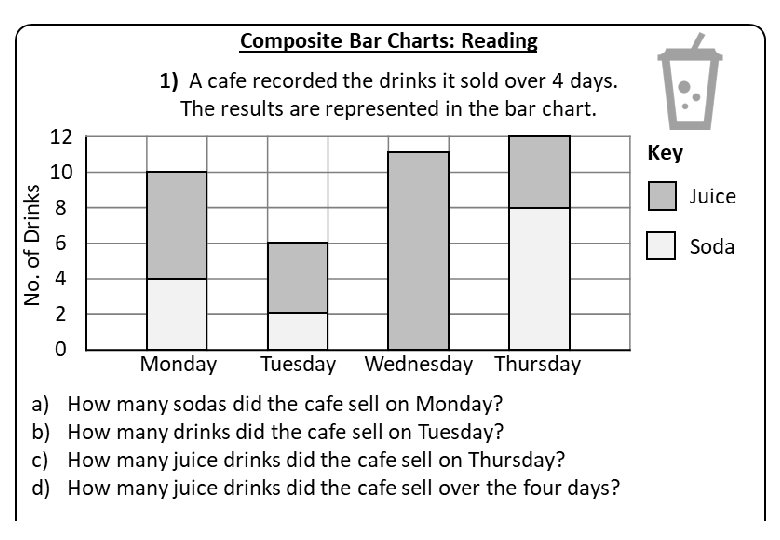
Composite Bar Charts: Reading 1) A cafe recorded the drinks it sold over 4 days. The results are represented in the bar chart. No. of Drinks 12 Key 10 8 Juice 6 Soda 4 2 0 a) b) c) d) Monday Tuesday Wednesday Thursday How many sodas did the cafe sell on Monday? How many drinks did the cafe sell on Tuesday? How many juice drinks did the cafe sell on Thursday? How many juice drinks did the cafe sell over the four days? 2) A shop recorded snacks sold. Frequency 30 Key 25 Doughnut 20 Cookie 15 10 5 0 a) b) c) d) e) f) Mon. Tues. Wed. Thurs. Fri. How many doughnuts were sold on Tuesday? How many cookies were sold on Thursday? How many snacks were sold on Friday? On Wednesday how many more cookies were sold than doughnuts? How many doughnuts were sold on Monday and Tuesday? In total, how many more cookies were sold compared to doughnuts?
 The table shows pairs of Shoes & Socks sold")
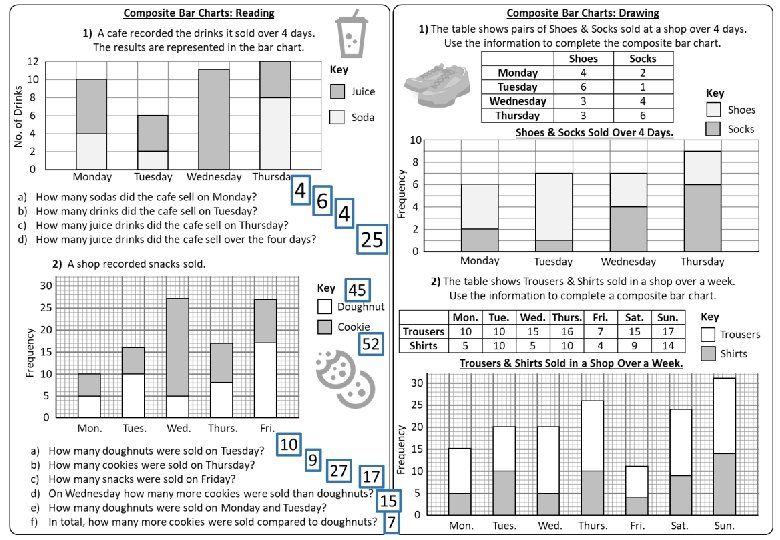
Composite Bar Charts: Drawing 1) The table shows pairs of Shoes & Socks sold at a shop over 4 days. Use the information to complete the composite bar chart. Shoes Socks Monday 4 2 Tuesday 6 1 Key Wednesday 3 4 Shoes Thursday 3 6 Socks Shoes & Socks Sold Over 4 Days. 10 Frequency 8 6 4 2 0 Monday Tuesday Thursday Wednesday 2) The table shows Trousers & Shirts sold in a shop over a week. Use the information to complete a composite bar chart. Sat. 15 9 Sun. 17 14 Frequency Mon. Tue. Wed. Thurs. Fri. Trousers 10 10 15 16 7 Shirts 5 10 4 Mon. Tues. Wed. Thurs. Fri. Sat. Sun.
 A cafe recorded the drinks it sold over 4")
Composite Bar Charts: Reading 1) A cafe recorded the drinks it sold over 4 days. The results are represented in the bar chart. No. of Drinks 12 Key 10 8 Juice 6 Soda 4 2 0 a) b) c) d) Monday Tuesday Wednesday Thursday 4 6 How many sodas did the cafe sell on Monday? How many drinks did the cafe sell on Tuesday? How many juice drinks did the cafe sell on Thursday? How many juice drinks did the cafe sell over the four days? 4 25 2) A shop recorded snacks sold. Frequency 30 Key 25 Doughnut 20 Cookie 45 52 15 10 5 0 a) b) c) d) e) f) Mon. Tues. Wed. Thurs. Fri. How many doughnuts were sold on Tuesday? 10 9 How many cookies were sold on Thursday? 27 17 How many snacks were sold on Friday? On Wednesday how many more cookies were sold than doughnuts? 15 How many doughnuts were sold on Monday and Tuesday? In total, how many more cookies were sold compared to doughnuts? 7
 The table shows pairs of Shoes & Socks sold")
Composite Bar Charts: Drawing 1) The table shows pairs of Shoes & Socks sold at a shop over 4 days. Use the information to complete the composite bar chart. Shoes Socks Monday 4 2 Tuesday 6 1 Key Wednesday 3 4 Shoes Thursday 3 6 Socks Shoes & Socks Sold Over 4 Days. 10 Frequency 8 6 4 2 0 Monday Tuesday Wednesday Thursday 2) The table shows Trousers & Shirts sold in a shop over a week. Use the information to complete a composite bar chart. Mon. Tue. Wed. Thurs. Fri. Sat. Sun. Trousers 10 10 15 16 7 15 17 Shirts 5 10 4 9 14 Trousers & Shirts Sold in a Shop Over a Week. Key Trousers Shirts 30 Frequency 25 20 15 10 5 0 Mon. Tues. Wed. Thurs. Fri. Sat. Sun.
 A cafe recorded the drinks it sold over 4")
Composite Bar Charts: Reading 1) A cafe recorded the drinks it sold over 4 days. The results are represented in the bar chart. 10 8 Juice 6 Soda 4 2 0 a) b) c) d) 12 Key Monday Tuesday No. of Drinks 12 Composite Bar Charts: Reading Key 10 8 Juice 6 Soda 4 2 0 Wednesday Thursday a) b) c) d) How many sodas did the cafe sell on Monday? How many drinks did the cafe sell on Tuesday? How many juice drinks did the cafe sell on Thursday? How many juice drinks did the cafe sell over the four days? Monday Wednesday Thursday How many sodas did the cafe sell on Monday? How many drinks did the cafe sell on Tuesday? How many juice drinks did the cafe sell on Thursday? How many juice drinks did the cafe sell over the four days? 2) A shop recorded snacks sold. 30 30 Key 25 Doughnut 20 Cookie 15 10 Frequency Tuesday 15 10 5 0 a) b) c) d) e) f) 5 Mon. Tues. Wed. Thurs. 0 Fri. How many doughnuts were sold on Tuesday? How many cookies were sold on Thursday? How many snacks were sold on Friday? On Wednesday how many more cookies were sold than doughnuts? How many doughnuts were sold on Monday and Tuesday? In total, how many more cookies were sold compared to doughnuts? a) b) c) d) e) f) Mon. Tues. Wed. Thurs. Fri. How many doughnuts were sold on Tuesday? How many cookies were sold on Thursday? How many snacks were sold on Friday? On Wednesday how many more cookies were sold than doughnuts? How many doughnuts were sold on Monday and Tuesday? In total, how many more cookies were sold compared to doughnuts?
 The table shows pairs of Shoes & Socks sold")
Composite Bar Charts: Drawing 1) The table shows pairs of Shoes & Socks sold at a shop over 4 days. Use the information to complete the composite bar chart. Shoes Socks Monday 4 2 Tuesday 6 1 Key Wednesday 3 4 Shoes Thursday 3 6 Socks Shoes & Socks Sold Over 4 Days. 10 8 8 Frequency Composite Bar Charts: Drawing 1) The table shows pairs of Shoes & Socks sold at a shop over 4 days. Use the information to complete the composite bar chart. Shoes Socks Monday 4 2 Tuesday 6 1 Key Wednesday 3 4 Shoes Thursday 3 6 Socks Shoes & Socks Sold Over 4 Days. 10 6 4 2 Monday Tuesday 0 Thursday Wednesday 2) The table shows Trousers & Shirts sold in a shop over a week. Use the information to complete a composite bar chart. Sun. 17 14 Tuesday Thursday Wednesday 2) The table shows Trousers & Shirts sold in a shop over a week. Use the information to complete a composite bar chart. Mon. Tue. Wed. Thurs. Fri. Trousers 10 10 15 16 7 Shirts 5 10 4 Sat. 15 9 Sun. 17 14 Frequency Sat. 15 9 Frequency Mon. Tue. Wed. Thurs. Fri. Trousers 10 10 15 16 7 Shirts 5 10 4 Monday Mon. Tues. Wed. Thurs. Fri. Sat. Sun.
 A cafe recorded the drinks it sold over 4")
Composite Bar Charts: Reading 1) A cafe recorded the drinks it sold over 4 days. The results are represented in the bar chart. Key 10 8 Juice 6 Soda 4 2 8 0 Monday Tuesday Frequency No. of Drinks 12 a) b) c) d) Composite Bar Charts: Drawing 1) The table shows pairs of Shoes & Socks sold at a shop over 4 days. Use the information to complete the composite bar chart. Shoes Socks Monday 4 2 Tuesday 6 1 Key Wednesday 3 4 Shoes Thursday 3 6 Socks Shoes & Socks Sold Over 4 Days. 10 Wednesday Thursday How many sodas did the cafe sell on Monday? How many drinks did the cafe sell on Tuesday? How many juice drinks did the cafe sell on Thursday? How many juice drinks did the cafe sell over the four days? Frequency 4 2 0 2) A shop recorded snacks sold. 30 6 Doughnut 20 Cookie 15 Tuesday Thursday Wednesday 2) The table shows Trousers & Shirts sold in a shop over a week. Use the information to complete a composite bar chart. Key 25 Monday Mon. Tue. Wed. Thurs. Fri. Trousers 10 10 15 16 7 Shirts 5 10 4 Sat. 15 9 Sun. 17 14 10 0 a) b) c) d) e) f) Mon. Tues. Wed. Thurs. Fri. How many doughnuts were sold on Tuesday? How many cookies were sold on Thursday? How many snacks were sold on Friday? On Wednesday how many more cookies were sold than doughnuts? How many doughnuts were sold on Monday and Tuesday? In total, how many more cookies were sold compared to doughnuts? Frequency 5 Mon. Tues. Wed. Thurs. Fri. Sat. Sun.

Questions? Comments? Suggestions? …or have you found a mistake!? Any feedback would be appreciated . Please feel free to email: tom@goteachmaths. co. uk
- Slides: 12