Composite Bar Charts Demonstration This resource provides animated

Composite Bar Charts – Demonstration This resource provides animated demonstrations of the mathematical method. Check animations and delete slides not needed for your class.

Ever Apparel sell Hoodies & T-Shirts. On Wednesday they sold 2 hoodies and 2 t-shirts. On Thursday they sold 1 hoodie and 2 t-shirts. On Friday they sold 2 hoodies and 3 t-shirts. On Saturday they sold 4 hoodies and 3 t-shirts. When did they sell the most clothes? How can we make this data easy to read? Frequency Table Wed. Thurs. Fri. Sat. Hoodies 2 1 2 4 T-Shirts 2 2 3 3 A frequency table helps us read the data, but it doesn’t help us visualize it.

Ever Apparel sell Hoodies & T-Shirts. On Wednesday they sold 2 hoodies and 2 t-shirts. On Thursday they sold 1 hoodie and 2 t-shirts. On Friday they sold 2 hoodies and 3 t-shirts. On Saturday they sold 4 hoodies and 3 t-shirts. When did they sell the most clothes? How can we make this data easy to read? 8 7 6 5 Number (frequency) 4 3 2 1 0 Key: Hoodies What’s missing? T-Shirts Wednesday Thursday Day A composite bar chart allows us to easily Friday Saturday compare sets of data.
 How many Hoodies did they sell on Friday? C) How")
Ever Apparel 4 B) How many Hoodies did they sell on Friday? C) How many T-shirts did they sell in total? 8 7 6 5 Number (frequency) 4 3 2 1 0 Key: 3 2 Wednesday 3 A) How many clothes did they sell on Thursday? 3 2 Thursday Day Friday Saturday 10 Hoodies T-Shirts

Dual bar chart What are the advantages & disadvantages of each type of bar chart? Composite bar chart

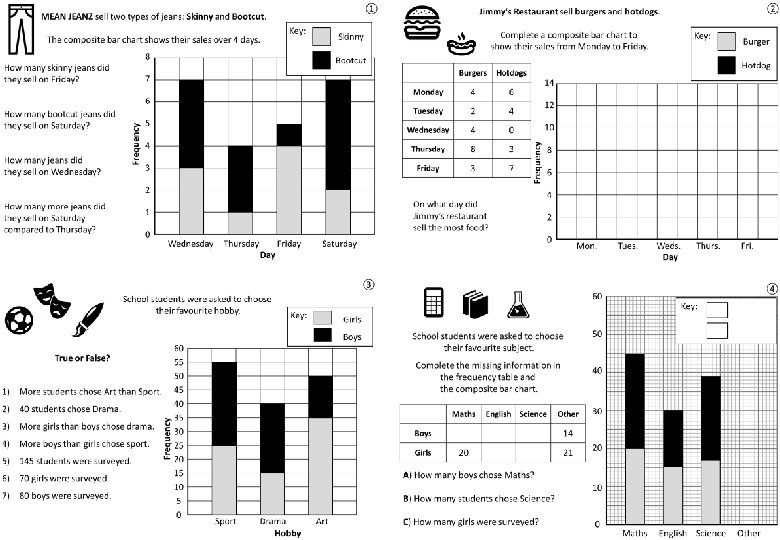
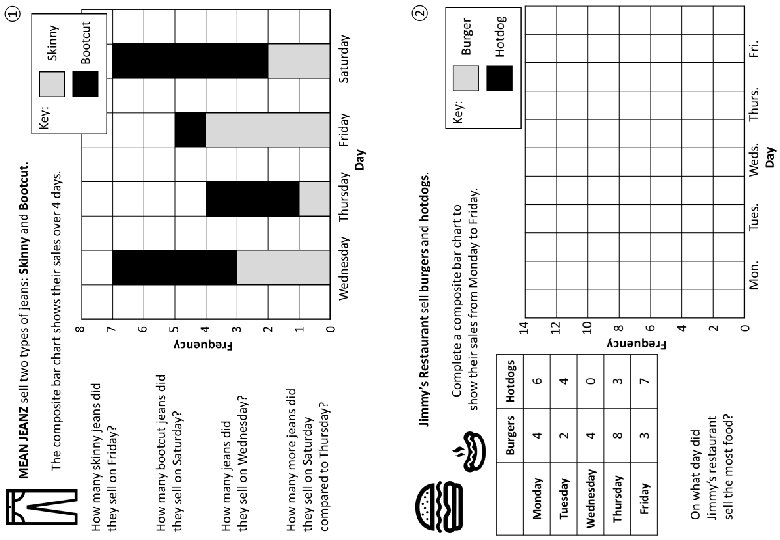
① MEAN JEANZ sell two types of jeans: Skinny and Bootcut. The composite bar chart shows their sales over 4 days. 8 How many skinny jeans did they sell on Friday? Bootcut 5 7 Frequency 6 How many bootcut jeans did they sell on Saturday? How many more jeans did they sell on Saturday compared to Thursday? Skinny 7 4 How many jeans did they sell on Wednesday? Key: 5 4 3 2 1 3 0 Wednesday Thursday Day Friday Saturday

② Jimmy’s Restaurant sell burgers and hotdogs. Complete a composite bar chart to show their sales from Monday to Friday. Hotdogs Monday 4 6 Tuesday 2 4 Wednesday 4 0 Thursday 8 3 Friday 3 7 On what day did Jimmy’s restaurant sell the most food? Thursday Burger Hotdog 14 12 10 Frequency Burgers Key: 8 6 4 2 0 Mon. Tues. Weds. Day Thurs. Fri.
")
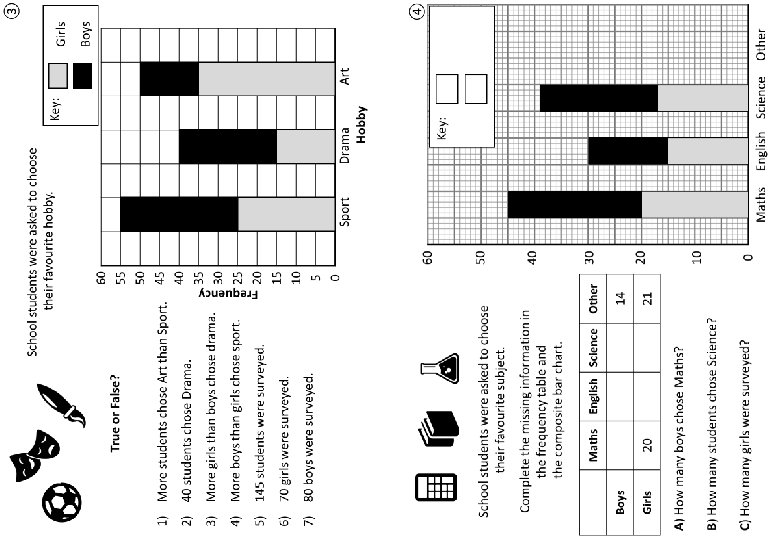
③ School students were asked to choose their favourite hobby. True or False? 1) More students chose Art than Sport. 3) More girls than boys chose drama. 4) More boys than girls chose sport. 5) 145 students were surveyed. 6) 70 girls were surveyed. 7) 80 boys were surveyed. Frequency 2) 40 students chose Drama. 60 55 50 45 40 35 30 25 20 15 10 5 0 Key: Girls Boys Sport Drama Hobby Art

④ 60 School students were asked to choose their favourite subject. Complete the missing information in the frequency table and the composite bar chart. Maths English Science Boys Girls 50 40 Other Boys 25 15 22 14 Girls 20 15 17 21 A) How many boys chose Maths? Key: 25 B) How many students chose Science? 39 C) How many girls were surveyed? 73 30 20 10 0 Maths English Science Other

Answers

① MEAN JEANZ sell two types of jeans: Skinny and Bootcut. The composite bar chart shows their sales over 4 days. Key: 8 How many skinny jeans did they sell on Friday? Skinny Bootcut 7 How many bootcut jeans did they sell on Saturday? How many jeans did they sell on Wednesday? Frequency 6 5 4 3 2 How many more jeans did they sell on Saturday compared to Thursday? 1 0 Wednesday Thursday Day Friday Saturday

② Jimmy’s Restaurant sell burgers and hotdogs. Complete a composite bar chart to show their sales from Monday to Friday. Hotdogs Monday 4 6 Tuesday 2 4 Wednesday 4 0 Thursday 8 3 Friday 3 7 On what day did Jimmy’s restaurant sell the most food? Burger Hotdog 14 12 10 Frequency Burgers Key: 8 6 4 2 0 Mon. Tues. Weds. Day Thurs. Fri.
")
③ School students were asked to choose their favourite hobby. True or False? 1) More students chose Art than Sport. 3) More girls than boys chose drama. 4) More boys than girls chose sport. 5) 145 students were surveyed. 6) 70 girls were surveyed. 7) 80 boys were surveyed. Frequency 2) 40 students chose Drama. 60 55 50 45 40 35 30 25 20 15 10 5 0 Key: Girls Boys Sport Drama Hobby Art

④ 60 School students were asked to choose their favourite subject. Complete the missing information in the frequency table and the composite bar chart. Maths English Science 50 40 Other 30 14 Boys Girls Key: 20 21 20 A) How many boys chose Maths? B) How many students chose Science? C) How many girls were surveyed? 10 0 Maths English Science Other

Questions? Comments? Suggestions? …or have you found a mistake!? Any feedback would be appreciated . Please feel free to email: tom@goteachmaths. co. uk
- Slides: 18