Components of Population Growth Crude Birth Rate CBR
 �Crude Death Rate (CDR) �Natural Increase")
Components of Population Growth �Crude Birth Rate (CBR) �Crude Death Rate (CDR) �Natural Increase Rate (NIR or RNI) �Total Fertility Rate (TFR) �Infant Mortality Rate (IMR)

Crude Birth Rate �Total number of live births in a year for every 1, 000 people alive in the society. �United States = 13 �Niger = 50

Crude Death Rate �Total number of deaths in a year for every 1, 000 people alive in a society. �U. S. = 9 �Niger = 11
 or Rate of Natural Increase (RNI) �The percentage by which")
Natural Increase Rate (NIR) or Rate of Natural Increase (RNI) �The percentage by which population grows in a year. Compute by subtracting CDR from CBR. Natural means births, this excludes migration.

Total Fertility Rate �The average number of children a woman will have in her childbearing years (15 -45).

Infant Mortality Rate The number of deaths under one year of age occurring among the live births in a given year, per 1, 000 live births occurring among the population.

Population Pyramids

Key Terms �Population Pyramid �Dependency Ratio �Age Distribution �Sex Ratio

Key Terms Defined �Population Pyramid: A bar graph representing the distribution of population by age and sex �Dependency Ratio: The number of people under the age of 15 and over age 64 compared to the number of people active in the work force �Age Distribution: The percentage of the population within a country in each age group (broken down into 5 -year intervals) �Sex Ratio: The number of males per 100 females in the population

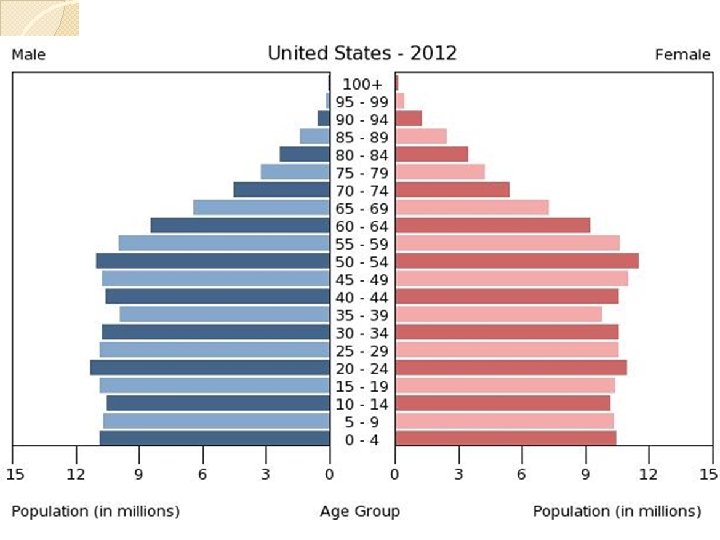
How it works… �Males on the left, females on the right �Youngest on the bottom (0 -4), oldest on the top (100+) �Generally done as a percentage of the population, sometimes as total numbers �Shape of the pyramid is generally shaped by the CBR in a country

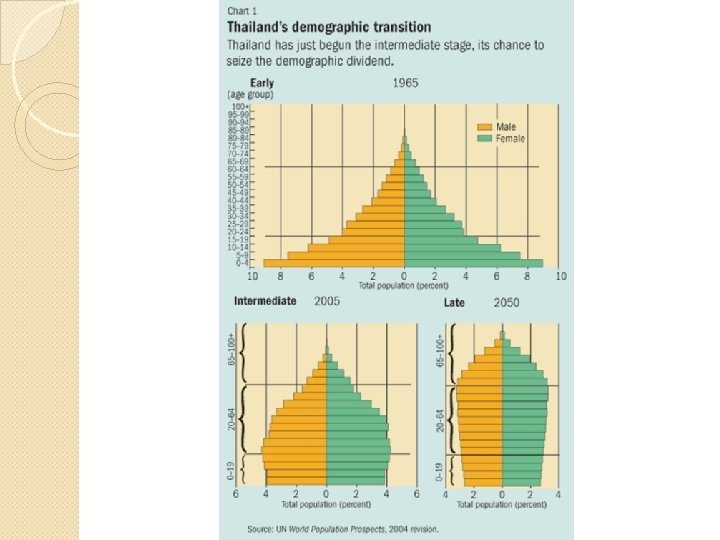
Pyramid for Stage 1 �Wide base = very high birth rate �Narrows very quickly = high death rate �Very few reach old age

Pyramid for Stage 2 �Wide base = High birth rate �Wider & taller = people living longer

Pyramid for Stage 3 �“Domed” shape = more people living to be older �Proportionately fewer births

Pyramid for Stage 4 �Small base, small top �Bulge in the middle �CBR and CDR are low. �Population is stagnant

All four Stages Convex Profile Concave Profile
 � Slow Growth (stage 4)")
Effects of Population Growth � Rapid Growth (stage 2) � Slow Growth (stage 4) ◦ Need services for children ◦ Fewer old people = less money spent on them ◦ People move to cities to find work �Countries with the fastest growth have the fastest growing cities ◦ Quickly constructed buildings to house workers �Often lack vital services (water, electricity, sanitation) ◦ Need services for elderly ◦ Fewer young people = less money spent on them ◦ Could be shortage of workers in the future ◦ Migrants move into the country, often to work in low wage jobs that would be otherwise hard to find workers

http: //www. swissinfo. ch/blob/421 52854/6 f 002 b 6 af 069 e 92 ecbb 1 bd 7 a 3 b 3 e 9 f 2 c/intpopulationstrucutres-en-data. gif

Outside Influences �Migration: young males are more likely to migrate �Famines: can cause a clear drop in population, especially among the very young �War: clear drop in male populations of fighting age

Why? �We can gain a lot of information about a city, nation, region, etc. by looking at a population pyramid.
 Naples, FL (42% over age 65)")
Age Lawrence, KS (College town) Naples, FL (42% over age 65)
")
Gender Unalaska, AK (Military Base)

- Slides: 25