
COMPONENTS FUNCTIONAL RELATIONSHIP BETWEEN SPACES Lana A A
COMPONENTS &FUNCTIONAL RELATIONSHIP BETWEEN SPACES. Lana A. A.
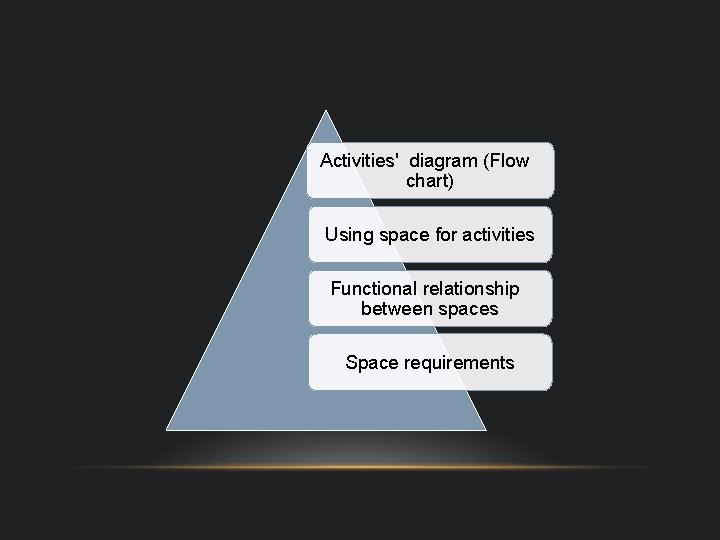
Activities' diagram (Flow chart) Using space for activities Functional relationship between spaces Space requirements
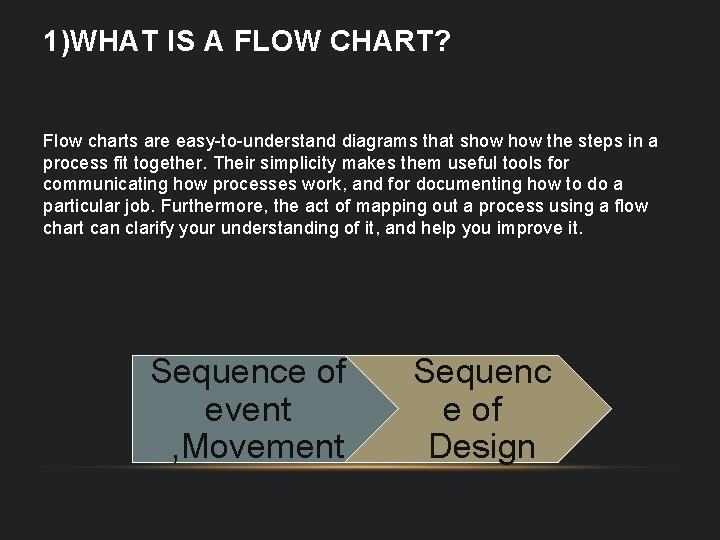
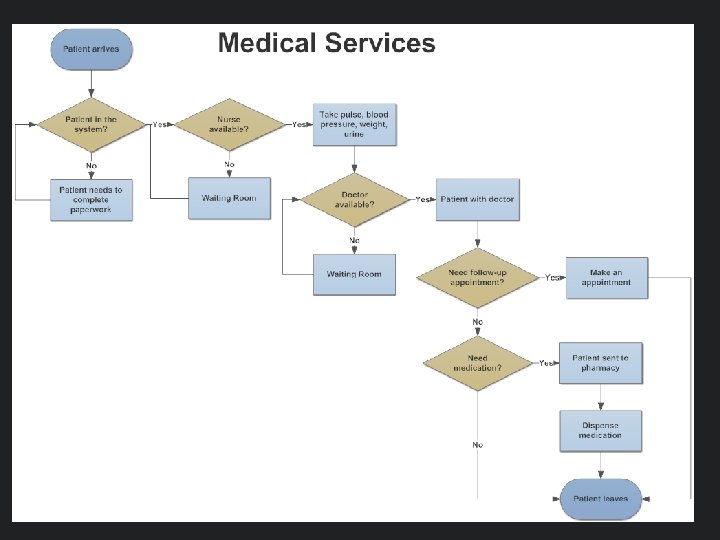
1)WHAT IS A FLOW CHART? Flow charts are easy-to-understand diagrams that show the steps in a process fit together. Their simplicity makes them useful tools for communicating how processes work, and for documenting how to do a particular job. Furthermore, the act of mapping out a process using a flow chart can clarify your understanding of it, and help you improve it. Sequence of event , Movement Sequenc e of Design
2) What did space mean?
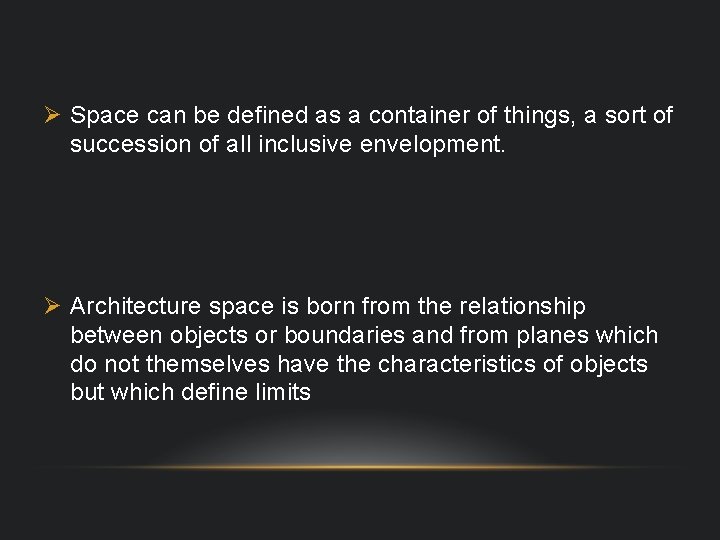
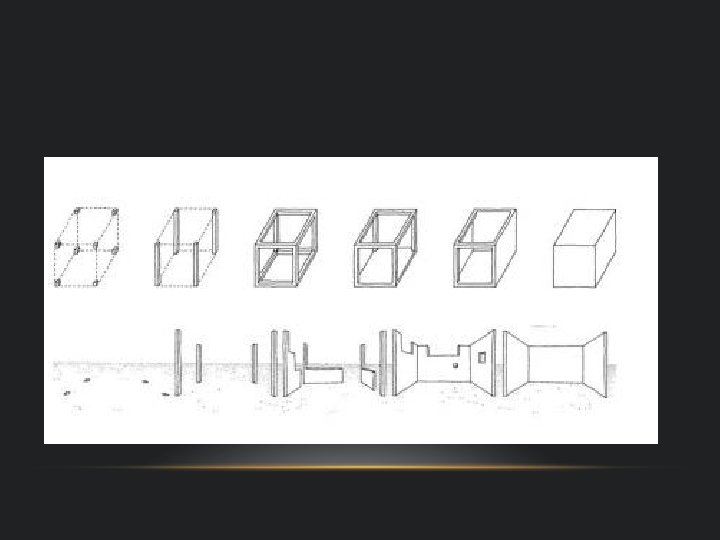
Ø Space can be defined as a container of things, a sort of succession of all inclusive envelopment. Ø Architecture space is born from the relationship between objects or boundaries and from planes which do not themselves have the characteristics of objects but which define limits
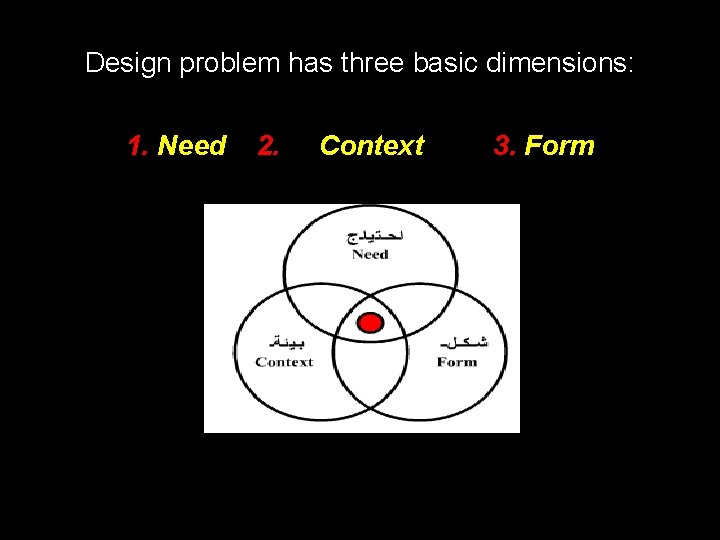
Design problem has three basic dimensions: 1. Need 2. Context 3. Form
Need: includes the following variables and components: 1. Spatial requirements including spaces and components. 2. Relationships between different spaces. 3. Circulation (horizontal & vertical). 4. Priorities to be taken into account in the design. 5. Goals to be achieved. 6. Methods of maintenance required to be provided. 7. Accessibility to the project. 8. Required equipment inside the building. 9. External and internal environment to be provided.
The Need (function, uses or activities) is “provided” by the client and “verified” by architect. The need is translated to a “program” that contains name of functions, required “net areas” and specifications.
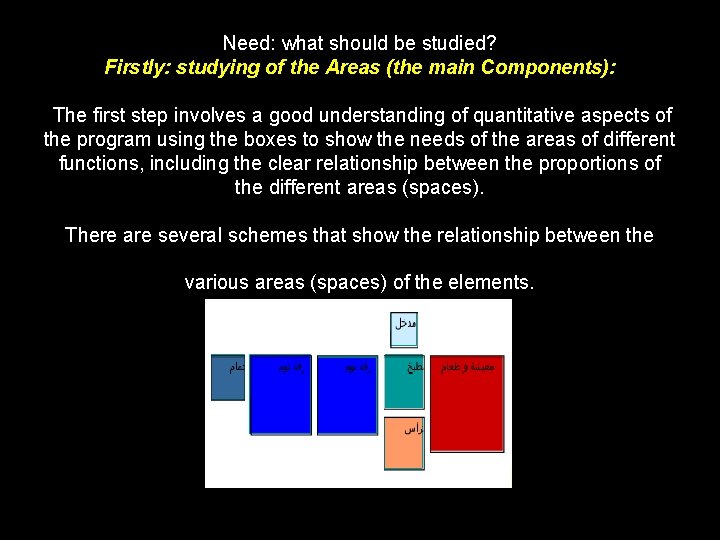
Need: what should be studied? Firstly: studying of the Areas (the main Components): The first step involves a good understanding of quantitative aspects of the program using the boxes to show the needs of the areas of different functions, including the clear relationship between the proportions of the different areas (spaces). There are several schemes that show the relationship between the various areas (spaces) of the elements.
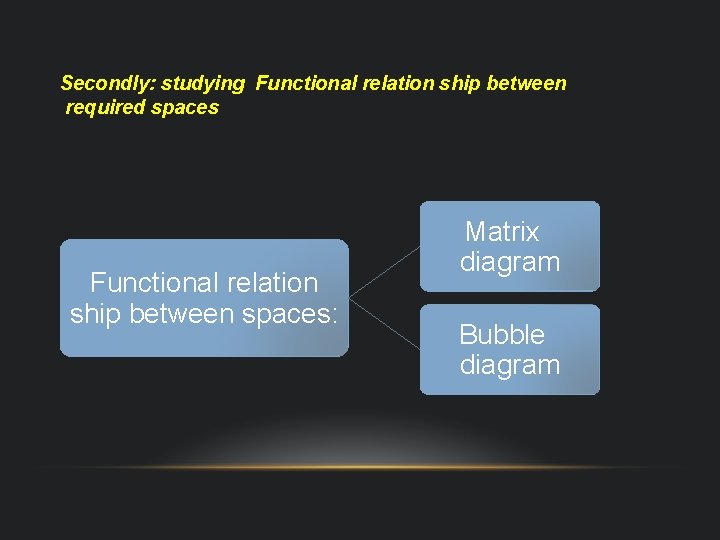
Secondly: studying Functional relation ship between required spaces Functional relation ship between spaces: Matrix diagram Bubble diagram
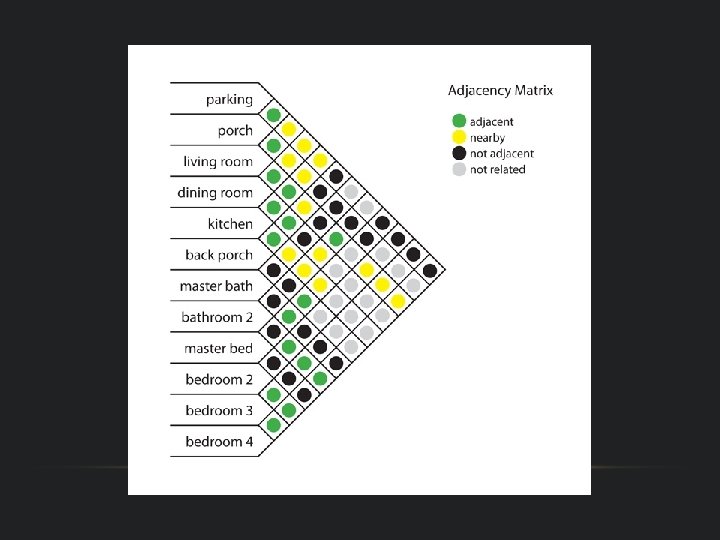
MATRIX DIAGRAM Graphical tool that shows the connection or correlation between ideas or issues in the form of a table (matrix) A relationship is indicated at each intersection of rows and column as present or absent.
Bubble Diagram The Bubble Diagram is an abstract representation of the relative position and size of the spaces listed in the Design Program.
- Slides: 16