Complexities of complex trait genetics Nick Martin With


 Structural equation modelling")
 affecting multiple traits/diseases What are the genetic [and")


.")


 The largest risk factor for melanoma")


, stratified for birth cohort 0, 2")
, stratified for Gender 0, 25 0,")


 unpublished data")

- Slides: 27
Complexities of complex trait genetics Nick Martin With thanks to Dorret Boomsma, Sarah Hartz, Jodie Painter Boulder workshop March 11, 2011
Friday outline - Phenomics 9. 00 Mike / Nick: intro including comorbidity, pleiotropy, endophenotypes (results from based on biology) 10. 00 Hermine / Meike: multivariate phenotypes practical in Mx/open. Mx: multivariate example (Attention Problems in kids; multiple raters and multiple time points, results to be used in second prac) 11. 00 Dorret / Meike / Hermine: Multivariate data with 1 or more SNP (intro and practical) Continuous data 13. 30 Sarah / Mike / Shaun: plink for association analysis in relatives (attention data again) addiction data: SNP with opposite effects on different phenotypes. Ordinal data & thresholds 15. 30 Lindon : Wrap up – the Grand Scheme 16. 30 Close 18. 30 Party at John & Christine Hewitt’s (bus 6 pm from lobby)
How do gene effects vary. . . n n Across correlated traits/diseases For the same trait/disease n n Longitudinally (development, ageing) Between cohorts (secular trends) Between environments (? ) – G x E Between different disease forms/severities
Tools n n n n Inspection of GWAS results (metaanalysis, replication) Structural equation modelling Genetic prediction functions Genome-wide Complex Trait Analysis (GCTA) Genetic factor scores IRT modelling Causal models
Pleiotropy n n The same gene(s) affecting multiple traits/diseases What are the genetic [and environmental] causes of: n n Covariation between continuous traits? Comorbidity between diseases?
Examples of loci shared by conditions or traits previously thought to be unrelated, according to Genomewide Association Studies Manolio T. N Engl J Med 2010; 363: 166 -176
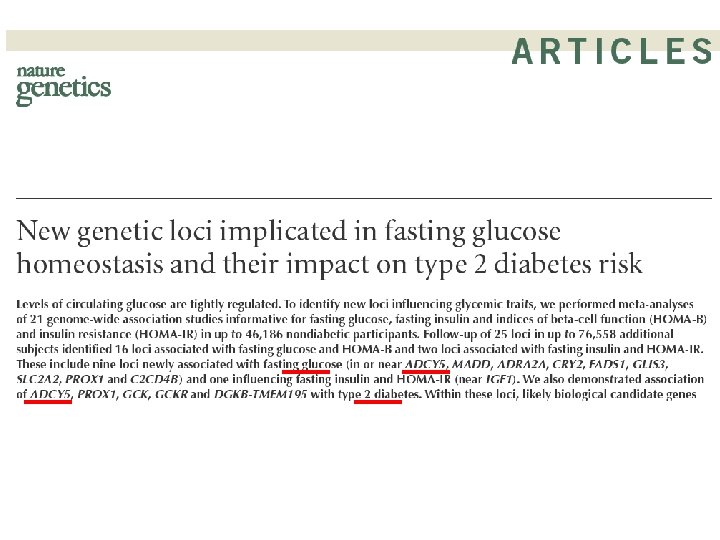
Adenylate cyclase type 5 is an enzyme that has been shown to interact with RGS 2
birth weight and glucose Meta-analysis of six GWA studies (n = 10, 623 Europeans). Two lead signals were followed up (n = 27, 591): rs 900400 near LEKR 1 and CCNL 1 (P = 2 × 10− 35) and rs 9883204 in ADCY 5 (P = 7 × 10− 15) were associated with BW. Correlated SNPs in ADCY 5 were recently implicated in regulation of glucose levels and susceptibility to type 2 diabetes, providing evidence that the well-described association between lower birth weight and T 2 D has a genetic component, distinct from the proposed role of programming by maternal nutrition. Barker hypothesis: low birth weight is a risk factor for cardiovascular disease, type 2 diabetes, . .
Looking for the effect of all tagged SNPs on comorbidity Genome Research 2007 17: 1520 GWAS Population Case-Control “Target “Discovery Set” Genomic profile Top SNPs Set” Risk alleles Sum risk alleles Accurate prediction of genetic risk possible if discriminating genetic variants are identified in a very large sample size: 10, 000 cases and 10, 000 controls Accuracy of Prediction of Genetic risk
R 2 ISC P=2 10 -28 X Test A greater load of “nominal” schizophrenia alleles (from ISC)? 5 10 -11 1 10 -12 7 10 -9 Purcell, Wray et al, Nature, 2009 0. 008 0. 71 MGS Euro. MGS O’Donovan Af-Am Schizophrenia STEP-BD WTCCC Bipolar disorder CAD 0. 05 CD 0. 30 0. 65 HT RA 0. 23 T 1 D Non-psychiatric (WTCCC) 0. 06 T 2 D
How do gene effects vary. . n n Across correlated traits/diseases For the same trait/disease n n Longitudinally (development, ageing) Between cohorts (secular trends) Between environments (? ) – G x E Between different disease forms/severities
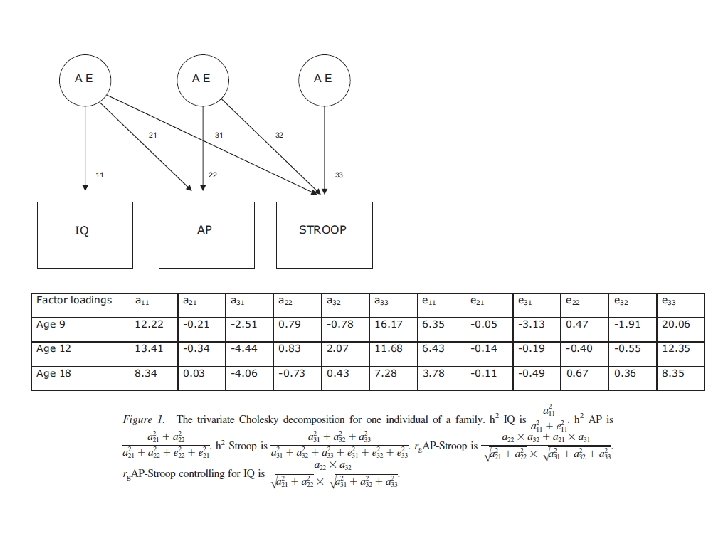
SEM for effect of one SNP on the same trait across development
Melanocytic naevi (common moles) The largest risk factor for melanoma
QIMR GWAS for total, flat and raised nevi IRF 4 MTAP Note inverse association signals for MTAP and IRF 4 with flat and raised nevi
Mole count: Interaction of IRF 4 genotype with age American Journal of Human Genetics 87, 6– 16, 2010
How do gene effects vary. . • Across correlated traits/diseases • For the same trait/disease – Longitudinally (development, ageing) – Between cohorts (secular trends) – Between environments (? ) – G x E – Between different disease forms/severities
Association between CPD and rs 1051730 across studies where subjects are stratified by age of onset of regular smoking (AOS) at or before age 16 versus after age 16. P-value for difference between meta-analysis betas for the two AOS strata is 0. 006. Sarah Hartz
Association between CPD and rs 1051730 (chr 15), stratified for birth cohort 0, 2 US (n=26, 309) 0, 15 Europe (n=3, 909) Australia (n=1, 105) Beta 0, 1 0, 05 0 1920 -1939 1940 -1959 1960 -1979 -0, 05 Laura Bierut Sarah Hartz Peter Kraft Susan Short 21
Association between CPD and rs 1051730 (chr 15), stratified for Gender 0, 25 0, 2 US (n=26, 309) Europe (n=3, 909) Australia (n=1, 105) Beta (SD) 0, 15 0, 1 0, 05 0 male female -0, 05 Laura Bierut Sarah Hartz Peter Kraft Susan Short 22
How do gene effects vary. . • Across correlated traits/diseases • For the same trait/disease – Longitudinally (development, ageing) – Between cohorts (secular trends) – Between environments (? ) – G x E – Between different disease forms/severities
Yang, J. , Lee, S. H. , Goddard, M. E. , and Visscher, P. M. (2011). GCTA: A tool for genome-wide complex trait analysis. Am. J. Hum. Genet. 88, 76– 82. http: //gump. qimr. edu. au/gcta
Genome-wide association study for endometriosis Genotyping endometriosis cases on Illumina 610 K chips – 3194 cases: 2270 QIMR, 924 Oxford Controls from WTCCC (1 M) and QIMR (610 K) – 7060 controls: 5190 UK, 1870 Australian Stage and other phenotypic data available – Stage A (minimal-mild endometriosis): 1686 cases (52. 7%) – Stage B (moderate-severe endometriosis): 1364 cases (42. 7%) – Unknown (UK only): 144 (4. 6%)
“All” endometriosis “Stage B” endometriosis Painter et al. , (2010) unpublished data
Genetic loading in stage A vs stage B • Novel method uses ALL SNPs simultaneously (following rigorous QC) – Yang et al. (2010) Nature Genetics 42: 565 -569 • Calculate realized levels of relatedness between individuals – Remove all ‘actual’ relatives (≥ 0. 05) • Linear mixed models to calculate proportion of variation attributable to case status – Background relatedness in cases vs controls Phenotypes Cases Controls Proportion of P value variation (SE) All endometriosis 3154 6981 0. 27 (0. 04) 4. 4 x 10 -16 Stage A 1666 6981 0. 15 (0. 04) 2. 6 x 10 -4 Stage B 1347 6981 0. 34 (0. 04) 4. 4 x 10 -16 Supported by separate prediction analysis using Oxford as discovery, QIMR as target Painter et al. , (2010) unpublished data