
Complex networks are found throughout biology Can we
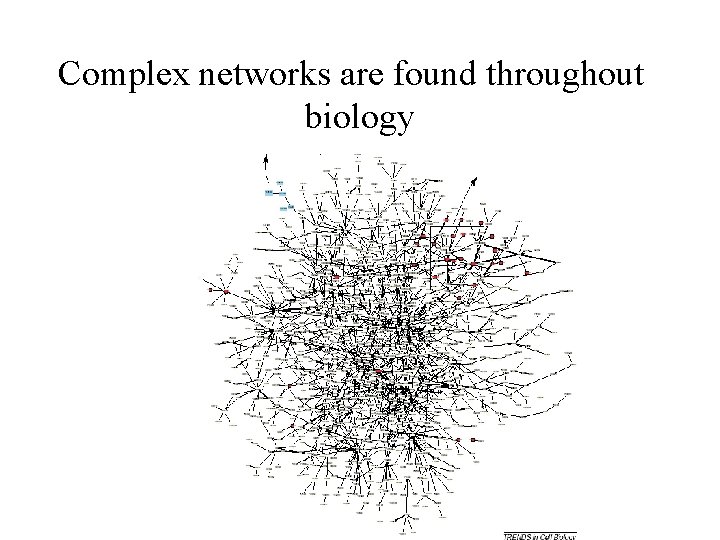
Complex networks are found throughout biology
Can we define the basic building blocks of networks? Generalize the notion of MOTIFS, widely used in sequence analysis, to the level of networks. Sequence motif: a sequence that appears much more frequently than in randomized sequences. ‘Network motif’: a pattern that appear much more frequently than in randomized networks.
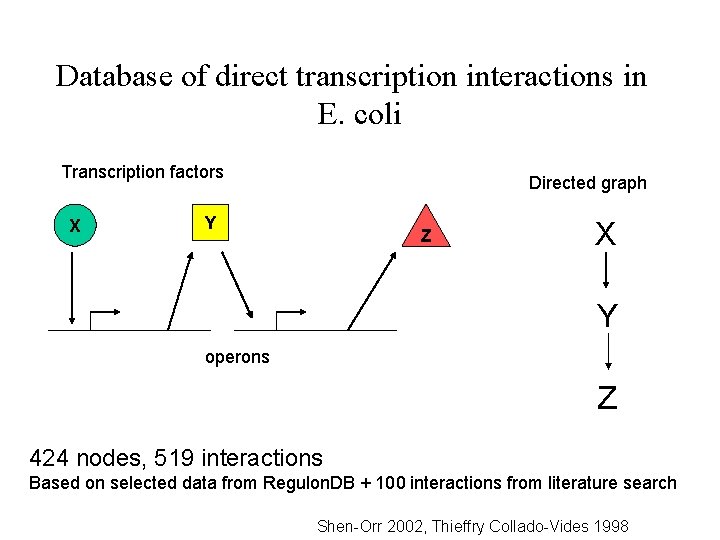
Database of direct transcription interactions in E. coli Transcription factors X Directed graph Y Z X Y operons Z 424 nodes, 519 interactions Based on selected data from Regulon. DB + 100 interactions from literature search Shen-Orr 2002, Thieffry Collado-Vides 1998
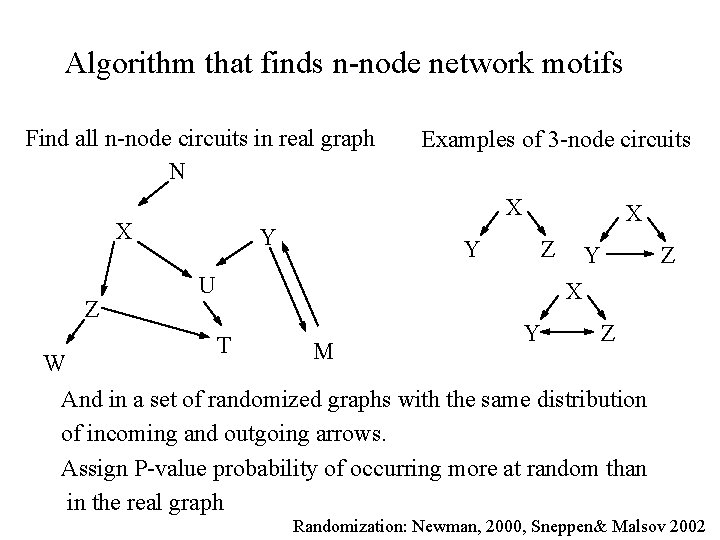
Algorithm that finds n-node network motifs Find all n-node circuits in real graph N X X Z Examples of 3 -node circuits Y X Y Z U Y Z X T Y Z M W And in a set of randomized graphs with the same distribution of incoming and outgoing arrows. Assign P-value probability of occurring more at random than in the real graph Randomization: Newman, 2000, Sneppen& Malsov 2002
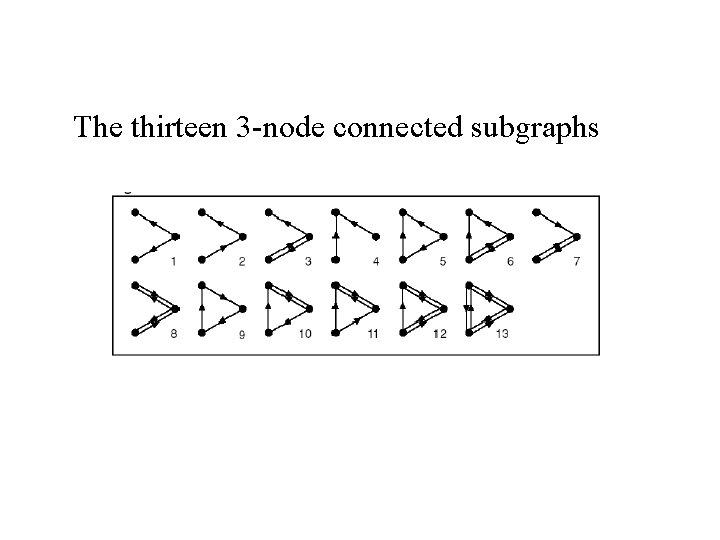
The thirteen 3 -node connected subgraphs
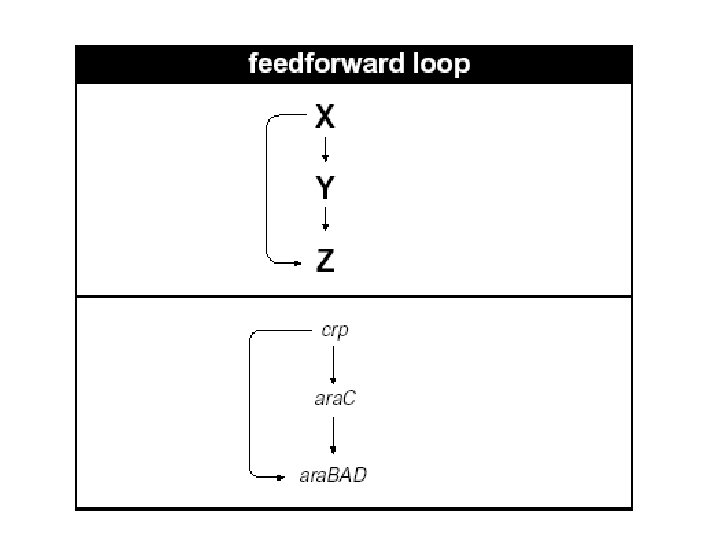
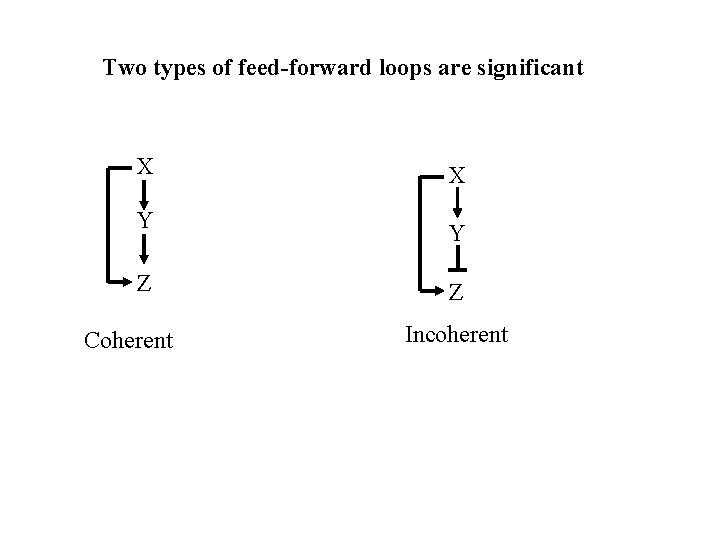
Two types of feed-forward loops are significant X Y Z Coherent X Y Z Incoherent
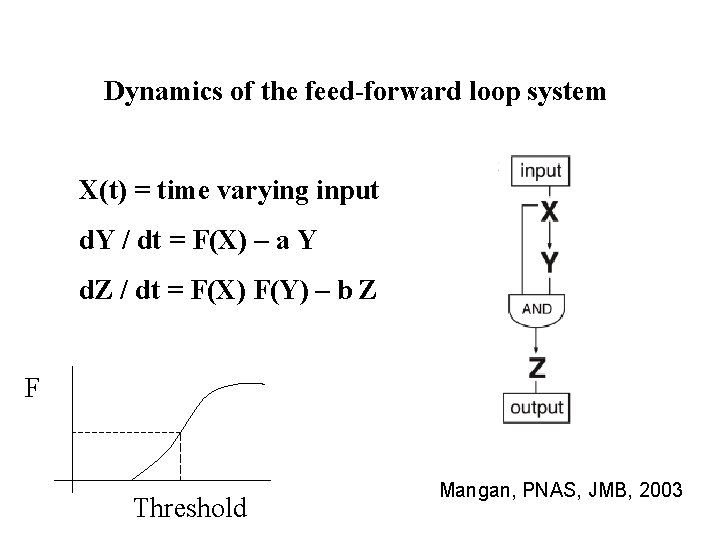
Dynamics of the feed-forward loop system X(t) = time varying input d. Y / dt = F(X) – a Y d. Z / dt = F(X) F(Y) – b Z F Threshold Mangan, PNAS, JMB, 2003
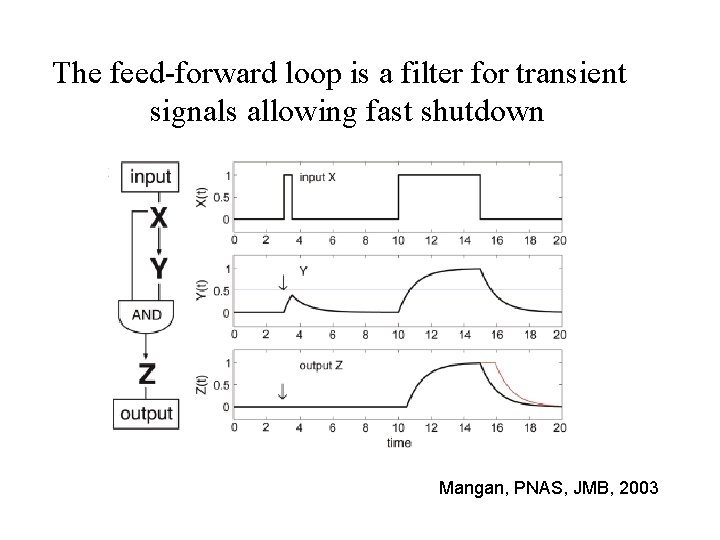
The feed-forward loop is a filter for transient signals allowing fast shutdown Mangan, PNAS, JMB, 2003
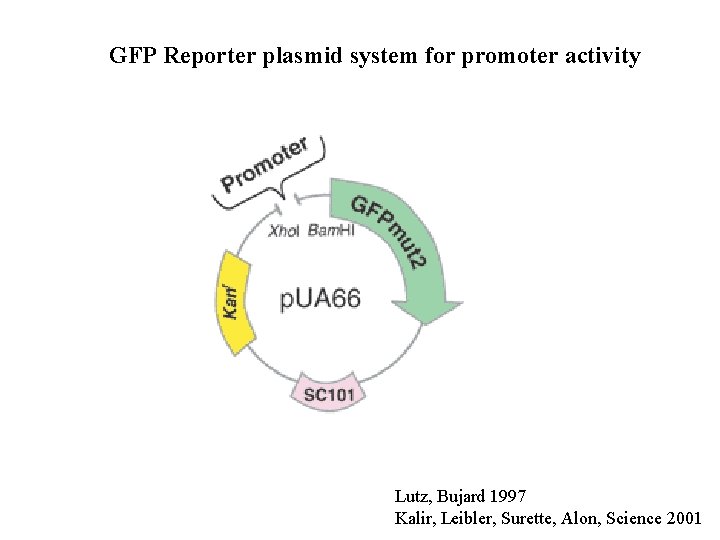
GFP Reporter plasmid system for promoter activity Lutz, Bujard 1997 Kalir, Leibler, Surette, Alon, Science 2001
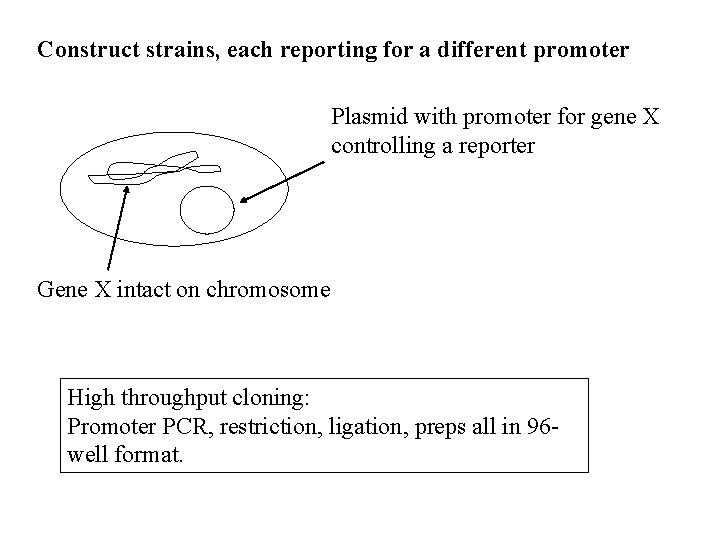
Construct strains, each reporting for a different promoter Plasmid with promoter for gene X controlling a reporter Gene X intact on chromosome High throughput cloning: Promoter PCR, restriction, ligation, preps all in 96 well format.
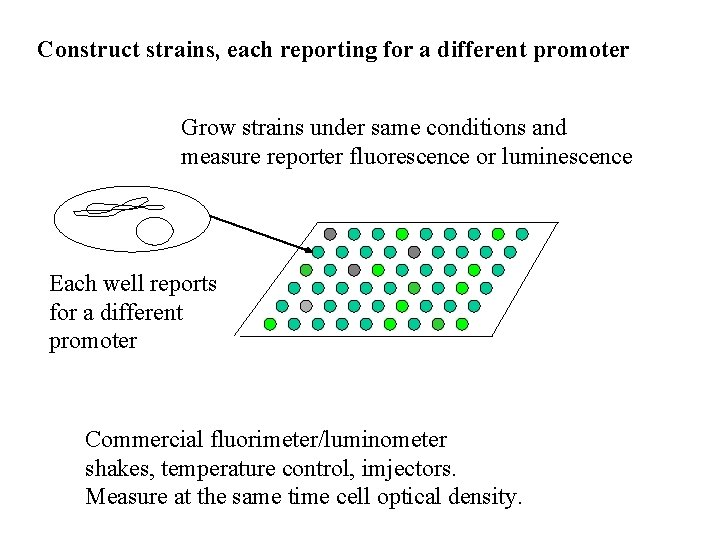
Construct strains, each reporting for a different promoter Grow strains under same conditions and measure reporter fluorescence or luminescence Each well reports for a different promoter Commercial fluorimeter/luminometer shakes, temperature control, imjectors. Measure at the same time cell optical density.
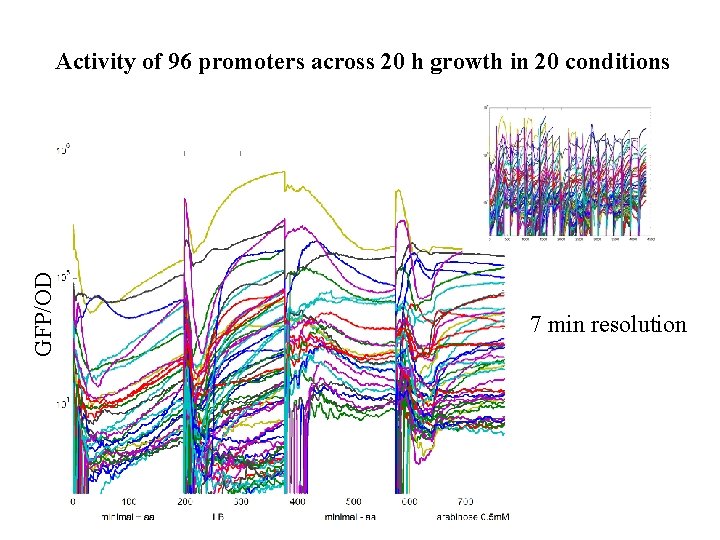
GFP/OD Activity of 96 promoters across 20 h growth in 20 conditions 7 min resolution
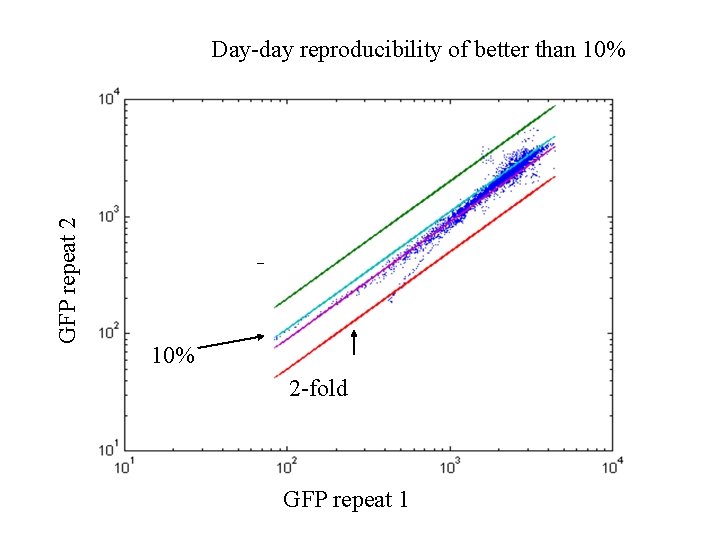
GFP repeat 2 Day-day reproducibility of better than 10% *2 *1. 1 *0. 9 10% *0. 5 2 -fold GFP repeat 1
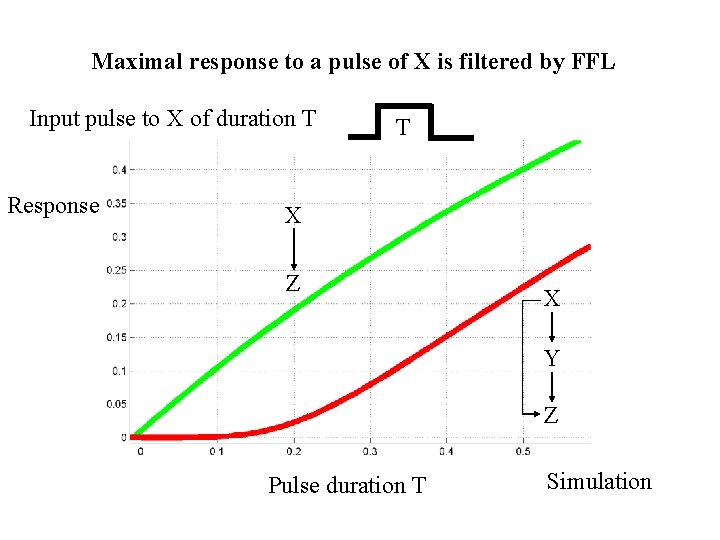
Maximal response to a pulse of X is filtered by FFL Input pulse to X of duration T Response T X Z X Y Z Pulse duration T Simulation
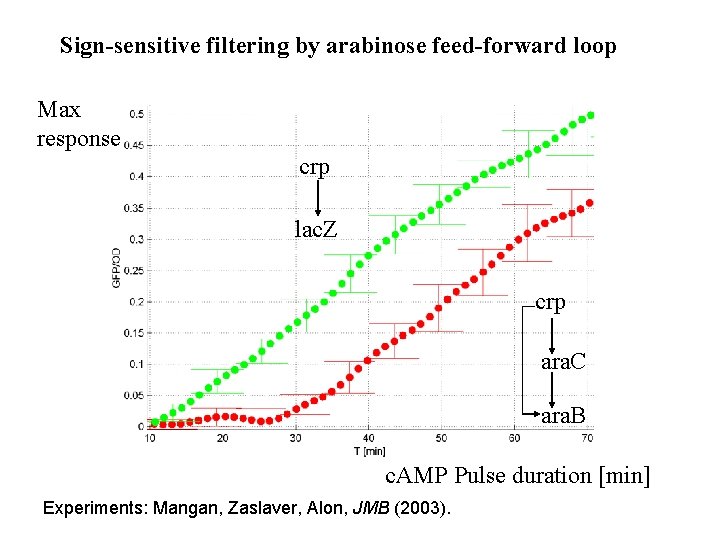
Sign-sensitive filtering by arabinose feed-forward loop Max response crp lac. Z crp ara. C ara. B c. AMP Pulse duration [min] Experiments: Mangan, Zaslaver, Alon, JMB (2003).
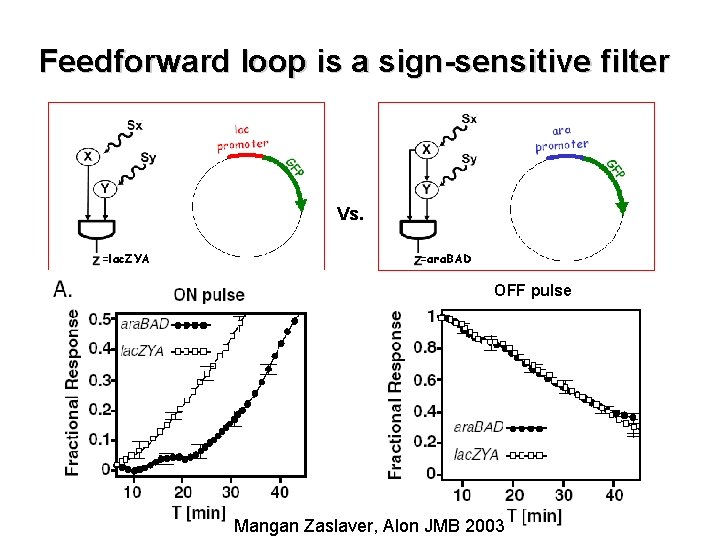
Feedforward loop is a sign-sensitive filter Vs. =lac. ZYA =ara. BAD OFF pulse Mangan Zaslaver, Alon JMB 2003
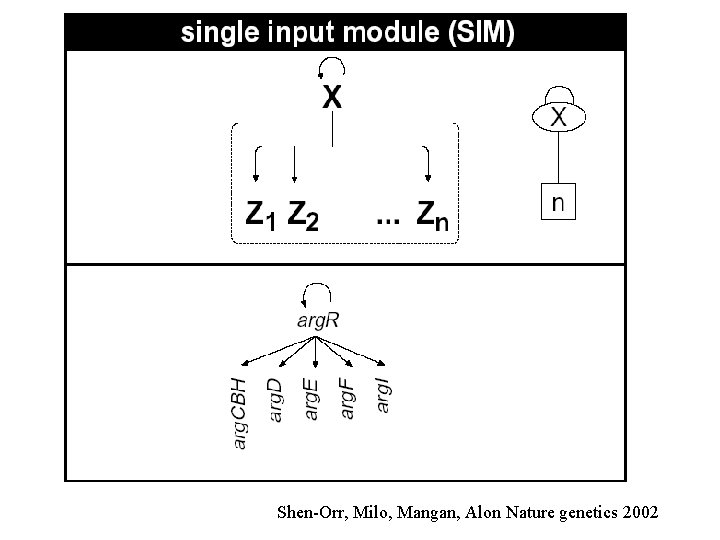
Shen-Orr, Milo, Mangan, Alon Nature genetics 2002
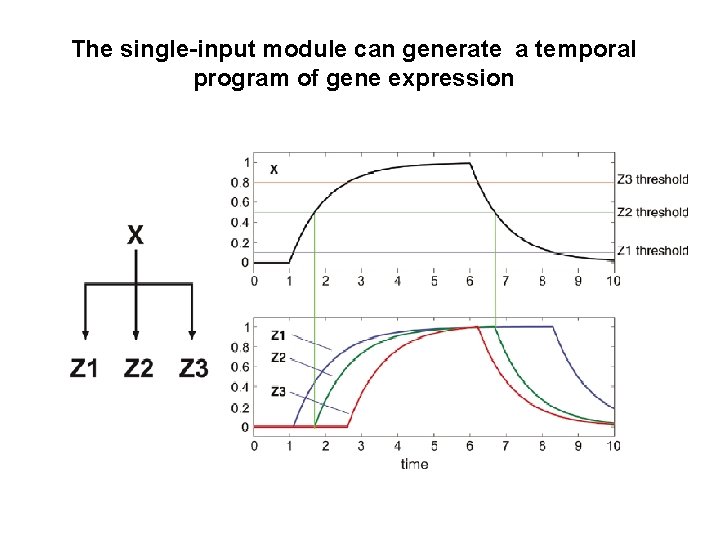
The single-input module can generate a temporal program of gene expression
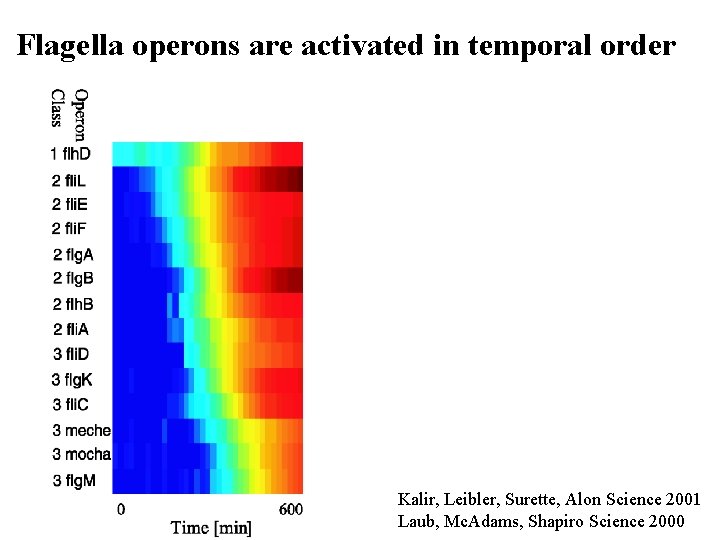
Flagella operons are activated in temporal order Kalir, Leibler, Surette, Alon Science 2001 Laub, Mc. Adams, Shapiro Science 2000
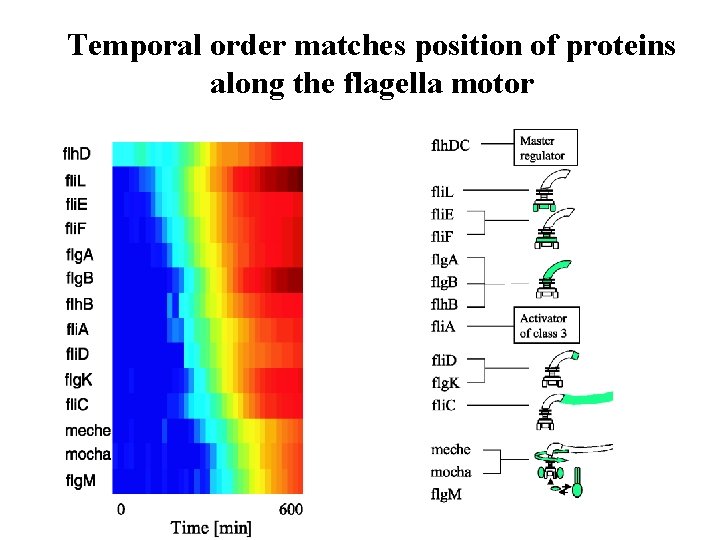
Temporal order matches position of proteins along the flagella motor
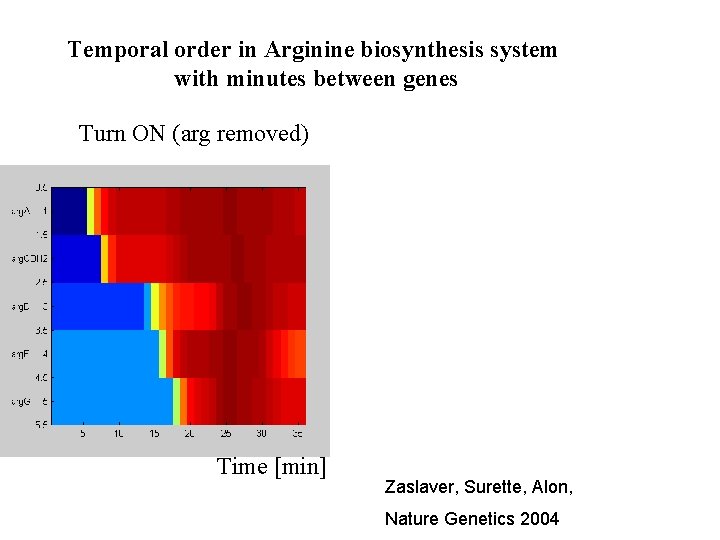
Temporal order in Arginine biosynthesis system with minutes between genes Turn ON (arg removed) Time [min] Turn OFF (arg added) Zaslaver, Surette, Alon, Nature Genetics 2004 Time
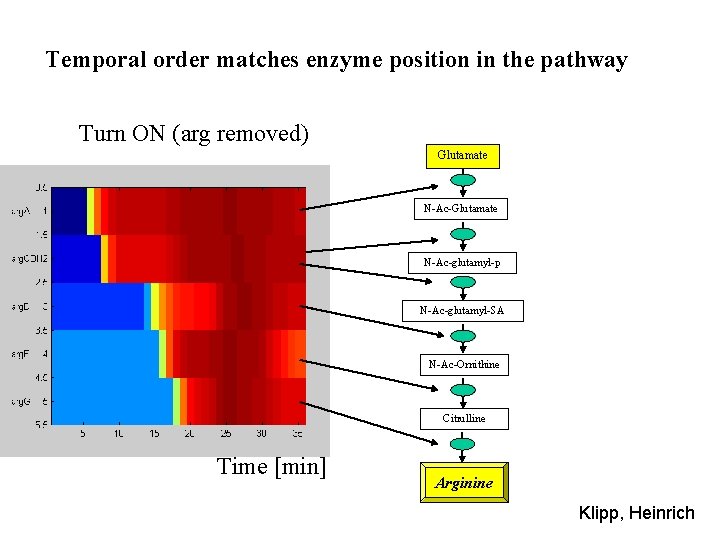
Temporal order matches enzyme position in the pathway Turn ON (arg removed) Turn OFF (arg added) Glutamate N-Ac-glutamyl-p N-Ac-glutamyl-SA N-Ac-Ornithine Citrulline Time [min] Arginine Time Klipp, Heinrich
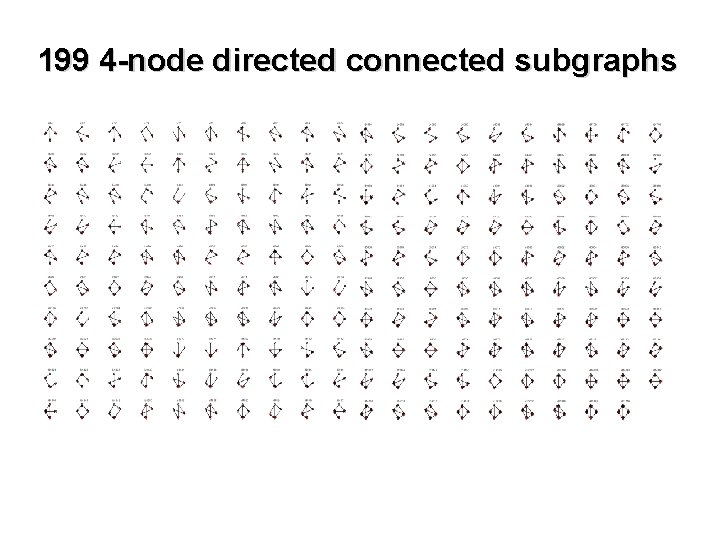
199 4 -node directed connected subgraphs
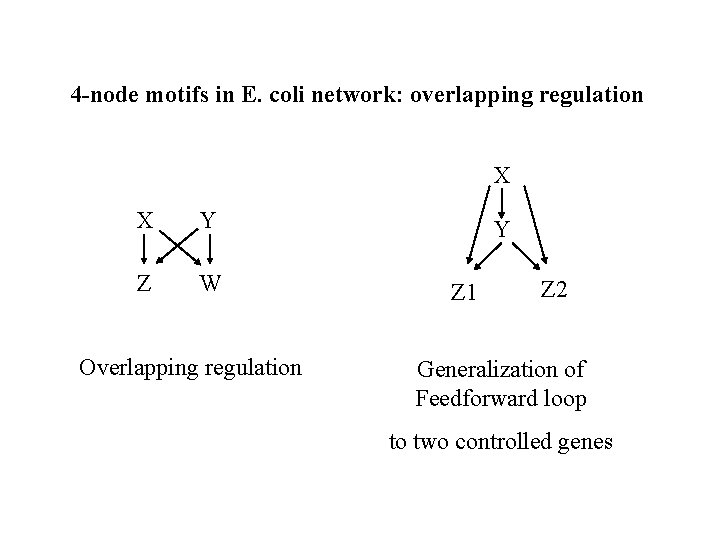
4 -node motifs in E. coli network: overlapping regulation X X Y Z W Overlapping regulation Y Z 1 Z 2 Generalization of Feedforward loop to two controlled genes
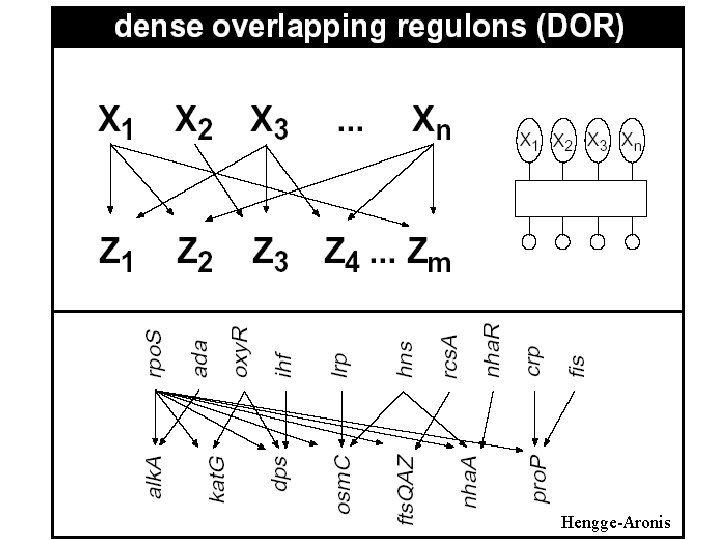
Hengge-Aronis
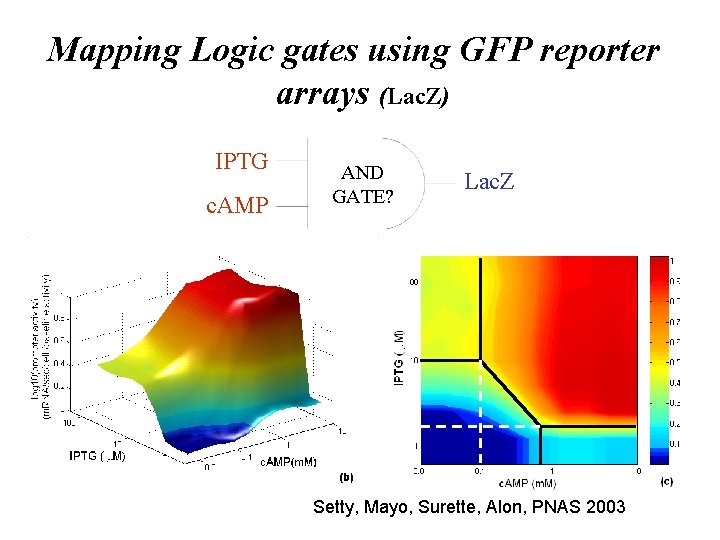
Mapping Logic gates using GFP reporter arrays (Lac. Z) IPTG c. AMP AND GATE? Lac. Z Setty, Mayo, Surette, Alon, PNAS 2003
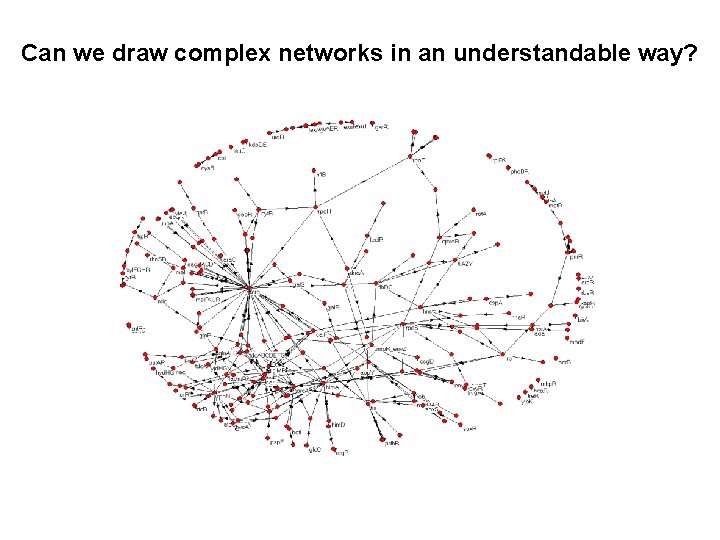
Can we draw complex networks in an understandable way?
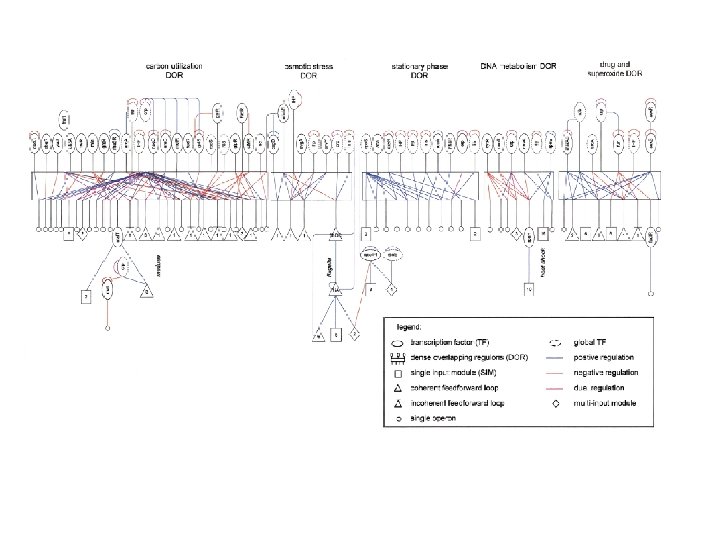
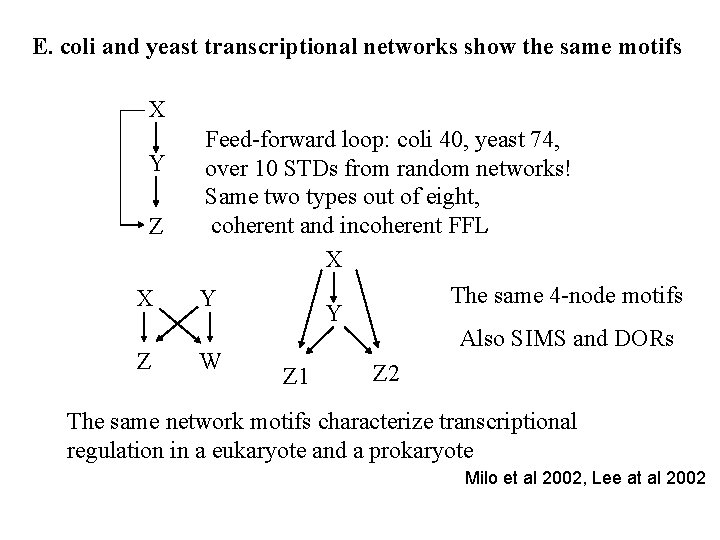
E. coli and yeast transcriptional networks show the same motifs X Y Z X Z Feed-forward loop: coli 40, yeast 74, over 10 STDs from random networks! Same two types out of eight, coherent and incoherent FFL X The same 4 -node motifs Y Y Also SIMS and DORs W Z 2 Z 1 The same network motifs characterize transcriptional regulation in a eukaryote and a prokaryote Milo et al 2002, Lee at al 2002
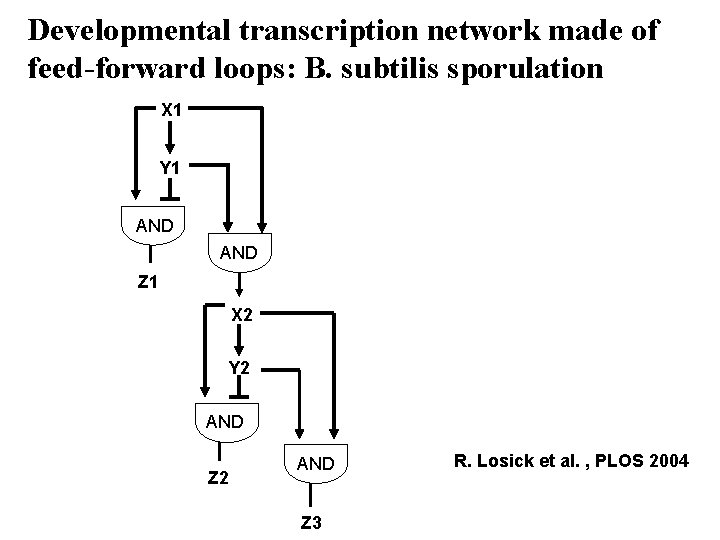
Developmental transcription network made of feed-forward loops: B. subtilis sporulation X 1 Y 1 AND Z 1 X 2 Y 2 AND Z 3 R. Losick et al. , PLOS 2004
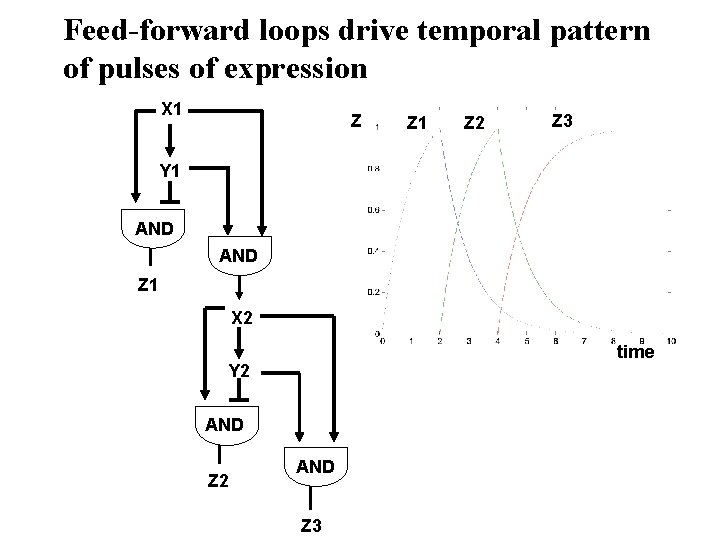
Feed-forward loops drive temporal pattern of pulses of expression X 1 Z Z 1 Z 2 Z 3 Y 1 AND Z 1 X 2 time Y 2 AND Z 3
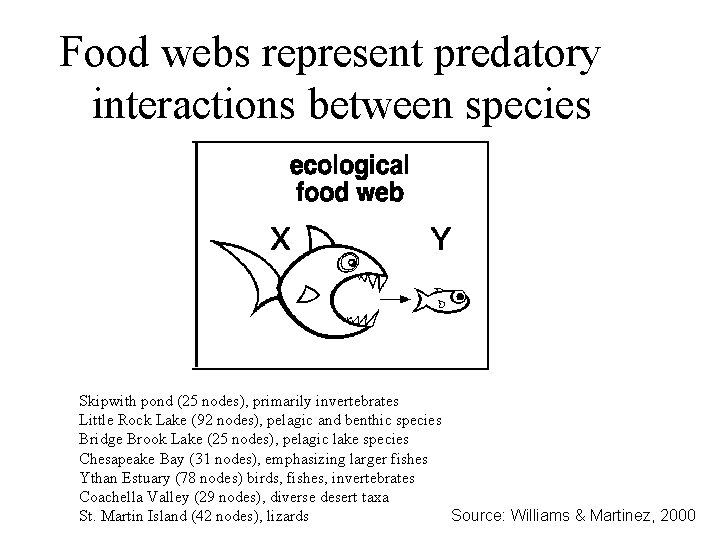
Food webs represent predatory interactions between species Skipwith pond (25 nodes), primarily invertebrates Little Rock Lake (92 nodes), pelagic and benthic species Bridge Brook Lake (25 nodes), pelagic lake species Chesapeake Bay (31 nodes), emphasizing larger fishes Ythan Estuary (78 nodes) birds, fishes, invertebrates Coachella Valley (29 nodes), diverse desert taxa Source: Williams & Martinez, 2000 St. Martin Island (42 nodes), lizards
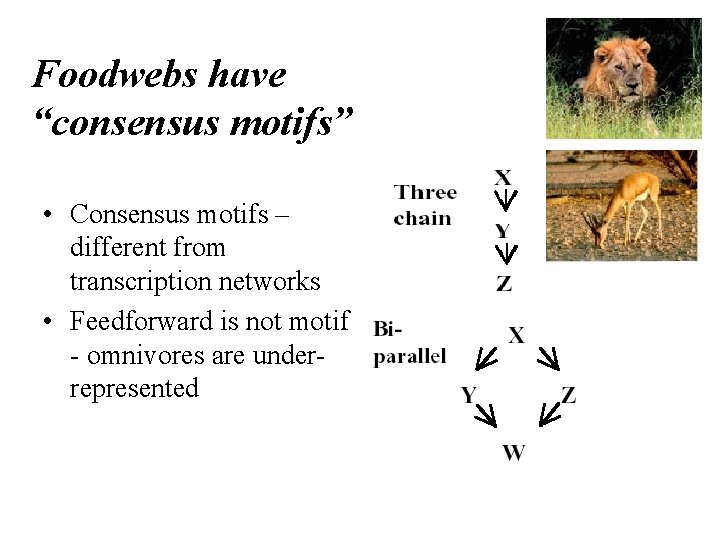
Foodwebs have “consensus motifs” • Consensus motifs – different from transcription networks • Feedforward is not motif - omnivores are underrepresented
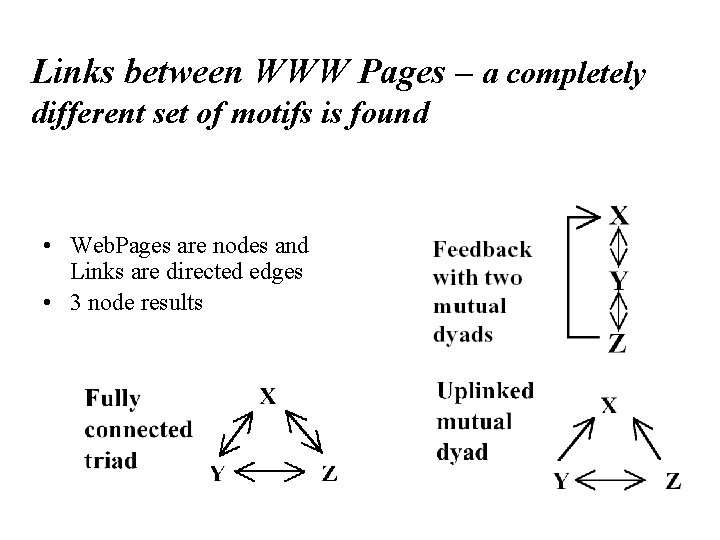
Links between WWW Pages – a completely different set of motifs is found • Web. Pages are nodes and Links are directed edges • 3 node results
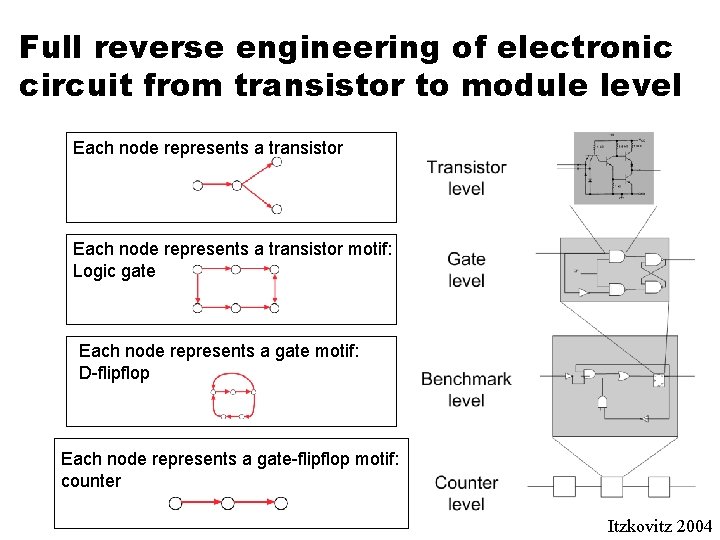
Full reverse engineering of electronic circuit from transistor to module level Each node represents a transistor motif: Logic gate Each node represents a gate motif: D-flipflop Each node represents a gate-flipflop motif: counter Itzkovitz 2004
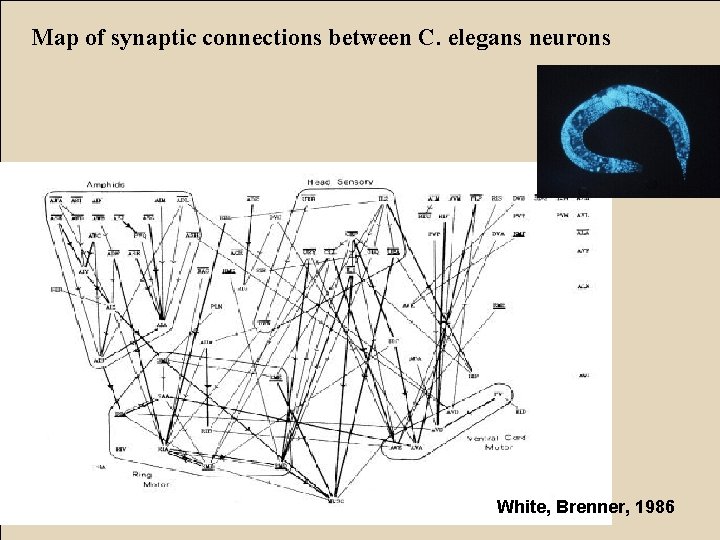
Map of synaptic connections between C. elegans neurons White, Brenner, 1986
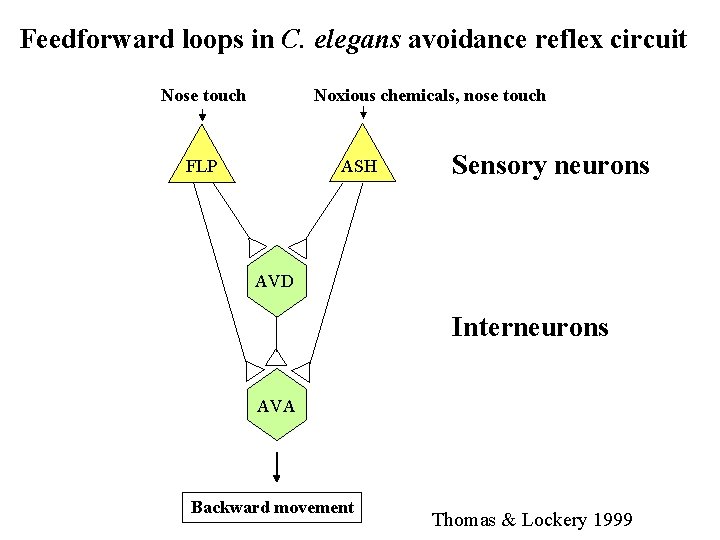
Feedforward loops in C. elegans avoidance reflex circuit Nose touch Noxious chemicals, nose touch FLP ASH Sensory neurons AVD Interneurons AVA Backward movement Thomas & Lockery 1999
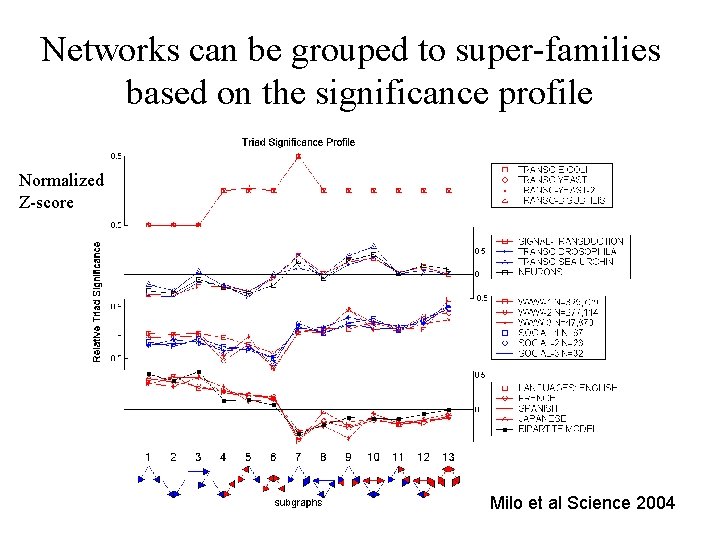
Networks can be grouped to super-families based on the significance profile Normalized Z-score Milo et al Science 2004
Summary –network motifs Network motifs, significant patterns in networks Three motifs in transcription networks and their functions High-accuracy promoter activity measurements from living cells Milo Science 2002, Shen-Orr Nat. Gen. 2002, Itzkovitz PRE 2003, algorithms at www. weizmann. ac. il/mcb/Uri. Alon
Acknowledgments Weizmann Institute, Israel Alex Sigal Naama Geva Galit Lahav Nitzan Rosenfeld Shiraz Kalir Ron Milo Adi Natan Shmoolik Mangam Shalev Itzkovitz Nadav Kashtan M. Elowitz, Caltech S. Leibler, Rockefeller M. G. Surette, Calgary H. Margalit, Jerusalem Alon Zaslaver Erez Dekel Avi Mayo Yaki Setty
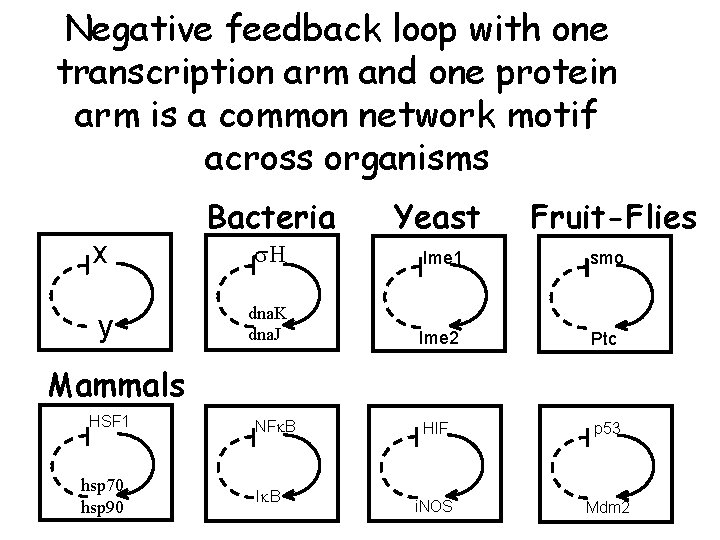
Negative feedback loop with one transcription arm and one protein arm is a common network motif across organisms x y Bacteria Yeast Fruit-Flies s. H Ime 1 smo dna. K dna. J Ime 2 Ptc HIF p 53 i. NOS Mdm 2 Mammals HSF 1 hsp 70 hsp 90 NFk. B Ik. B
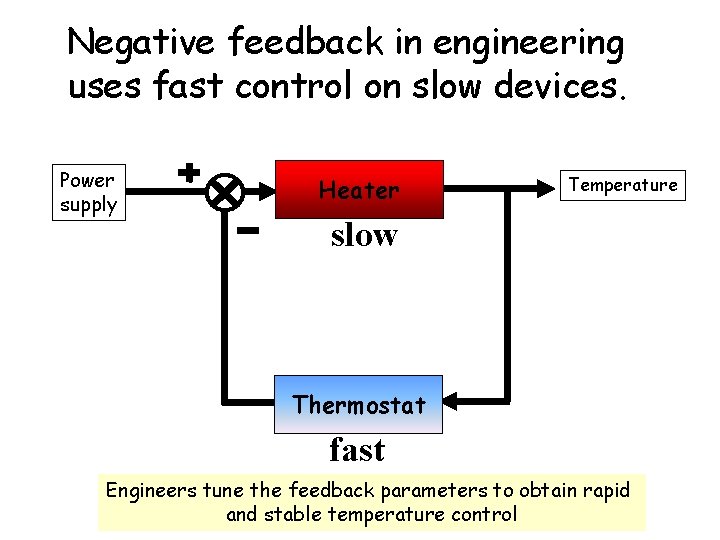
Negative feedback in engineering uses fast control on slow devices. Power supply Heater Temperature slow Thermostat fast Engineers tune the feedback parameters to obtain rapid and stable temperature control
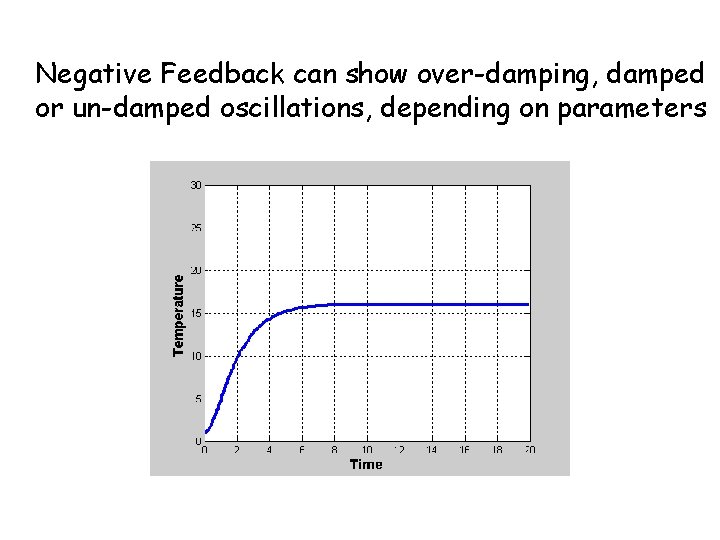
Negative Feedback can show over-damping, damped or un-damped oscillations, depending on parameters
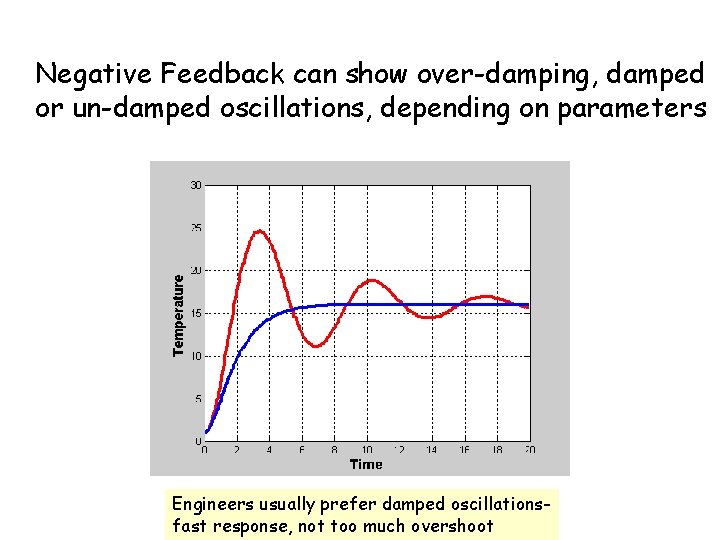
Negative Feedback can show over-damping, damped or un-damped oscillations, depending on parameters Engineers usually prefer damped oscillationsfast response, not too much overshoot
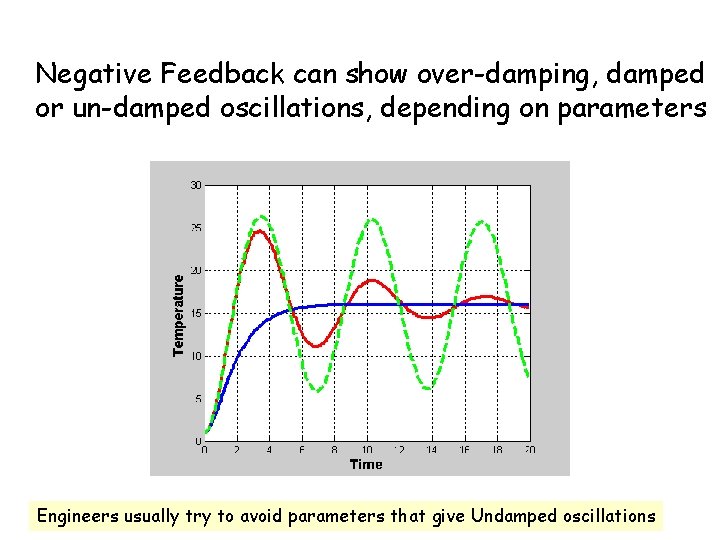
Negative Feedback can show over-damping, damped or un-damped oscillations, depending on parameters Engineers usually try to avoid parameters that give Undamped oscillations
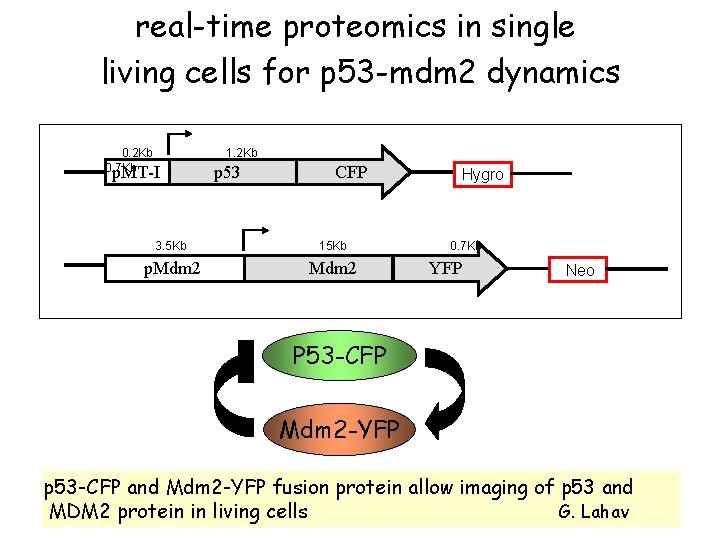
real-time proteomics in single living cells for p 53 -mdm 2 dynamics 0. 2 Kb 1. 2 Kb 0. 7 Kb p. MT-I p 53 CFP Hygro 3. 5 Kb 15 Kb 0. 7 Kb p. Mdm 2 YFP Neo P 53 -CFP Mdm 2 -YFP p 53 -CFP and Mdm 2 -YFP fusion protein allow imaging of p 53 and MDM 2 protein in living cells G. Lahav
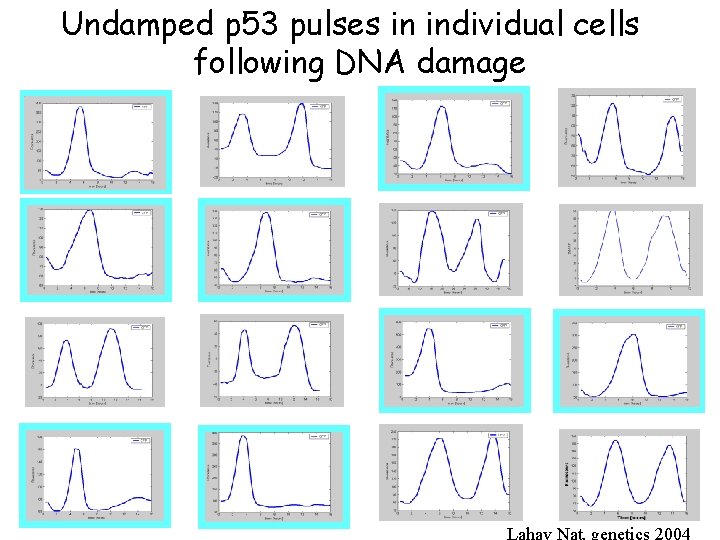
Undamped p 53 pulses in individual cells following DNA damage Lahav Nat. genetics 2004
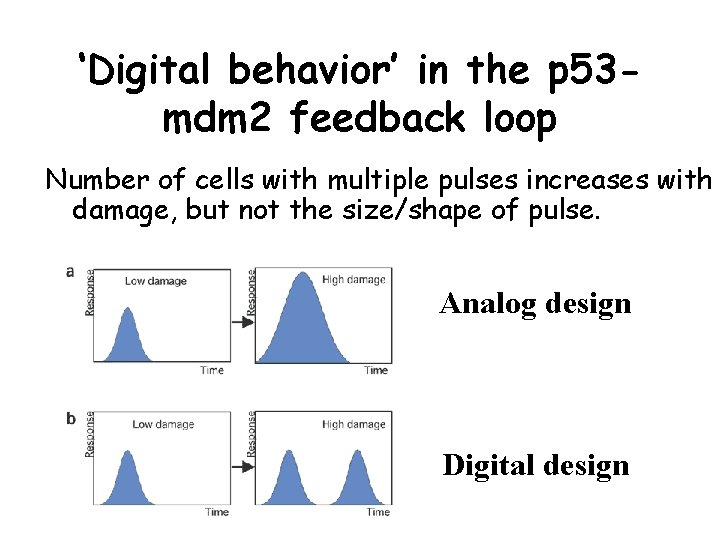
‘Digital behavior’ in the p 53 mdm 2 feedback loop Number of cells with multiple pulses increases with damage, but not the size/shape of pulse. Analog design Digital design
Dynamics of the p 53 -mdm 2 loop in single living cells, and the design principles of biological feedback Galit Lahav Uri Alon Weizmann Institute Israel
overview • Introduction- negative feedback loop motif • System for real time proteomics of p 53 -mdm 2 in living human cells • Dynamics of p 53 -mdm 2 at the single cell level • Design principles of biological feedback
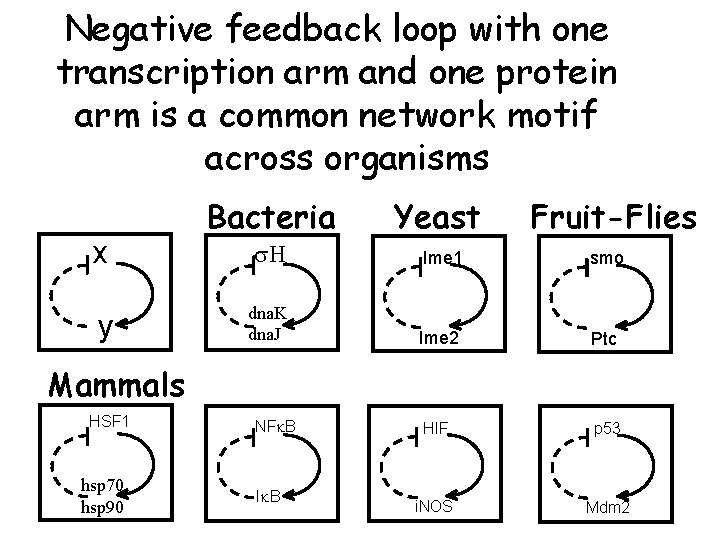
Negative feedback loop with one transcription arm and one protein arm is a common network motif across organisms x y Bacteria Yeast Fruit-Flies s. H Ime 1 smo dna. K dna. J Ime 2 Ptc HIF p 53 i. NOS Mdm 2 Mammals HSF 1 hsp 70 hsp 90 NFk. B Ik. B
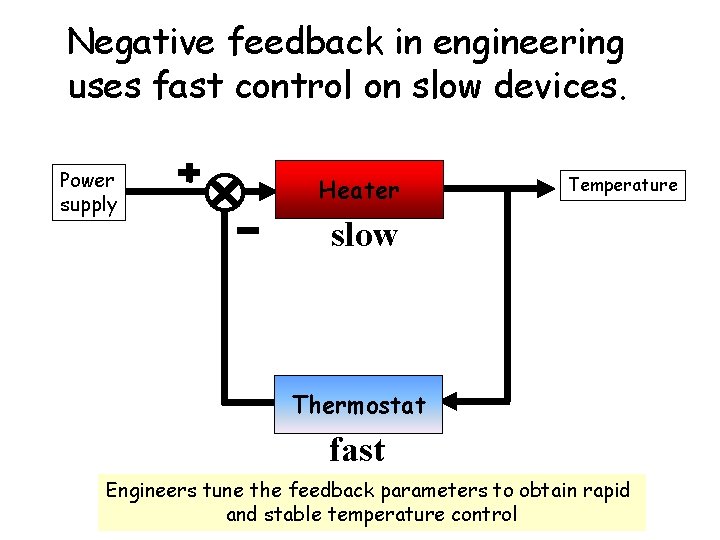
Negative feedback in engineering uses fast control on slow devices. Power supply Heater Temperature slow Thermostat fast Engineers tune the feedback parameters to obtain rapid and stable temperature control
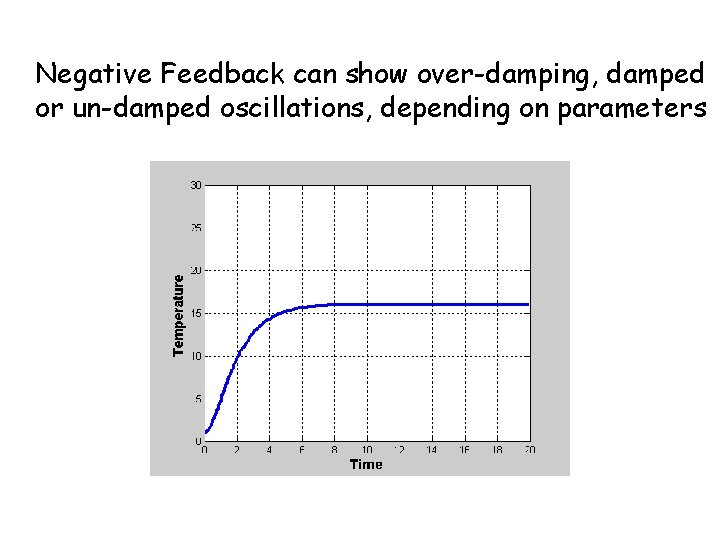
Negative Feedback can show over-damping, damped or un-damped oscillations, depending on parameters
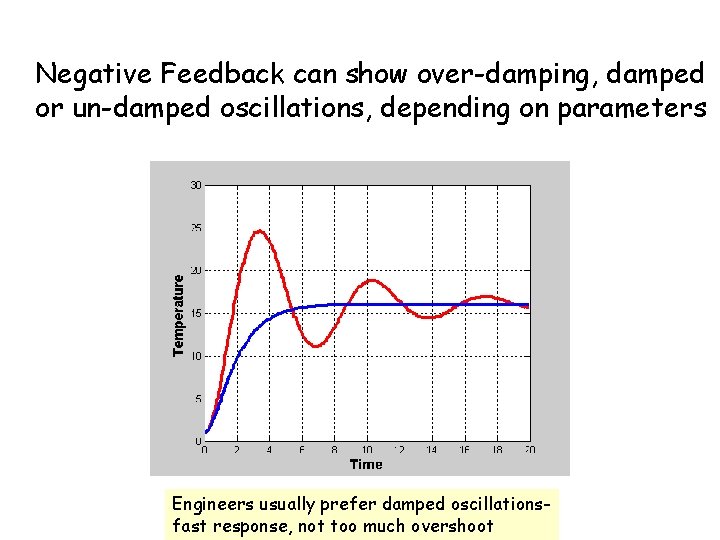
Negative Feedback can show over-damping, damped or un-damped oscillations, depending on parameters Engineers usually prefer damped oscillationsfast response, not too much overshoot
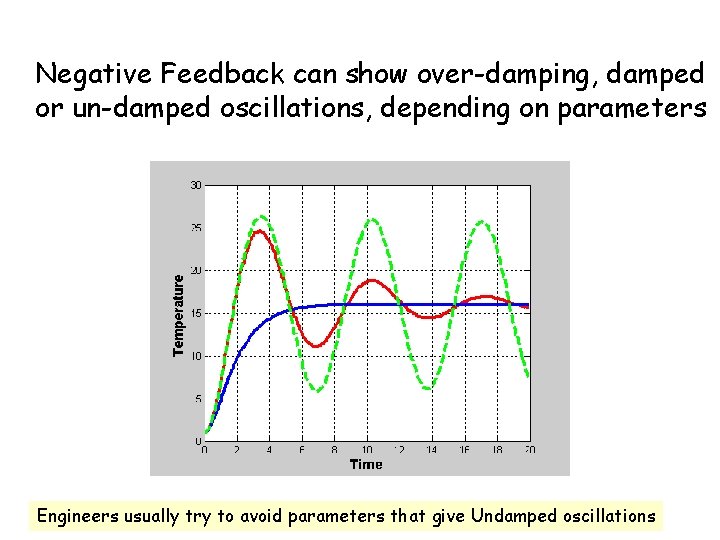
Negative Feedback can show over-damping, damped or un-damped oscillations, depending on parameters Engineers usually try to avoid parameters that give Undamped oscillations
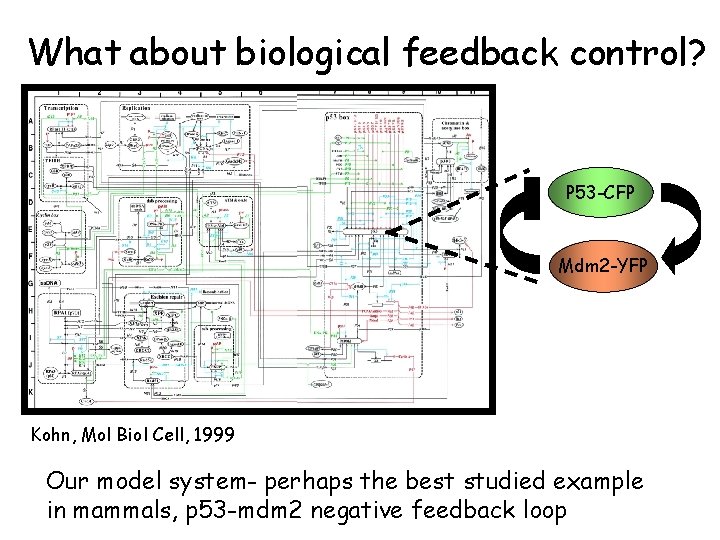
What about biological feedback control? P 53 -CFP Mdm 2 -YFP Kohn, Mol Biol Cell, 1999 Our model system- perhaps the best studied example in mammals, p 53 -mdm 2 negative feedback loop
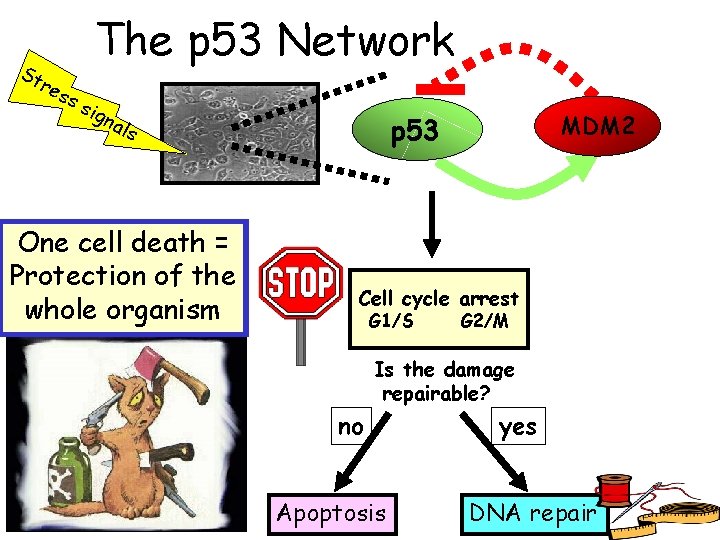
St The p 53 Network res ss ign als One cell death = Protection of the whole organism MDM 2 p 53 Cell cycle arrest G 1/S G 2/M Is the damage repairable? no Apoptosis yes DNA repair
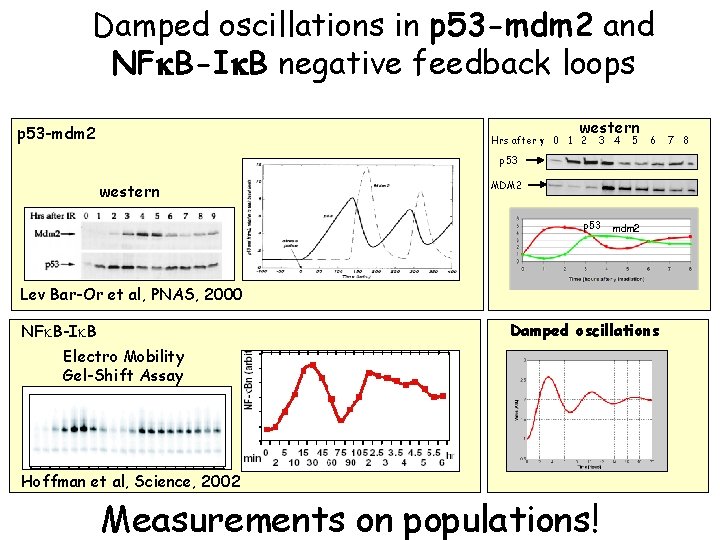
Damped oscillations in p 53 -mdm 2 and NFk. B-Ik. B negative feedback loops western p 53 -mdm 2 Hrs after g 0 1 2 3 4 5 6 p 53 western MDM 2 p 53 mdm 2 Lev Bar-Or et al, PNAS, 2000 Damped oscillations NFk. B-Ik. B Electro Mobility Gel-Shift Assay Hoffman et al, Science, 2002 Measurements on populations! 7 8
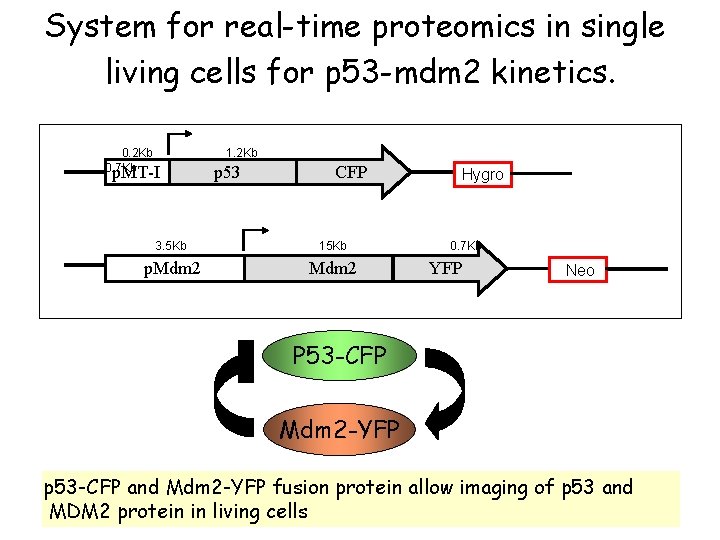
System for real-time proteomics in single living cells for p 53 -mdm 2 kinetics. 0. 2 Kb 1. 2 Kb 0. 7 Kb p. MT-I p 53 CFP Hygro 3. 5 Kb 15 Kb 0. 7 Kb p. Mdm 2 YFP Neo P 53 -CFP Mdm 2 -YFP p 53 -CFP and Mdm 2 -YFP fusion protein allow imaging of p 53 and MDM 2 protein in living cells
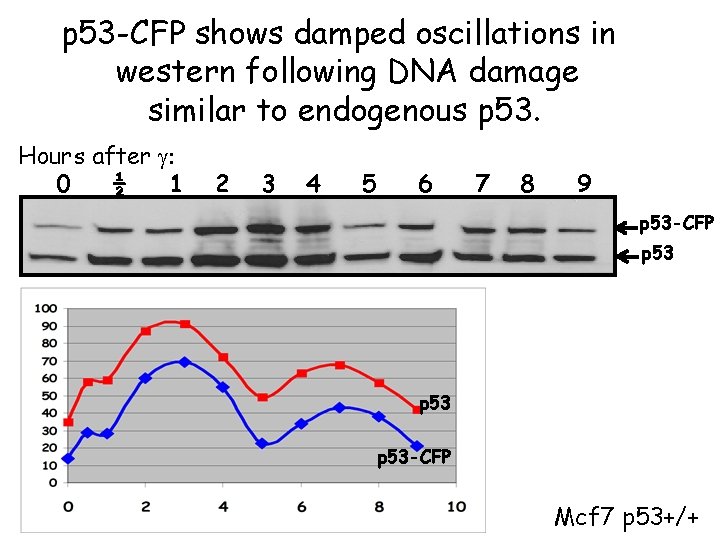
p 53 -CFP shows damped oscillations in western following DNA damage similar to endogenous p 53. Hours after g: 0 ½ 1 2 3 4 5 6 7 8 9 p 53 -CFP p 53 -CFP Mcf 7 p 53+/+
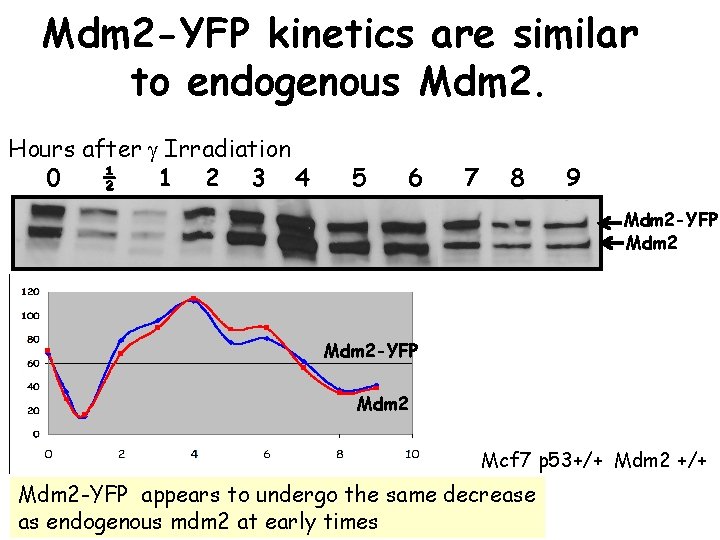
Mdm 2 -YFP kinetics are similar to endogenous Mdm 2. Hours after g Irradiation 0 ½ 1 2 3 4 5 6 7 8 9 Mdm 2 -YFP Mdm 2 Mcf 7 p 53+/+ Mdm 2 -YFP appears to undergo the same decrease as endogenous mdm 2 at early times
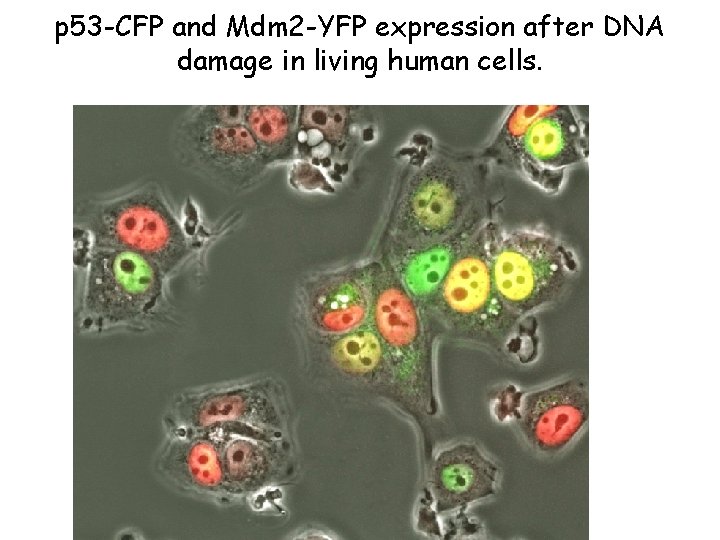
p 53 -CFP and Mdm 2 -YFP expression after DNA damage in living human cells.
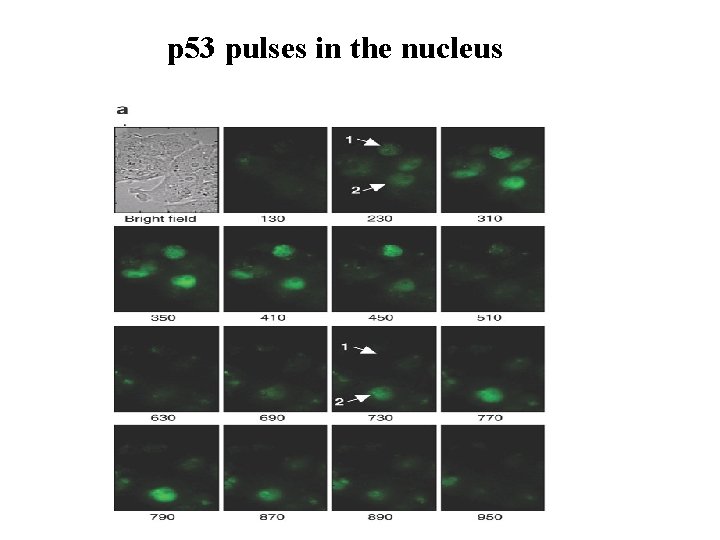
p 53 pulses in the nucleus
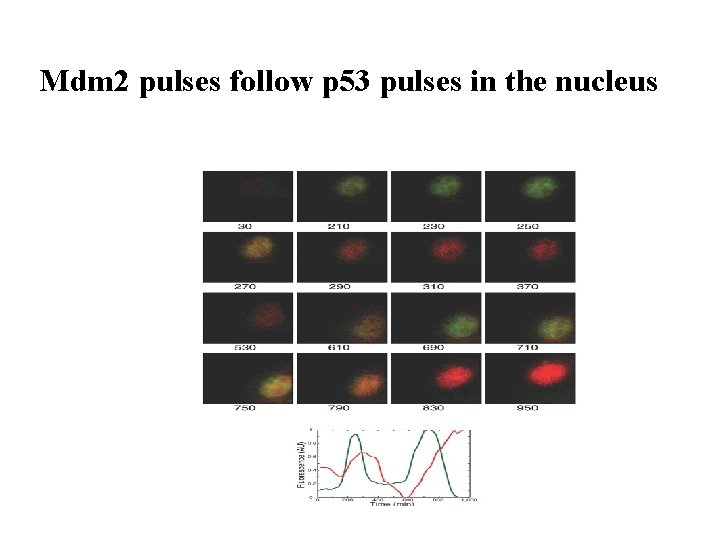
Mdm 2 pulses follow p 53 pulses in the nucleus
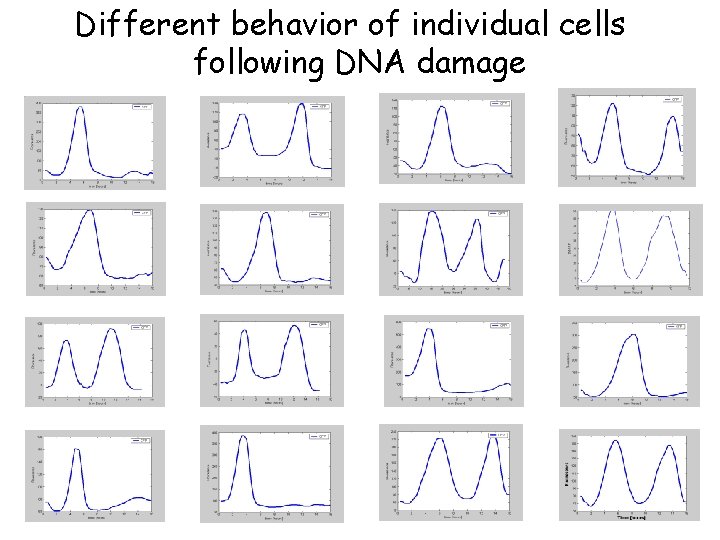
Different behavior of individual cells following DNA damage
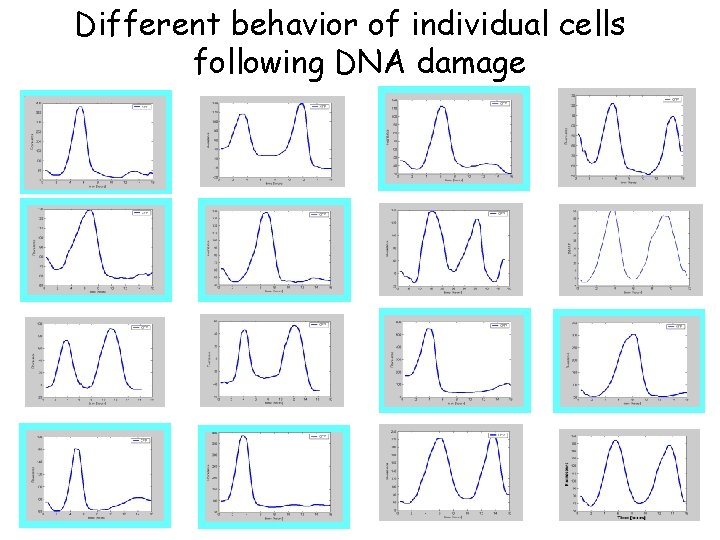
Different behavior of individual cells following DNA damage
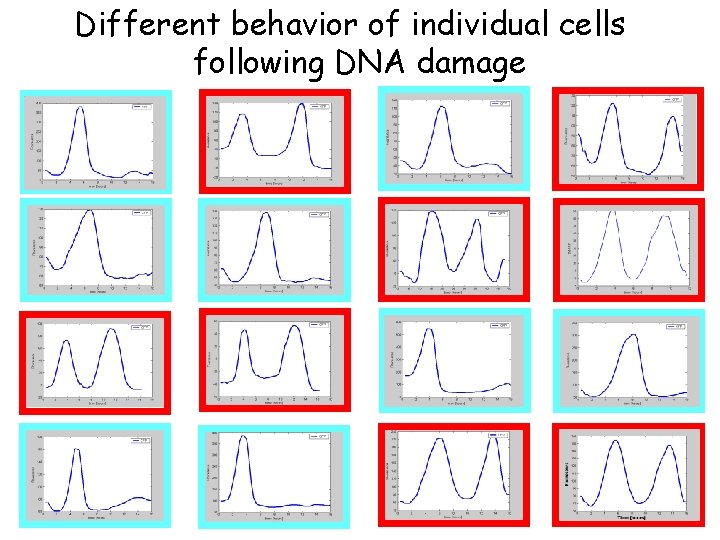
Different behavior of individual cells following DNA damage
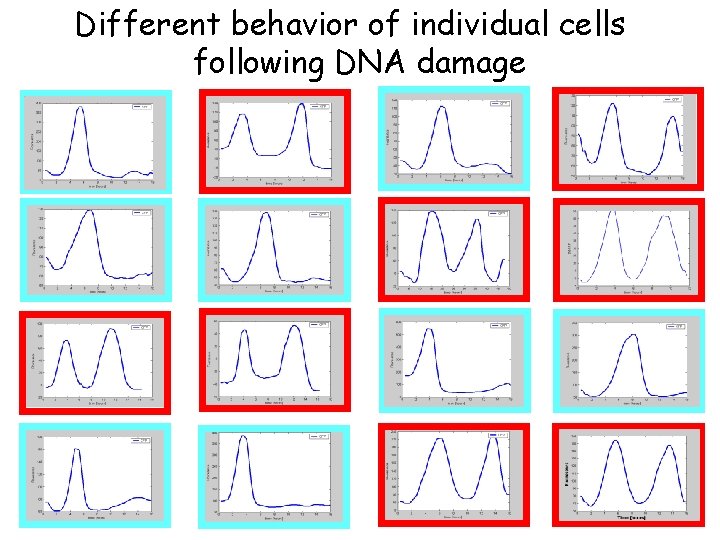
Different behavior of individual cells following DNA damage
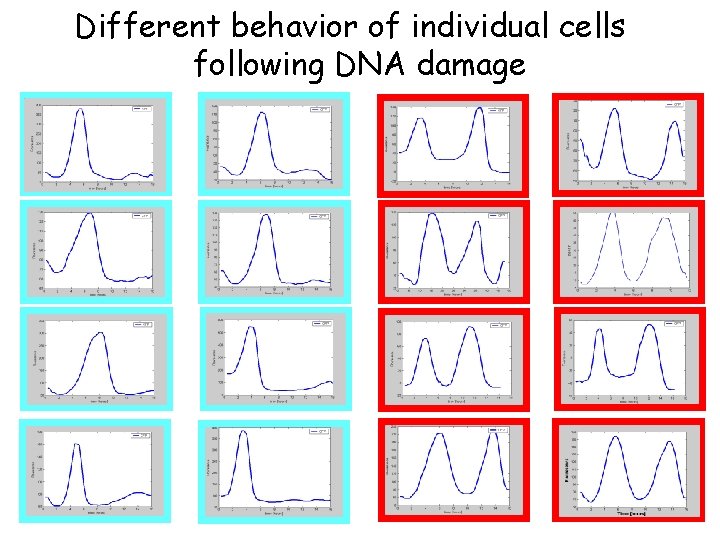
Different behavior of individual cells following DNA damage
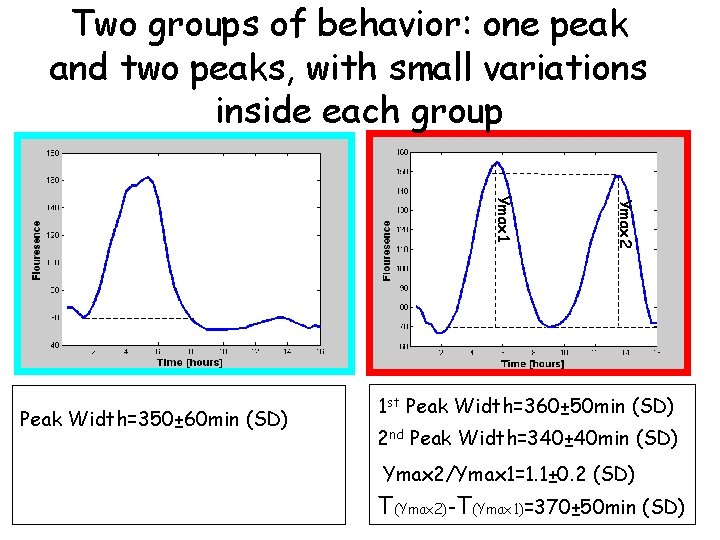
Two groups of behavior: one peak and two peaks, with small variations inside each group Ymax 2 Ymax 1 Peak Width=350± 60 min (SD) 1 st Peak Width=360± 50 min (SD) 2 nd Peak Width=340± 40 min (SD) Ymax 2/Ymax 1=1. 1± 0. 2 (SD) T(Ymax 2)-T(Ymax 1)=370± 50 min (SD)
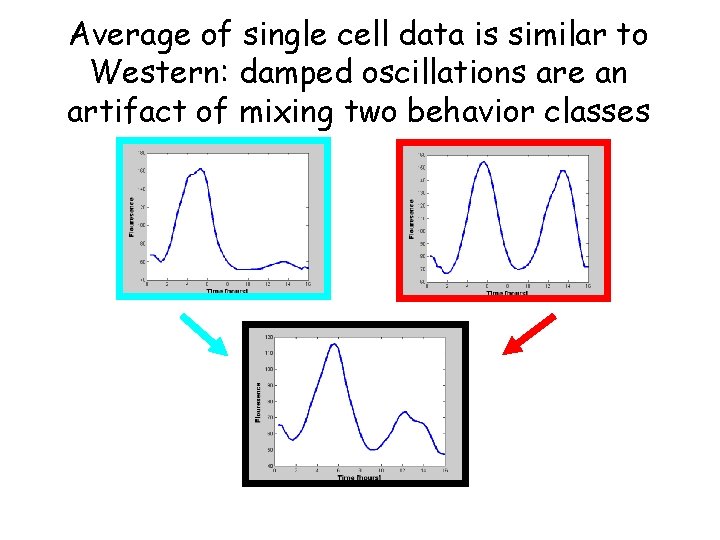
Average of single cell data is similar to Western: damped oscillations are an artifact of mixing two behavior classes
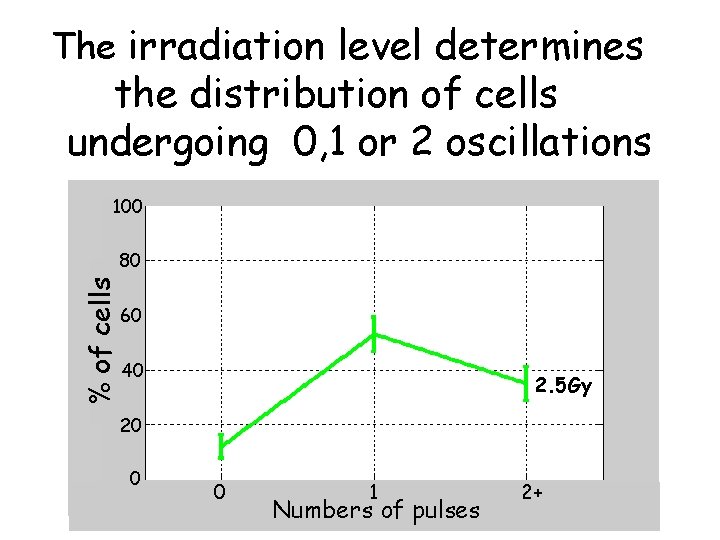
The irradiation level determines the distribution of cells undergoing 0, 1 or 2 oscillations 100 % of cells 80 60 40 2. 5 Gy 20 0 0 1 Numbers of pulses 2+
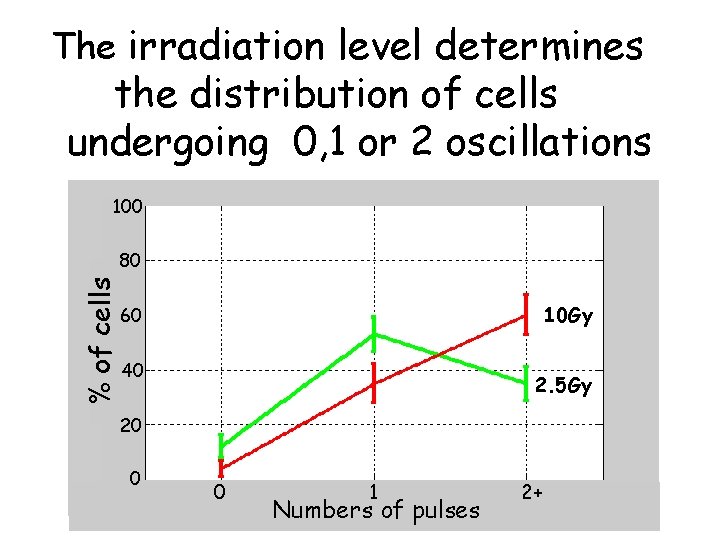
The irradiation level determines the distribution of cells undergoing 0, 1 or 2 oscillations 100 % of cells 80 10 Gy 60 40 2. 5 Gy 20 0 0 1 Numbers of pulses 2+
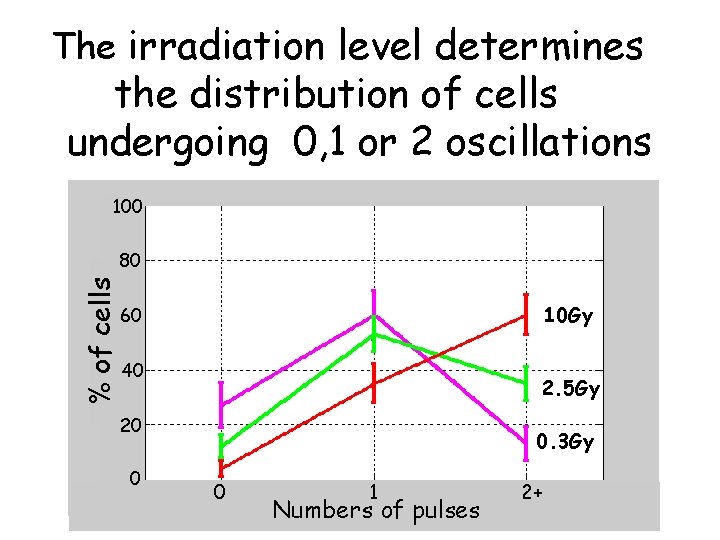
The irradiation level determines the distribution of cells undergoing 0, 1 or 2 oscillations 100 % of cells 80 10 Gy 60 40 2. 5 Gy 20 0 0. 3 Gy 0 1 Numbers of pulses 2+
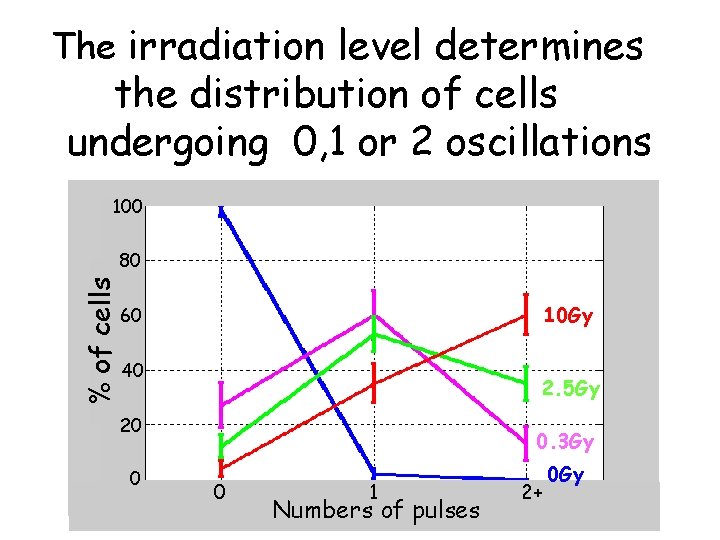
The irradiation level determines the distribution of cells undergoing 0, 1 or 2 oscillations 100 % of cells 80 10 Gy 60 40 2. 5 Gy 20 0 0. 3 Gy 0 1 Numbers of pulses 2+ 0 Gy
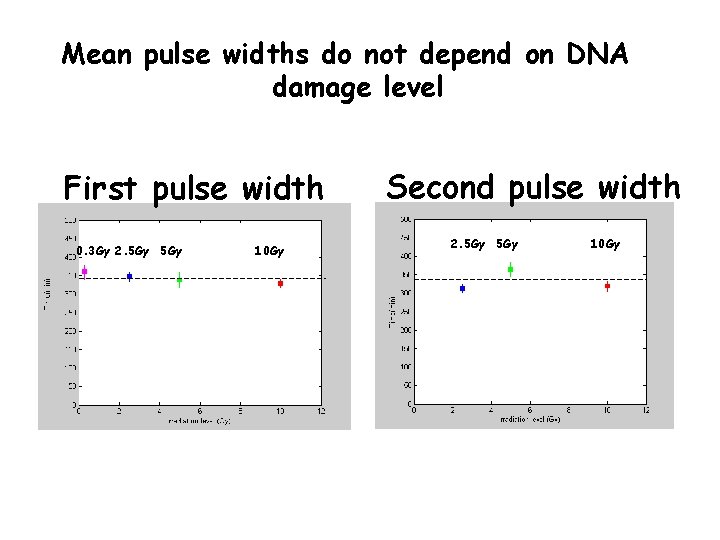
Mean pulse widths do not depend on DNA damage level First pulse width 0. 3 Gy 2. 5 Gy 10 Gy Second pulse width 2. 5 Gy 10 Gy
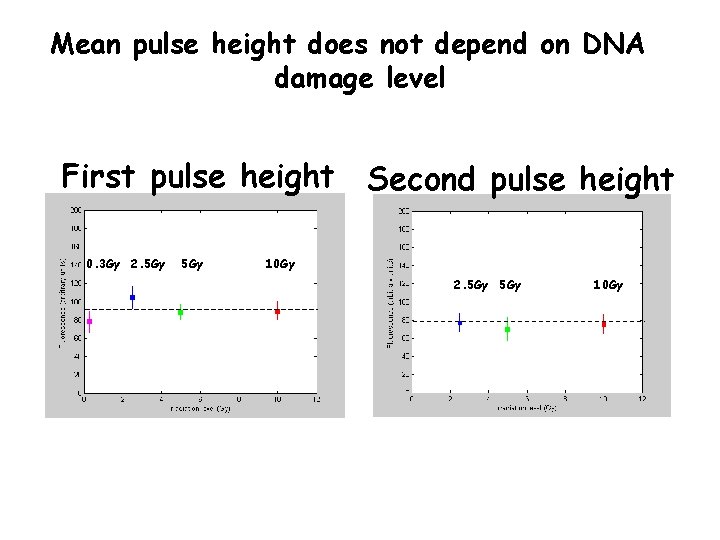
Mean pulse height does not depend on DNA damage level First pulse height Second pulse height 0. 3 Gy 2. 5 Gy 5 Gy 10 Gy
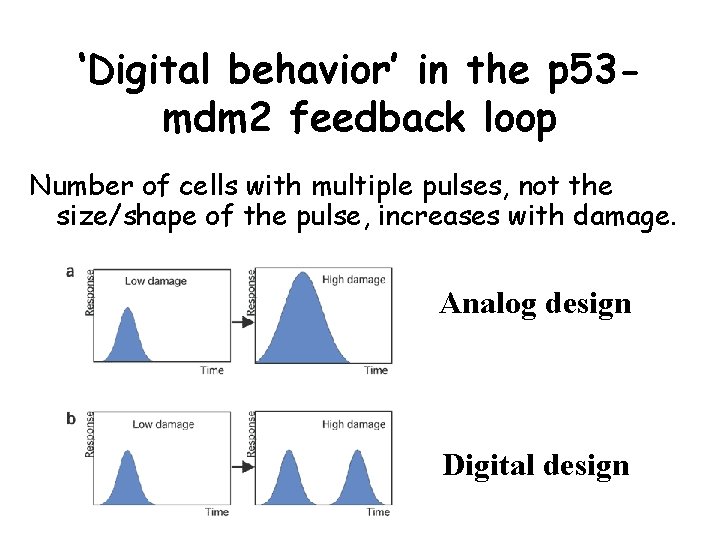
‘Digital behavior’ in the p 53 mdm 2 feedback loop Number of cells with multiple pulses, not the size/shape of the pulse, increases with damage. Analog design Digital design
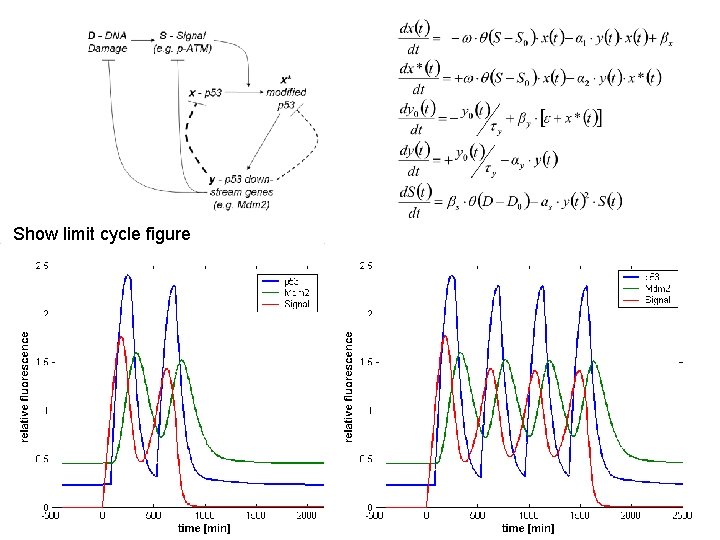
Show limit cycle figure
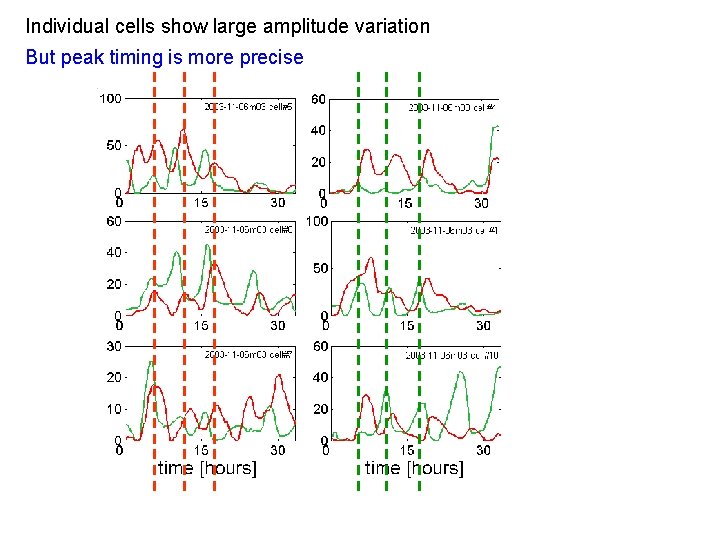
Individual cells show large amplitude variation But peak timing is more precise
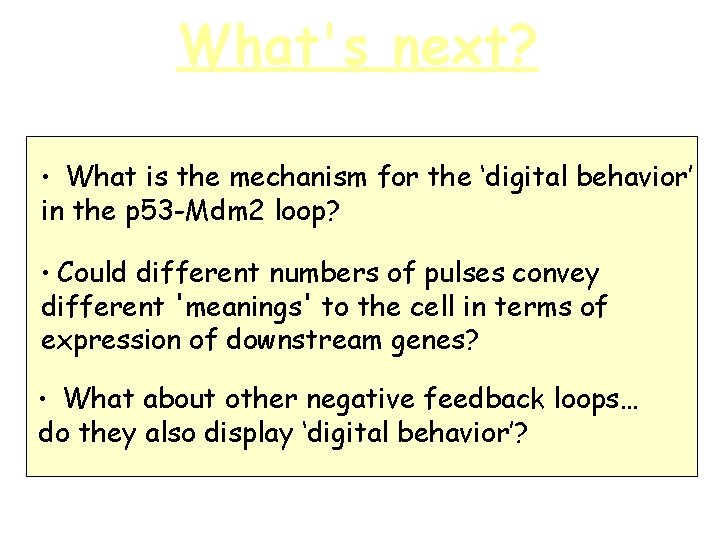
What's next? • What is the mechanism for the ‘digital behavior’ in the p 53 -Mdm 2 loop? • Could different numbers of pulses convey different 'meanings' to the cell in terms of expression of downstream genes? • What about other negative feedback loops… do they also display ‘digital behavior’?
The goal: dynamic proteomics in individual living human cells • Protein concentration and location at high temporal-resolution and accuracy • In individual living human cells • For most of the expressed proteins
Annotated library of cells each of which Expressed a chromosomally YFP-tagged protein +automated microscopy and image-analysis
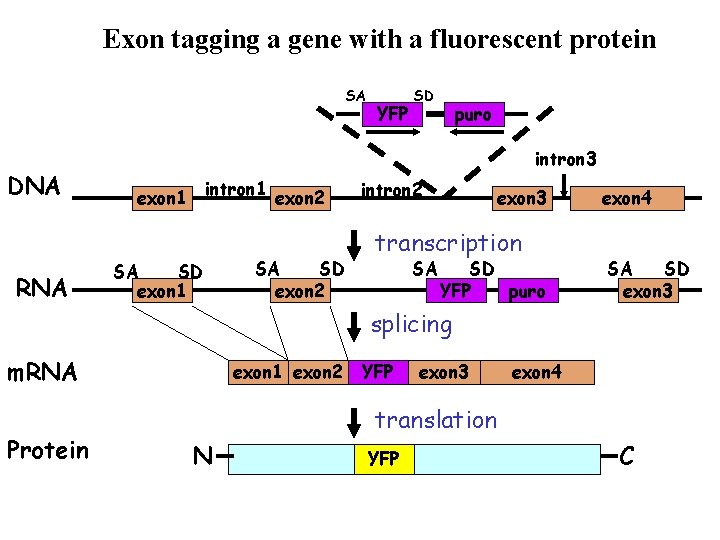
Exon tagging a gene with a fluorescent protein SA DNA RNA YFP SD puro intron 3 intron 1 exon 1 SA SD exon 1 exon 2 SA SD exon 2 intron 2 exon 3 transcription SA SD YFP puro exon 4 SA SD exon 3 splicing m. RNA Protein exon 1 exon 2 YFP exon 3 exon 4 translation N YFP C
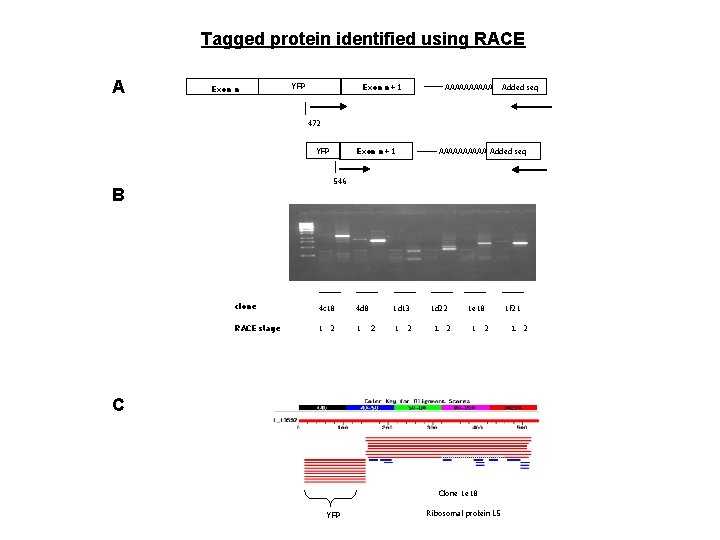
Tagged protein identified using RACE A Exon n YFP Exon n+1 AAAAA Added seq 472 YFP Exon n+1 AAAAA Added seq 546 B clone 4 c 18 4 d 8 RACE stage 1 1 2 1 d 13 2 1 d 22 1 2 1 e 18 1 2 C Clone 1 e 18 YFP Ribosomal protein L 5 Clone 1 e 18 1 f 21 1 2
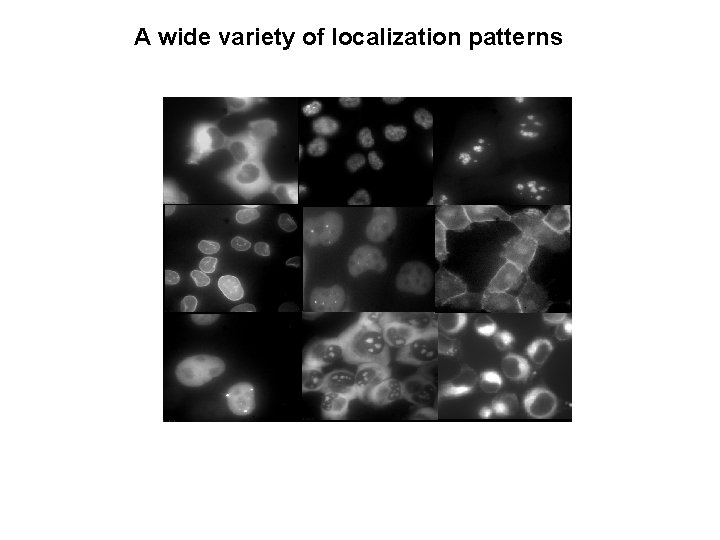
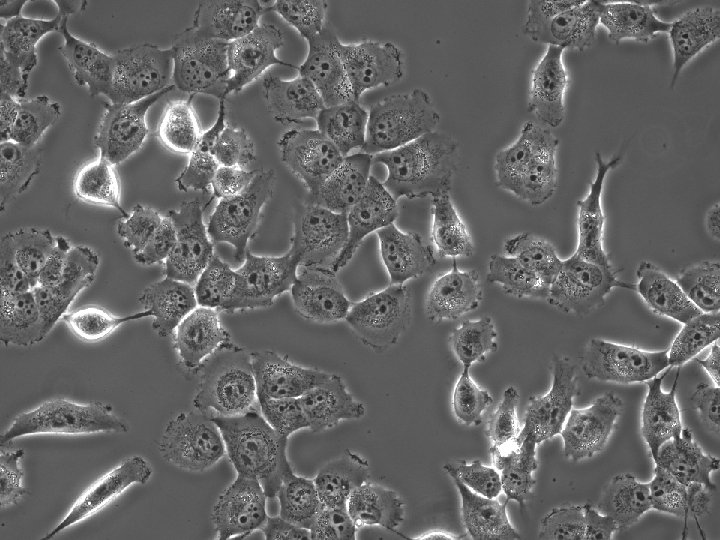
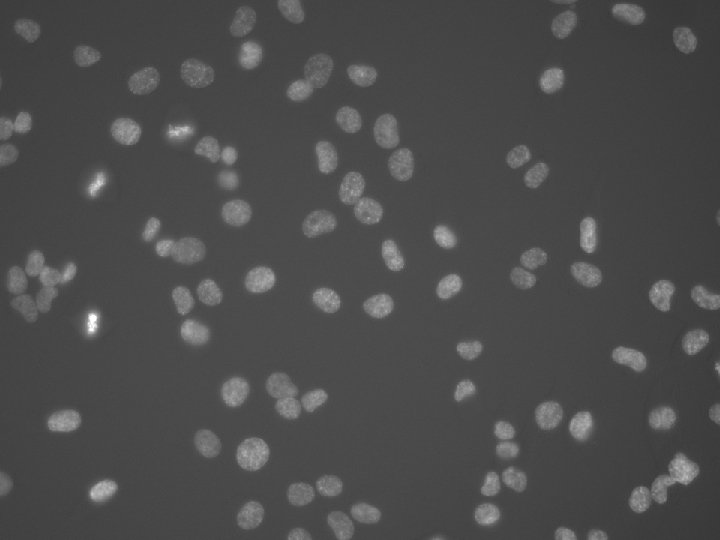
A wide variety of localization patterns
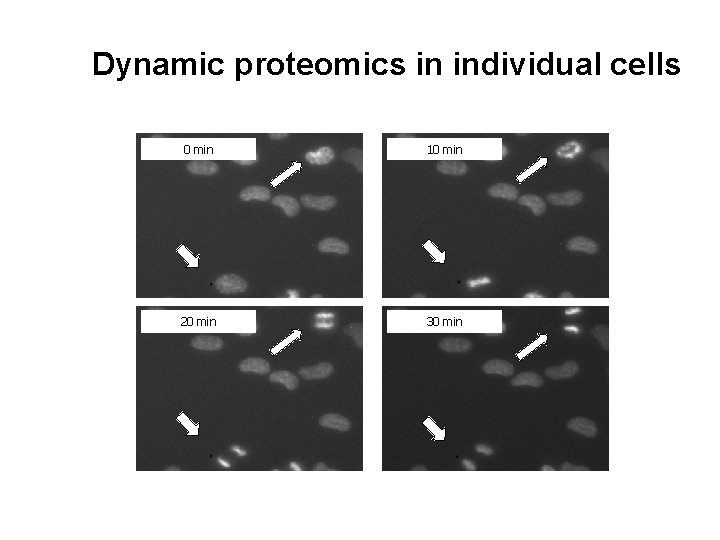
Dynamic proteomics in individual cells 0 min 10 min 20 min 30 min
Summary • Network motifs and their biological function • Digital pulses of p 53 • Dynamic proteomics in individual living cells
Acknowledgments Weizmann Institute, Israel Galit Lahav Alex Sigal Naama Geva Lior Ben-Arzi Nitzan Rosenfeld Shiraz Kalir Inbal Alaluf Ron Milo Adi Natan Shmoolik Mangam Shalev Itzkovitz Nadav Kashtan Ido Zelman Alon Zaslaver Shai Shen-Orr Erez Dekel Avi Mayo Yaki Setty Zvi Kam Benjamin Geiger Moshe Oren Varda Rotter Stan Leibler, Rockefeller -coli Mike Surette, Calgary -coli Arnold Levine, IAS Princeton –p 53 Michael Elowitz, Caltech –p 53
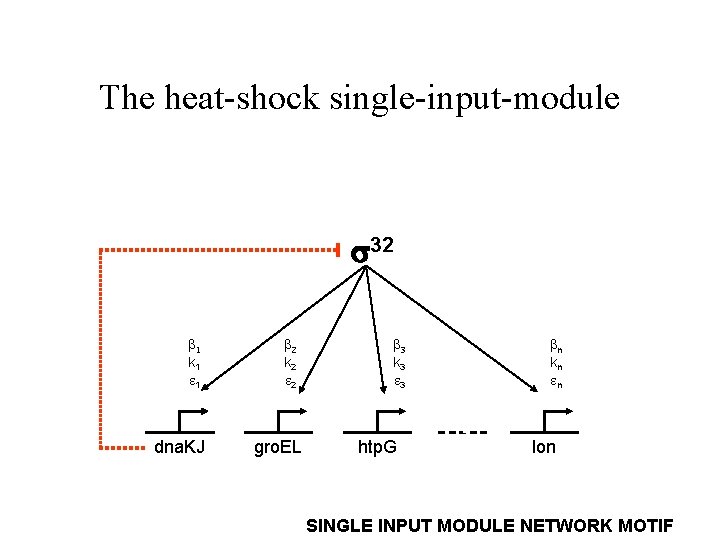
The heat-shock single-input-module 32 b 1 k 1 1 dna. KJ b 2 k 2 2 gro. EL b 3 k 3 3 htp. G bn kn n d lon SINGLE INPUT MODULE NETWORK MOTIF
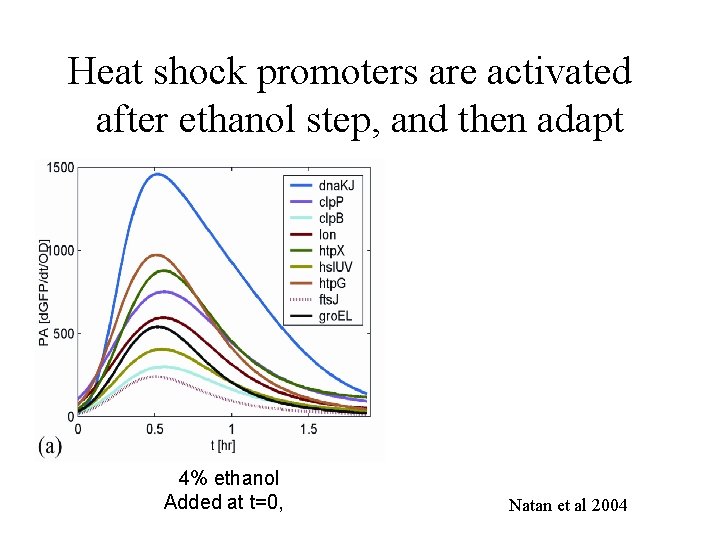
Heat shock promoters are activated after ethanol step, and then adapt 4% ethanol Added at t=0, Natan et al 2004
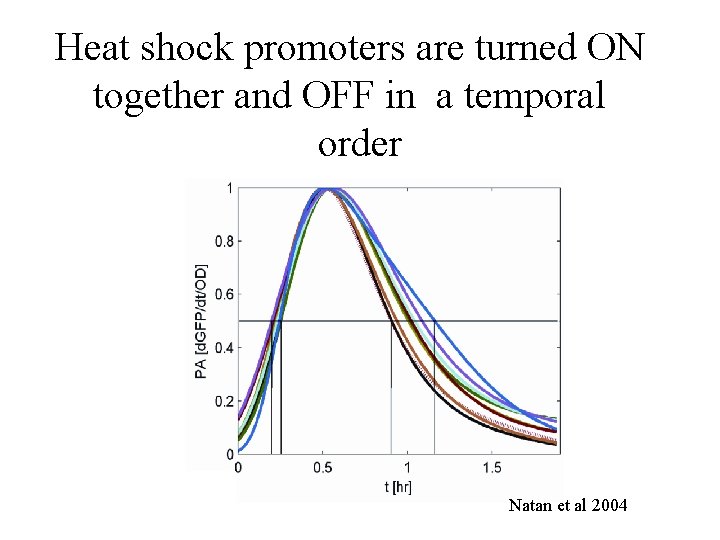
Heat shock promoters are turned ON together and OFF in a temporal order Natan et al 2004
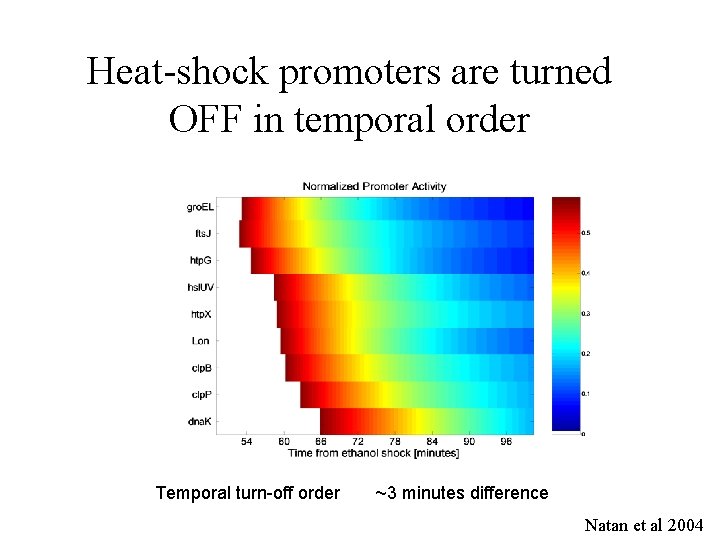
Heat-shock promoters are turned OFF in temporal order Temporal turn-off order ~3 minutes difference Natan et al 2004
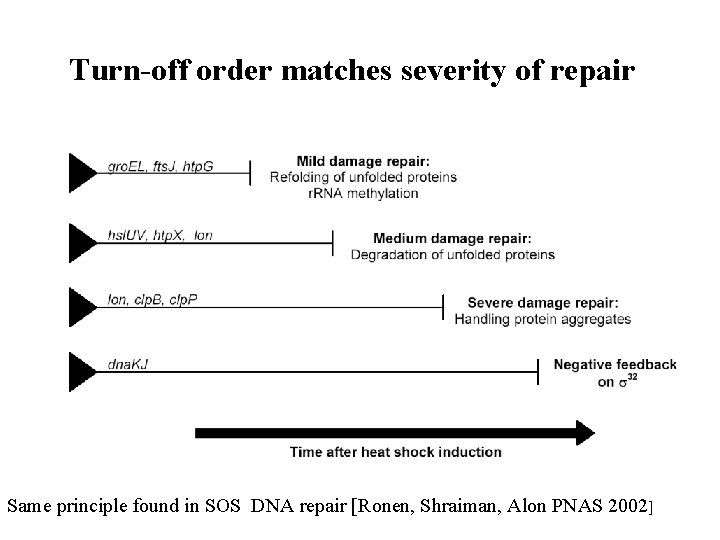
Turn-off order matches severity of repair Same principle found in SOS DNA repair [Ronen, Shraiman, Alon PNAS 2002]
- Slides: 97