
Complete University Guide League Table Rankings 2018 Introduction
Complete University Guide League Table Rankings 2018
Introduction This document details Aston’s overall performance in the 2018 Complete University Guide comparing Aston with the sector and providing a breakdown by each of the 10 metrics. It also analyses each subject line performance compared to the sector. Within the document the scores and ranks have been colour coordinated to more easily identify areas of strengths and weaknesses. Colour Coded Rankings: Green = Upper Quartile, Black = Top Half, Amber = Lower Half, Red = Lower Quartile Moving forward, Red metrics should aim to become Amber, Amber metrics should aim to become Black, Black metrics should aim to become Green and those already Green should look for stretch targets such as to become Top 10/Top 5 as appropriate. Aston’s student-staff ratio has experienced a decline this year as the result of two main factors: Firstly, Aston recently re-coded their staff return in line with the 2014 REF which has reduced the number of staff eligible for inclusion. Secondly, Aston has increased undergraduate student numbers this year which unfortunately has a negative impact on the student-staff ratio. However, this is necessary for the growth of the University.
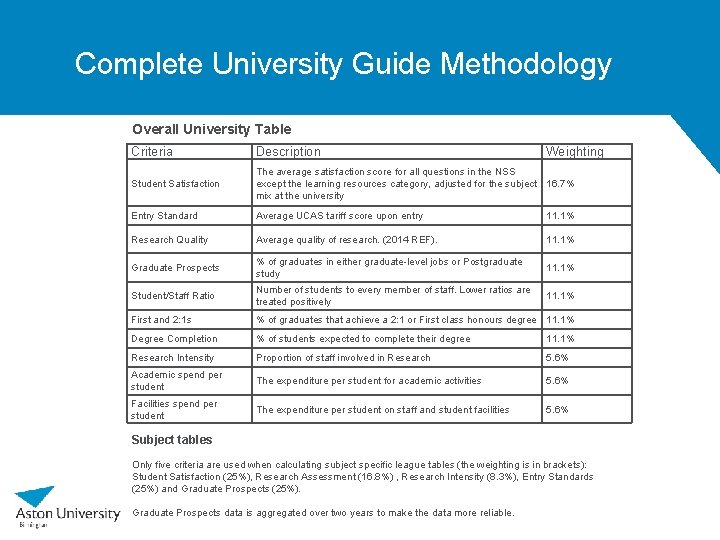
Complete University Guide Methodology Overall University Table Criteria Description Weighting Student Satisfaction The average satisfaction score for all questions in the NSS except the learning resources category, adjusted for the subject 16. 7% mix at the university Entry Standard Average UCAS tariff score upon entry 11. 1% Research Quality Average quality of research. (2014 REF). 11. 1% Graduate Prospects % of graduates in either graduate-level jobs or Postgraduate study 11. 1% Student/Staff Ratio Number of students to every member of staff. Lower ratios are treated positively 11. 1% First and 2: 1 s % of graduates that achieve a 2: 1 or First class honours degree 11. 1% Degree Completion % of students expected to complete their degree 11. 1% Research Intensity Proportion of staff involved in Research 5. 6% Academic spend per student The expenditure per student for academic activities 5. 6% Facilities spend per student The expenditure per student on staff and student facilities 5. 6% Subject tables Only five criteria are used when calculating subject specific league tables (the weighting is in brackets): Student Satisfaction (25%), Research Assessment (16. 8%) , Research Intensity (8. 3%), Entry Standards (25%) and Graduate Prospects (25%). Graduate Prospects data is aggregated over two years to make the data more reliable.
2018 Complete University Guide Key Findings Aston’s Overall Rank has dropped by 20 places on last year and is now ranked 49 th in the UK, ranking in the top half of universities. Only two metrics are ranked in the upper quartile; Student Satisfaction (27 th) and Graduate Prospects (18 th). Graduate Prospects was the only metric to have experienced an improvement in its ranking, by seven places. Three metrics are now ranked in the bottom half or lower: Student/Staff Ratio (124 th), Academic Services Spend (70 th) and Facilities Spend (68 th). Good Honours experienced the largest decrease in rankings, by 38 places. Five subject areas are ranked in the upper quartile; Aural and Oral Sciences (4 th), Building (7 th) Business and Management Studies (28 th), Marketing (12 th), and Ophthalmics (3 rd) – one more than in 2017. Only four subject areas did not experience a decline in their ranking; Aural and Oral Sciences, Chemical Engineering, Marketing, and Sociology. Marketing was the only subject area to have improved its ranking against 2017, by one place. There are six subject areas in the bottom half or lower, however, only Chemical Engineering is ranked in the bottom quartile – 25 th out of 30 institutions. The three subject areas which experienced the largest declines from last year were Electrical & Electronic Engineering (9 places), Law (8 places) and Politics (8 places).
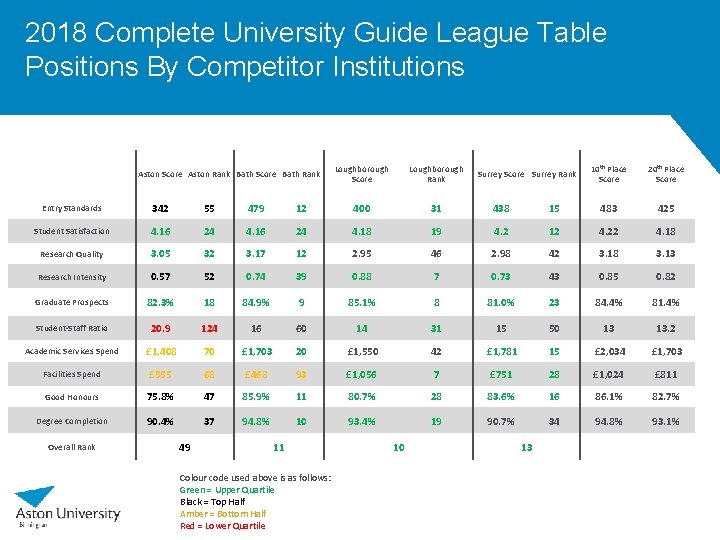
2018 Complete University Guide League Table Positions By Competitor Institutions Aston Score Aston Rank Bath Score Bath Rank Loughborough Score Loughborough Rank Surrey Score Surrey Rank 10 th Place Score 20 th Place Score Entry Standards 342 55 479 12 400 31 438 15 483 425 Student Satisfaction 4. 16 24 4. 18 19 4. 2 12 4. 22 4. 18 Research Quality 3. 05 32 3. 17 12 2. 95 46 2. 98 42 3. 18 3. 13 Research Intensity 0. 57 52 0. 74 39 0. 88 7 0. 73 43 0. 85 0. 82 Graduate Prospects 82. 3% 18 84. 9% 9 85. 1% 8 81. 0% 23 84. 4% 81. 4% Student-Staff Ratio 20. 9 124 16 60 14 31 15 50 13 13. 2 Academic Services Spend £ 1, 408 70 £ 1, 703 20 £ 1, 550 42 £ 1, 781 15 £ 2, 034 £ 1, 703 Facilities Spend £ 555 68 £ 468 93 £ 1, 056 7 £ 751 28 £ 1, 024 £ 811 Good Honours 75. 8% 47 85. 9% 11 80. 7% 28 83. 6% 16 86. 1% 82. 7% Degree Completion 90. 4% 37 94. 8% 10 93. 4% 19 90. 7% 34 94. 8% 93. 1% Overall Rank 49 11 Colour code used above is as follows: Green = Upper Quartile Black = Top Half Amber = Bottom Half Red = Lower Quartile 10 13
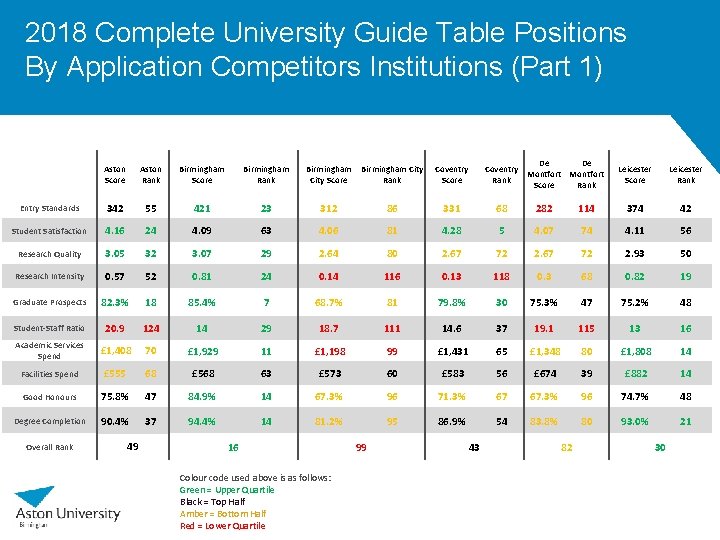
2018 Complete University Guide Table Positions By Application Competitors Institutions (Part 1) De De Coventry Montfort Rank Score Rank Aston Score Aston Rank Birmingham Score Birmingham Rank Birmingham City Score Birmingham City Rank Coventry Score Entry Standards 342 55 421 23 312 86 331 68 282 Student Satisfaction 4. 16 24 4. 09 63 4. 06 81 4. 28 5 Research Quality 3. 05 32 3. 07 29 2. 64 80 2. 67 Research Intensity 0. 57 52 0. 81 24 0. 14 116 Graduate Prospects 82. 3% 18 85. 4% 7 68. 7% Student-Staff Ratio 20. 9 124 14 29 Academic Services Spend £ 1, 408 70 £ 1, 929 Facilities Spend £ 555 68 Good Honours 75. 8% Degree Completion 90. 4% Overall Rank 49 Leicester Score Leicester Rank 114 374 42 4. 07 74 4. 11 56 72 2. 67 72 2. 93 50 0. 13 118 0. 3 68 0. 82 19 81 79. 8% 30 75. 3% 47 75. 2% 48 18. 7 111 14. 6 37 19. 1 115 13 16 11 £ 1, 198 99 £ 1, 431 65 £ 1, 348 80 £ 1, 808 14 £ 568 63 £ 573 60 £ 583 56 £ 674 39 £ 882 14 47 84. 9% 14 67. 3% 96 71. 3% 67 67. 3% 96 74. 7% 48 37 94. 4% 14 81. 2% 95 86. 9% 54 83. 8% 80 93. 0% 21 16 Colour code used above is as follows: Green = Upper Quartile Black = Top Half Amber = Bottom Half Red = Lower Quartile 99 43 82 30
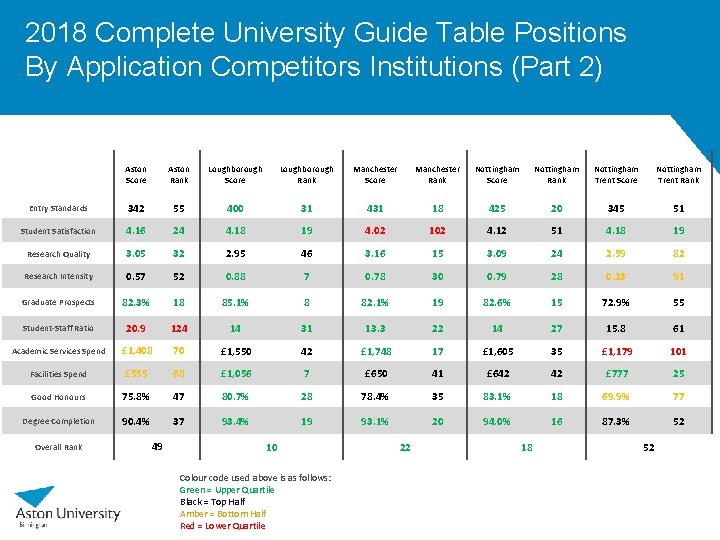
2018 Complete University Guide Table Positions By Application Competitors Institutions (Part 2) Aston Score Aston Rank Loughborough Score Loughborough Rank Manchester Score Manchester Rank Nottingham Score Nottingham Rank Nottingham Trent Score Nottingham Trent Rank Entry Standards 342 55 400 31 431 18 425 20 345 51 Student Satisfaction 4. 16 24 4. 18 19 4. 02 102 4. 12 51 4. 18 19 Research Quality 3. 05 32 2. 95 46 3. 16 15 3. 09 24 2. 59 82 Research Intensity 0. 57 52 0. 88 7 0. 78 30 0. 79 28 0. 23 91 Graduate Prospects 82. 3% 18 85. 1% 8 82. 1% 19 82. 6% 15 72. 9% 55 Student-Staff Ratio 20. 9 124 14 31 13. 3 22 14 27 15. 8 61 Academic Services Spend £ 1, 408 70 £ 1, 550 42 £ 1, 748 17 £ 1, 605 35 £ 1, 179 101 Facilities Spend £ 555 68 £ 1, 056 7 £ 650 41 £ 642 42 £ 777 25 Good Honours 75. 8% 47 80. 7% 28 78. 4% 35 83. 1% 18 69. 9% 77 Degree Completion 90. 4% 37 93. 4% 19 93. 1% 20 94. 0% 16 87. 3% 52 Overall Rank 49 10 Colour code used above is as follows: Green = Upper Quartile Black = Top Half Amber = Bottom Half Red = Lower Quartile 22 18 52
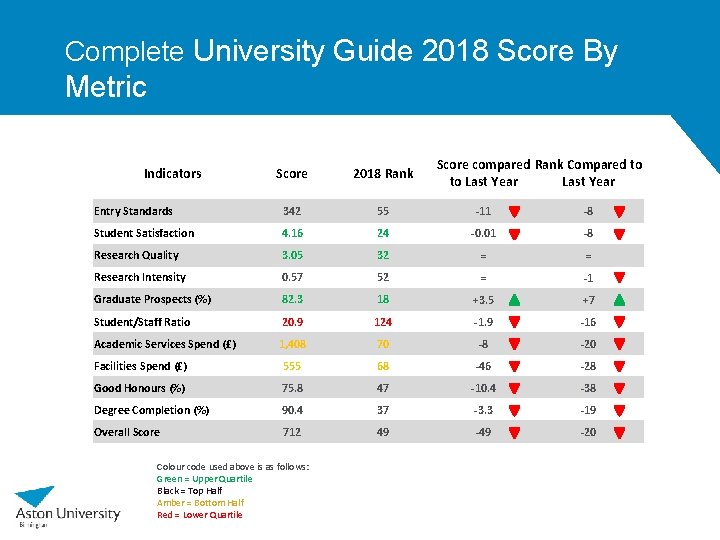
Complete University Guide 2018 Score By Metric Indicators Score compared Rank Compared to to Last Year Score 2018 Rank Entry Standards 342 55 -11 -8 Student Satisfaction 4. 16 24 -0. 01 -8 Research Quality 3. 05 32 = = Research Intensity 0. 57 52 = -1 Graduate Prospects (%) 82. 3 18 +3. 5 +7 Student/Staff Ratio 20. 9 124 -1. 9 -16 Academic Services Spend (£) 1, 408 70 -8 -20 Facilities Spend (£) 555 68 -46 -28 Good Honours (%) 75. 8 47 -10. 4 -38 Degree Completion (%) 90. 4 37 -3. 3 -19 Overall Score 712 49 -20 Colour code used above is as follows: Green = Upper Quartile Black = Top Half Amber = Bottom Half Red = Lower Quartile
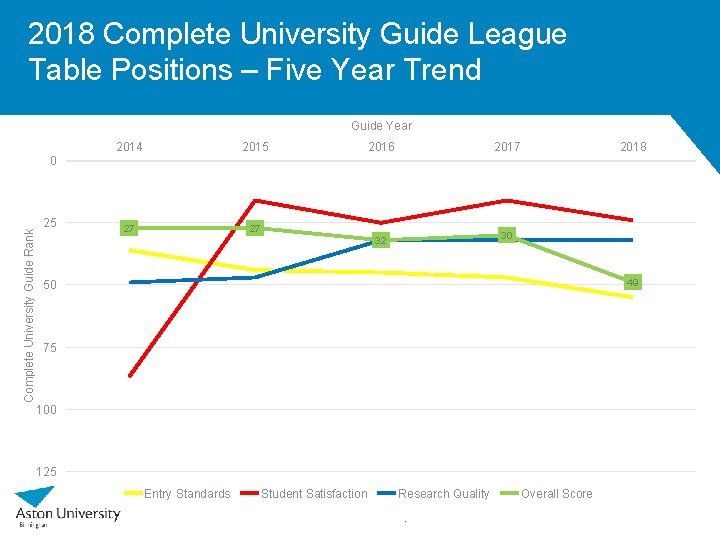
2018 Complete University Guide League Table Positions – Five Year Trend Guide Year 2014 2015 27 27 2016 2017 32 30 2018 Complete University Guide Rank 0 25 49 50 75 100 125 Entry Standards Student Satisfaction Research Quality. Overall Score
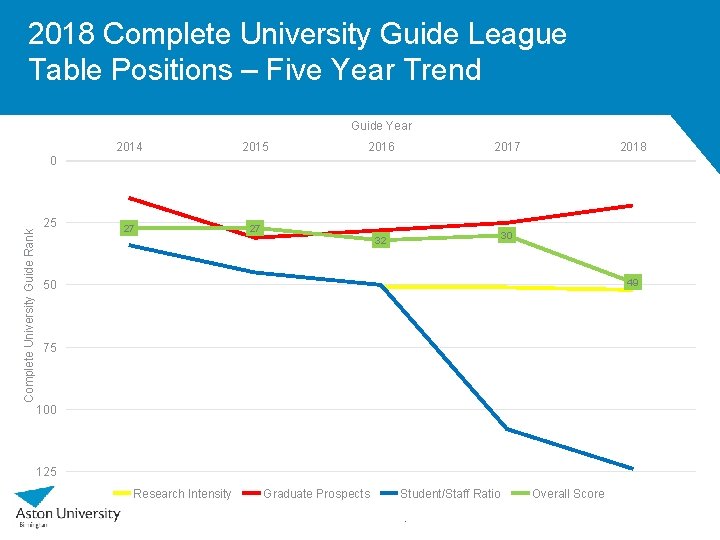
2018 Complete University Guide League Table Positions – Five Year Trend Guide Year 2014 2015 27 27 2016 2017 32 30 2018 Complete University Guide Rank 0 25 49 50 75 100 125 Research Intensity Graduate Prospects Student/Staff Ratio. Overall Score
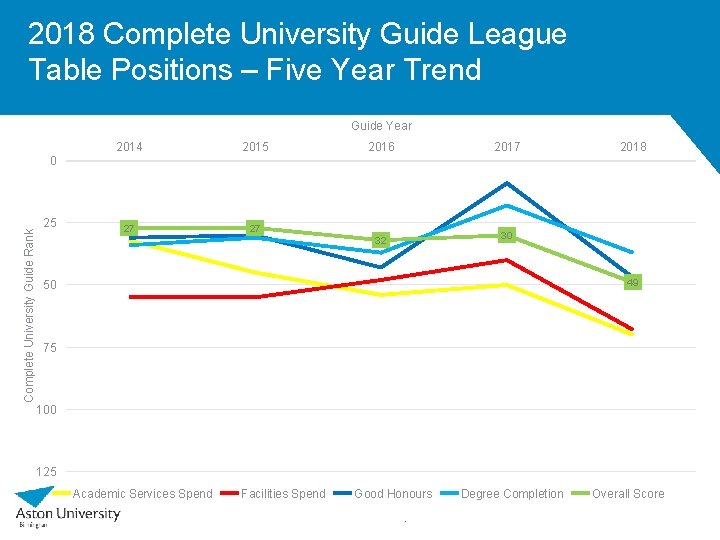
2018 Complete University Guide League Table Positions – Five Year Trend Guide Year 2014 2015 27 27 2016 2017 32 30 2018 Complete University Guide Rank 0 25 49 50 75 100 125 Academic Services Spend Facilities Spend Good Honours. Degree Completion Overall Score
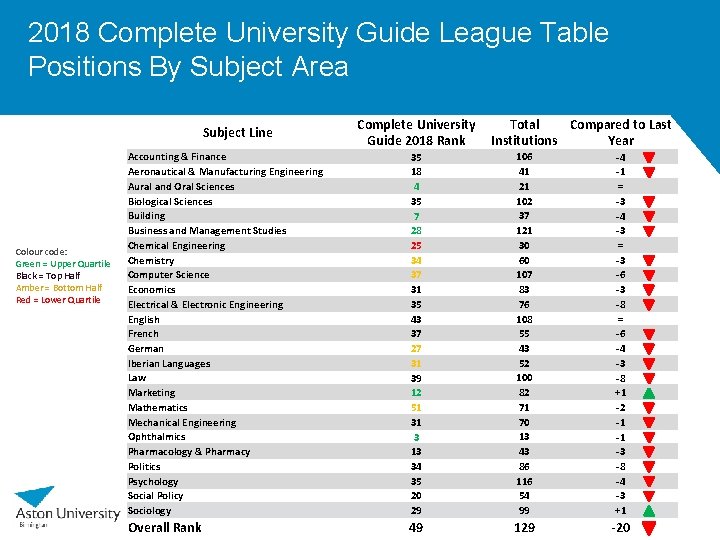
2018 Complete University Guide League Table Positions By Subject Area Subject Line Colour code: Green = Upper Quartile Black = Top Half Amber = Bottom Half Red = Lower Quartile Complete University Guide 2018 Rank Total Compared to Last Institutions Year Accounting & Finance Aeronautical & Manufacturing Engineering Aural and Oral Sciences Biological Sciences Building Business and Management Studies Chemical Engineering Chemistry Computer Science Economics Electrical & Electronic Engineering English French German Iberian Languages Law Marketing Mathematics Mechanical Engineering Ophthalmics Pharmacology & Pharmacy Politics Psychology Social Policy Sociology 35 18 4 35 7 28 25 34 37 31 35 43 37 27 31 39 12 51 31 3 13 34 35 20 29 106 41 21 102 37 121 30 60 107 83 76 108 55 43 52 100 82 71 70 13 43 86 116 54 99 -4 -1 = -3 -4 -3 = -3 -6 -3 -8 = -6 -4 -3 -8 +1 -2 -1 -1 -3 -8 -4 -3 +1 Overall Rank 49 129 -20
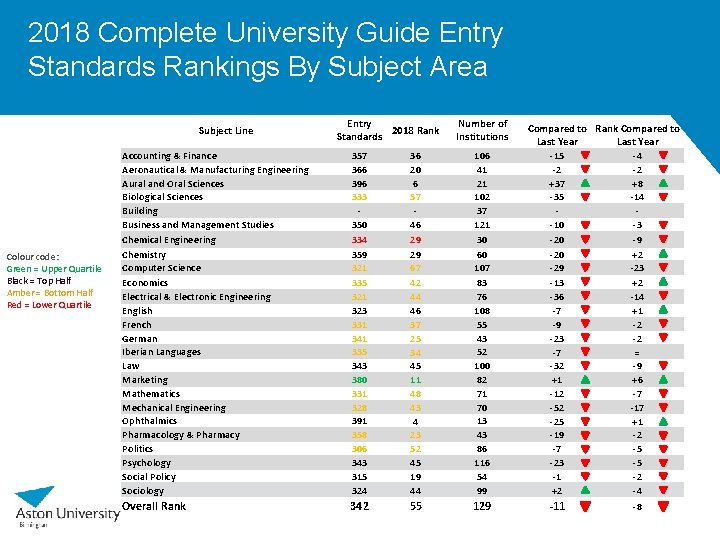
2018 Complete University Guide Entry Standards Rankings By Subject Area Subject Line Colour code: Green = Upper Quartile Black = Top Half Amber = Bottom Half Red = Lower Quartile Entry 2018 Rank Standards Number of Institutions Accounting & Finance Aeronautical & Manufacturing Engineering Aural and Oral Sciences Biological Sciences Building Business and Management Studies Chemical Engineering Chemistry Computer Science Economics Electrical & Electronic Engineering English French German Iberian Languages Law Marketing Mathematics Mechanical Engineering Ophthalmics Pharmacology & Pharmacy Politics Psychology Social Policy Sociology 357 366 396 333 350 334 359 321 335 321 323 331 341 335 343 380 331 328 391 358 306 343 315 324 36 20 6 57 46 29 29 67 42 44 46 37 25 34 45 11 48 43 4 23 52 45 19 44 106 41 21 102 37 121 30 60 107 83 76 108 55 43 52 100 82 71 70 13 43 86 116 54 99 Overall Rank 342 55 129 Compared to Rank Compared to Last Year -15 -4 -2 -2 +37 +8 -35 -14 -10 -3 -20 -9 -20 +2 -29 -23 -13 +2 -36 -14 -7 +1 -9 -2 -23 -2 -7 = -32 -9 +1 +6 -12 -7 -52 -17 -25 +1 -19 -2 -7 -5 -23 -5 -1 -2 +2 -4 -8 -11
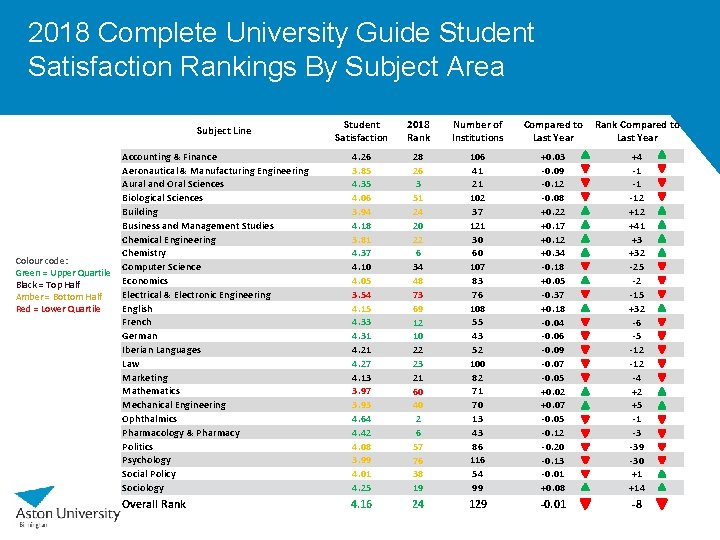
2018 Complete University Guide Student Satisfaction Rankings By Subject Area Student Satisfaction 2018 Rank Number of Institutions Compared to Last Year Rank Compared to Last Year Accounting & Finance Aeronautical & Manufacturing Engineering Aural and Oral Sciences Biological Sciences Building Business and Management Studies Chemical Engineering Chemistry Computer Science Economics Electrical & Electronic Engineering English French German Iberian Languages Law Marketing Mathematics Mechanical Engineering Ophthalmics Pharmacology & Pharmacy Politics Psychology Social Policy Sociology 4. 26 3. 85 4. 35 4. 06 3. 94 4. 18 3. 81 4. 37 4. 10 4. 05 3. 54 4. 15 4. 33 4. 31 4. 27 4. 13 3. 97 3. 93 4. 64 4. 42 4. 08 3. 99 4. 01 4. 25 28 26 3 51 24 20 22 6 34 48 73 69 12 10 22 23 21 60 40 2 6 57 76 38 19 106 41 21 102 37 121 30 60 107 83 76 108 55 43 52 100 82 71 70 13 43 86 116 54 99 +0. 03 -0. 09 -0. 12 -0. 08 +0. 22 +0. 17 +0. 12 +0. 34 -0. 18 +0. 05 -0. 37 +0. 18 -0. 04 -0. 06 -0. 09 -0. 07 -0. 05 +0. 02 +0. 07 -0. 05 -0. 12 -0. 20 -0. 13 -0. 01 +0. 08 +4 -1 -1 -12 +41 +3 +32 -25 -2 -15 +32 -6 -5 -12 -4 +2 +5 -1 -3 -39 -30 +1 +14 Overall Rank 4. 16 24 129 -0. 01 -8 Subject Line Colour code: Green = Upper Quartile Black = Top Half Amber = Bottom Half Red = Lower Quartile
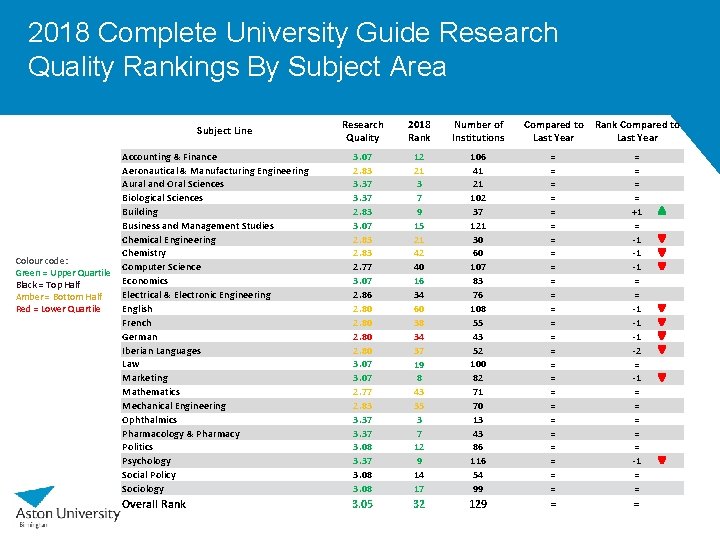
2018 Complete University Guide Research Quality Rankings By Subject Area Research Quality 2018 Rank Number of Institutions Compared to Last Year Rank Compared to Last Year Accounting & Finance Aeronautical & Manufacturing Engineering Aural and Oral Sciences Biological Sciences Building Business and Management Studies Chemical Engineering Chemistry Computer Science Economics Electrical & Electronic Engineering English French German Iberian Languages Law Marketing Mathematics Mechanical Engineering Ophthalmics Pharmacology & Pharmacy Politics Psychology Social Policy Sociology 3. 07 2. 83 3. 37 2. 83 3. 07 2. 83 2. 77 3. 07 2. 86 2. 80 3. 07 2. 77 2. 83 3. 37 3. 08 12 21 3 7 9 15 21 42 40 16 34 60 38 34 37 19 8 43 35 3 7 12 9 14 17 106 41 21 102 37 121 30 60 107 83 76 108 55 43 52 100 82 71 70 13 43 86 116 54 99 = = = = = = = = +1 = -1 -1 -1 = = -1 -1 -1 -2 = -1 = = Overall Rank 3. 05 32 129 = = Subject Line Colour code: Green = Upper Quartile Black = Top Half Amber = Bottom Half Red = Lower Quartile
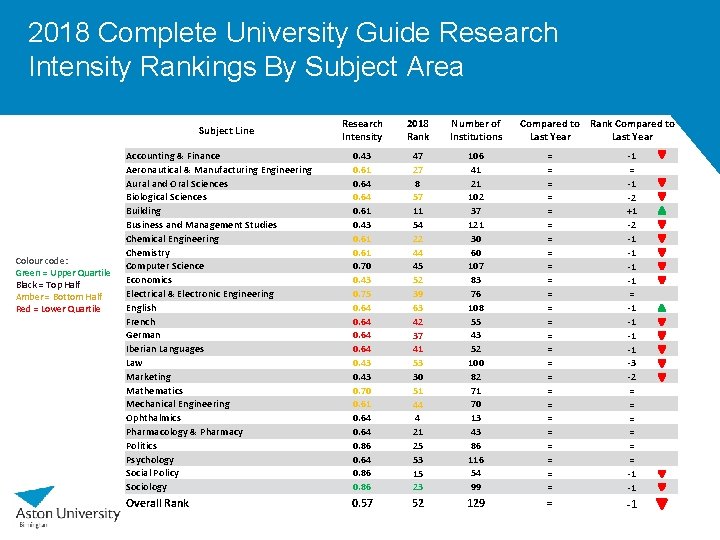
2018 Complete University Guide Research Intensity Rankings By Subject Area Research Intensity 2018 Rank Number of Institutions Accounting & Finance Aeronautical & Manufacturing Engineering Aural and Oral Sciences Biological Sciences Building Business and Management Studies Chemical Engineering Chemistry Computer Science Economics Electrical & Electronic Engineering English French German Iberian Languages Law Marketing Mathematics Mechanical Engineering Ophthalmics Pharmacology & Pharmacy Politics Psychology Social Policy Sociology 0. 43 0. 61 0. 64 0. 61 0. 43 0. 61 0. 70 0. 43 0. 75 0. 64 0. 43 0. 70 0. 61 0. 64 0. 86 47 27 8 57 11 54 22 44 45 52 39 63 42 37 41 53 30 51 44 4 21 25 53 15 23 106 41 21 102 37 121 30 60 107 83 76 108 55 43 52 100 82 71 70 13 43 86 116 54 99 = = = = = = = -1 -2 +1 -2 -1 -1 = -1 -1 -3 -2 = = = -1 -1 Overall Rank 0. 57 52 129 = -1 Subject Line Colour code: Green = Upper Quartile Black = Top Half Amber = Bottom Half Red = Lower Quartile Compared to Rank Compared to Last Year
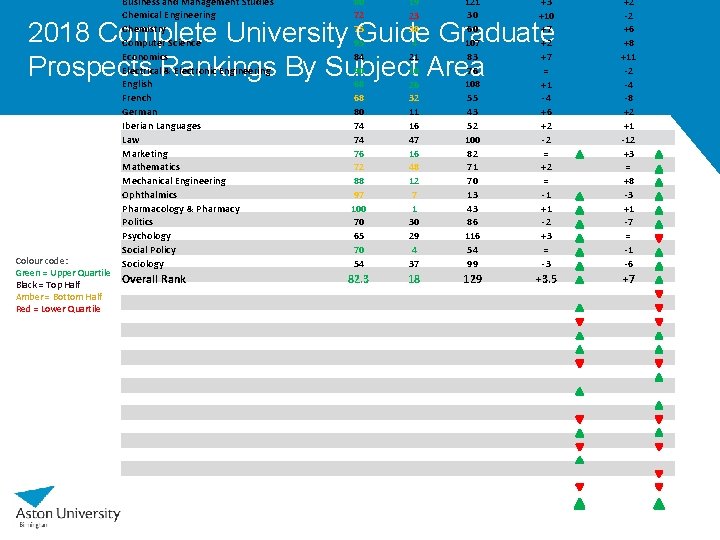
Business and Management Studies Chemical Engineering Chemistry Computer Science Economics Electrical & Electronic Engineering English French German Iberian Languages Law Marketing Mathematics Mechanical Engineering Ophthalmics Pharmacology & Pharmacy Politics Psychology Social Policy Sociology 80 72 75 95 84 90 68 68 80 74 74 76 72 88 97 100 70 65 70 54 19 23 38 4 21 10 26 32 11 16 47 16 48 12 7 1 30 29 4 37 121 30 60 107 83 76 108 55 43 52 100 82 71 70 13 43 86 116 54 99 +3 +10 +7 +2 +7 = +1 -4 +6 +2 -2 = +2 = -1 +1 -2 +3 = -3 +2 -2 +6 +8 +11 -2 -4 -8 +2 +1 -12 +3 = +8 -3 +1 -7 = -1 -6 Overall Rank 82. 3 18 129 +3. 5 +7 2018 Complete University Guide Graduate Prospects Rankings By Subject Area Colour code: Green = Upper Quartile Black = Top Half Amber = Bottom Half Red = Lower Quartile
- Slides: 17