complementation In genetics complementation occurs when two strains


![The LOD score (logarithm (base 10) of odds), developed by Newton Morton, [9] is](https://slidetodoc.com/presentation_image_h2/d692347298fa9ceb2976c0a86c618ca4/image-6.jpg "The LOD score (logarithm (base 10) of odds), developed by Newton Morton, [9] is")


- Slides: 35
complementation
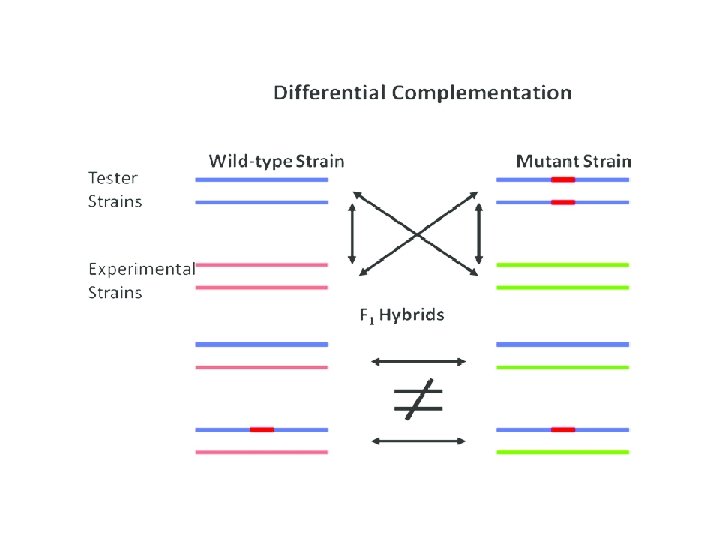
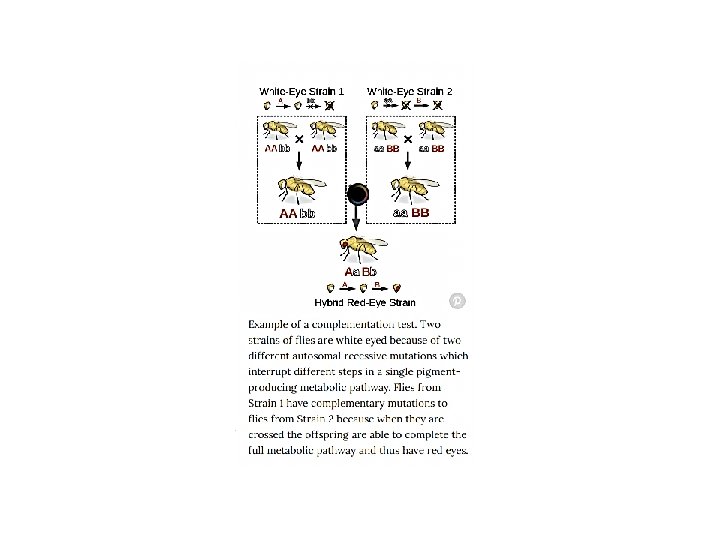
In genetics, complementation occurs when two strains of an organism with different homozygous recessive mutations that produce the same mutant phenotype (for example, a change in wing structure in flies) produce offspring with the wild-type phenotype when mated or crossed. Complementation will occur only if the mutations are in different genes. In this case, each strain's genome supplies the wildtype allele to "complement" the mutated allele of the other strain's genome. Since the mutations are recessive, the offspring will display the wild-type phenotype. A complementation test (sometimes called a "cis-trans" test) can be used to test whether the mutations in two strains are in different genes. Complementation will not occur if the mutations are in the same gene. The convenience and essence of this test is that the mutations that produce a phenotype can be assigned to different genes without the exact knowledge of what the gene product is doing on a molecular level. The complementation test was developed by American geneticist Edward B. Lewis.
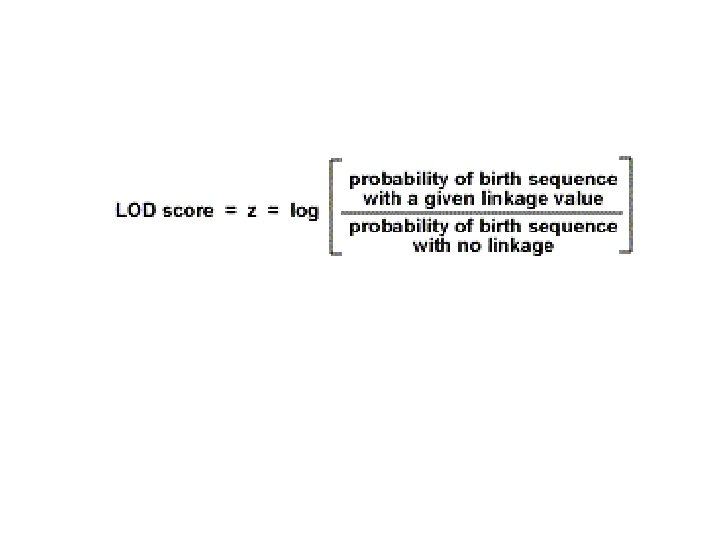
Lod Score Method We will now introduce a new method to calculate linkage distances called the Lod Score Method. The method developed by Newton E. Morton is an iterative approach were a series of lod scores are calculated from a number of proposed linkage distance. Here is how the method works. A linkage distance is estimated, and given that estimate, the probablity of a given birth sequence is calculated.
The LOD score (logarithm (base 10) of odds), developed by Newton Morton, [9] is a statistical test often used for linkage analysis in human, animal, and plant populations. The LOD score compares the likelihood of obtaining the test data if the two loci are indeed linked, to the likelihood of observing the same data purely by chance. Positive LOD scores favour the presence of linkage, whereas negative LOD scores indicate that linkage is less likely. Computerised LOD score analysis is a simple way to analyse complex family pedigrees in order to determine the linkage between Mendelian traits (or between a trait and a marker, or two markers). The method is described in greater detail by Strachan and Read. Briefly, it works as follows: Establish a pedigree Make a number of estimates of recombination frequency Calculate a LOD score for each estimate The estimate with the highest LOD score will be considered the best estimate
Lod Score Method of Estimating Linkage Distances The following pedigree will be used to demonstrate another method developed to determine the distance between genes. This approach has been widely adapted to various system and genetic programs have been developed based on this technique. First let's look at the pedigree below.
What is QTL? QTL = a gene or chromosomal region that affects a quantitative trait. It must be polymorphic (have allelic variation) to have an effect in a population and it must be linked to a polymorphic marker allele to be detected
What statistical method would you use to analyze complex traits? QTL analysis is particularly helpful, bridging the gap between genes and the phenotypic traits that result from them. Quantitative trait locus (QTL) analysis is a statistical method that links two types of information—phenotypic data (trait measurements) and genotypic data (usually molecular markers)—in an attempt to explain the genetic basis of variation in complex traits (Falconer & Mackay, 1996; Kearsey, 1998; Lynch & Walsh, 1998). QTL analysis allows researchers in fields as diverse as agriculture, evolution, and medicine to link certain complex phenotypes to specific regions of chromosomes. The goal of this process is to identify the action, interaction, number, and precise location of these regions.
QTL mapping strategies All marker-based mapping experiments have same basic strategy: Select parents that differ for a trait Screen the two parents for polymorphic marker loci Generate recombinant inbred lines (can use F 2 -derived lines)Phenotype (screen in field) Contrast the mean of the MM and mm lines at every marker locus Declare QTL where (MM-mm) is greatest.
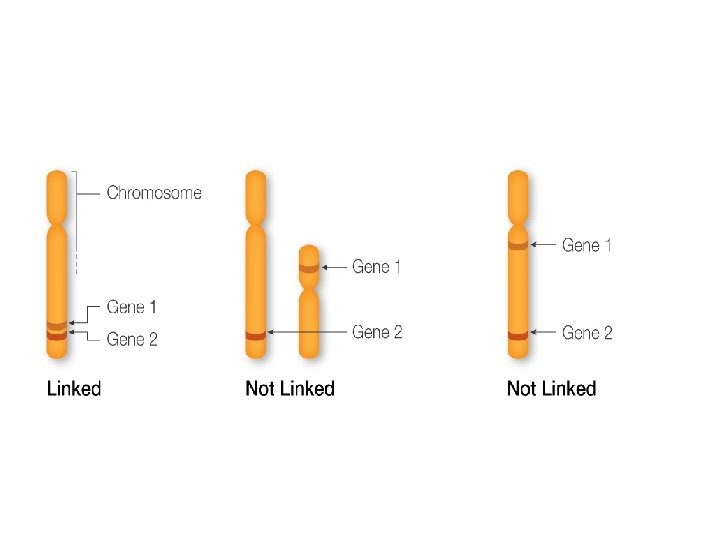
What is a gene map? Gene maps help describe the spatial arrangement of genes on a chromosome. Genes are designated to a specific location on a chromosome known as the locus and can be used as molecular markers to find the distance between other genes on a chromosome. How are gene maps produced? To produce a genetic map, researchers collect blood or tissue samples from members of families in which a certain disease or trait is prevalent. . DNA markers don't, by themselves, identify the gene responsible for the disease or trait; but they can tell researchers roughly where the gene is on the chromosome. Why is Gene mapping important? Genome mapping is an important tool for locating a specific gene to a particular region of a chromosome and to determine its relative distances between genes and molecular markers on the chromosome.
Gene mapping describes the methods used to identify the locus of a gene and the distances between genes. Genetic mapping - also called linkage mapping - can offer firm evidence that a disease transmitted from parent to child is linked to one or more genes. Mapping also provides clues about which chromosome contains the gene and precisely where the gene lies on that chromosome.
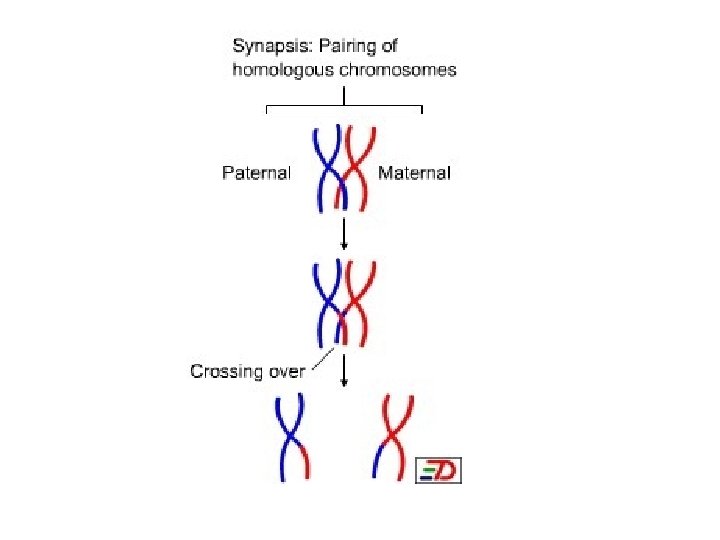
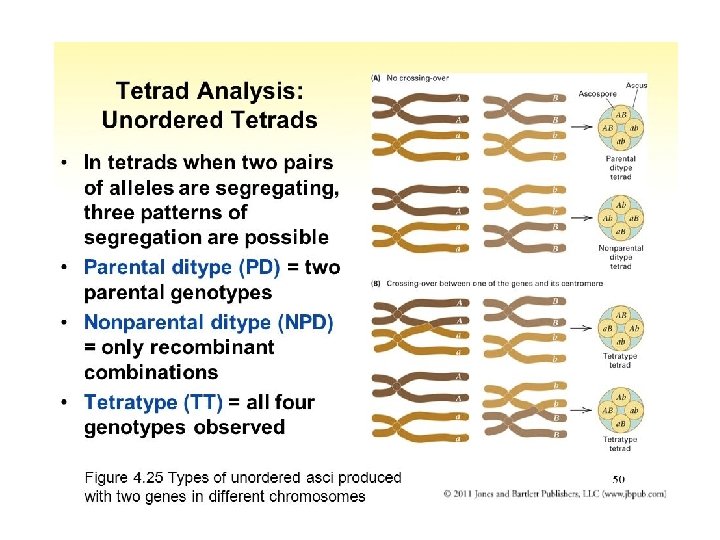
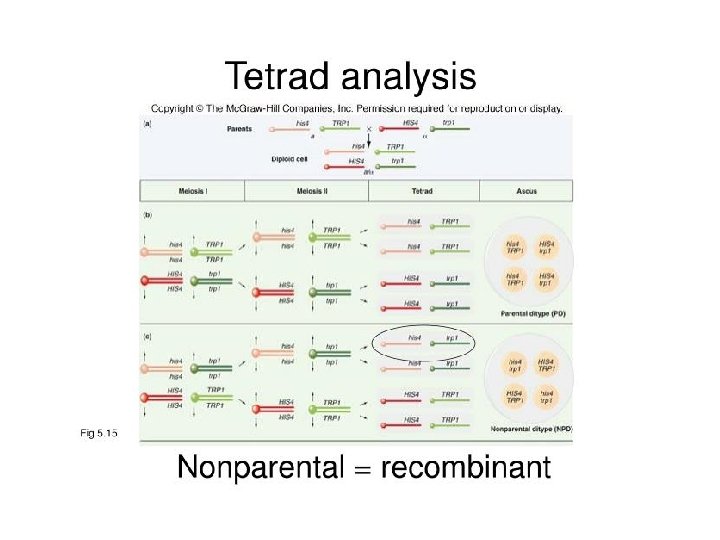
A Dyad is a replicated chromosome having two sister chromatids. A Tetrad, also known as Bivalent Chromosome is a pair of replicated chromosome (where both chromosomes are homologous) temporarily joined to each other as a result of crossing over forming chaismata at the points where crossing over occurs. Crossing over occurs between prophase 1 and metaphase 1 and is the process where homologous chromosomes pair up with each other and exchange different segments of their genetic material to form recombinant chromosomes. It can also happen during mitotic division, which may result in loss of heterozygosity.
Genetic screen Positional cloning A genetic screen or mutagenesis screen is an experimental technique used to identify and select for individuals who possess a phenotype of interest in a mutagenized population. [1] Hence a genetic screen is a type of phenotypic screen. Genetic screens can provide important information on gene function as well as the molecular events that underlie a biological process or pathway. While genome projects have identified an extensive inventory of genes in many different organisms, genetic screens can provide valuable insight as to how those genes function
Gene mapping The first steps of building a genetic map are the development of genetic markers and a mapping population. The closer two markers are on the chromosome, the more likely they are to be passed on to the next generation together. Therefore, the "cosegregation" patterns of all markers can be used to reconstruct their order. With this in mind, the genotypes of each genetic marker are recorded for both parents and each individual in the following generations. The quality of the genetic maps is largely dependent upon these factors: the number of genetic markers on the map and the size of the mapping population. The two factors are interlinked, as a larger mapping population could increase the "resolution" of the map and prevent the map being "saturated".
Physical mapping Since actual base-pair distances are generally hard or impossible to directly measure, physical maps are actually constructed by first shattering the genome into hierarchically smaller pieces. By characterizing each single piece and assembling back together, the overlapping path or "tiling path" of these small fragments would allow researchers to infer physical distances between genomic features. The fragmentation of the genome can be achieved by restriction enzyme cutting or by physically shattering the genome by processes like sonication. Once cut, the DNA fragments are separated by electrophoresis. The resulting pattern of DNA migration (i. e. its genetic fingerprint) is used to identify what stretch of DNA is in the clone. By analyzing the fingerprints, contigs are assembled by automated (FPC) or manual means (pathfinders) into overlapping DNA stretches. Now a good choice of clones can be made to efficiently sequence the clones to determine the DNA sequence of the organism under study.
Genetic maps depict relative positions of loci based on the degree of recombination. This approach studies the inheritance/assortment of traits by genetic analysis. Physical maps show the actual (physical) distance between loci (in nucleotides). This approach applies techniques of molecular biology.
Genome sequencing is sometimes mistakenly referred to as "genome mapping" by non-biologists. The process of "shotgun sequencing" resembles the process of physical mapping: it shatters the genome into small fragments, characterizes each fragment, then puts them back together (more recent sequencing technologies are drastically different). While the scope, purpose and process are totally different, a genome assembly can be viewed as the "ultimate" form of physical map, in that it provides in a much better way all the information that a traditional physical map can offer.
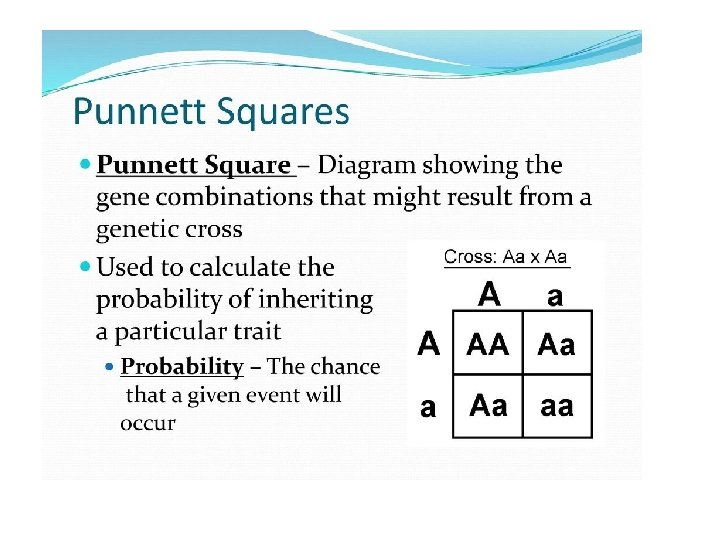
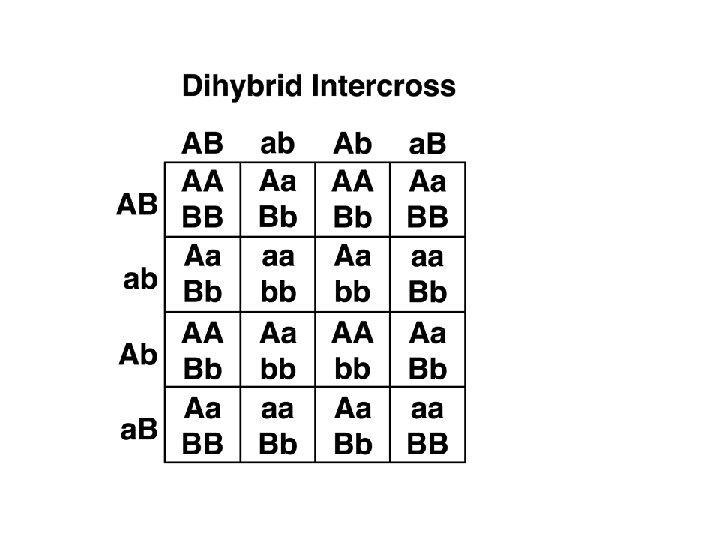
Punnett Square Definition A Punnett square is a graphical representation of the possible genotypes of an offspring arising from a particular cross or breeding event. Creating a Punnett square requires knowledge of the genetic composition of the parents. The various possible combinations of their gametes are encapsulated in a tabular format. Therefore, each box in the table represents one fertilization event.
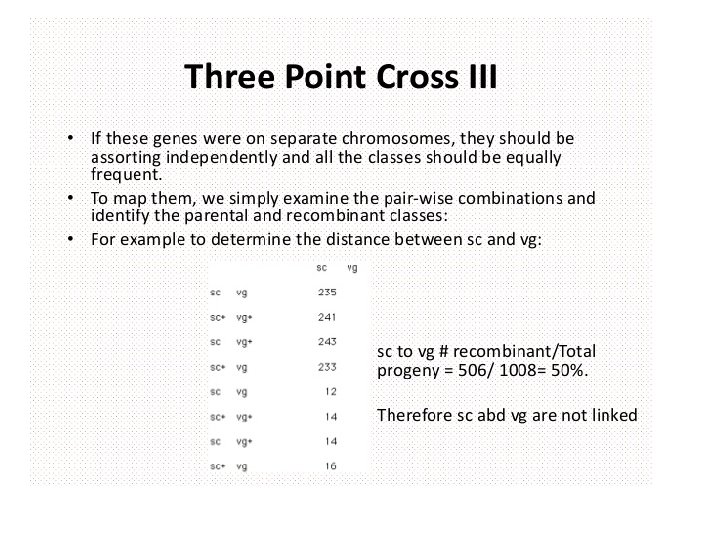
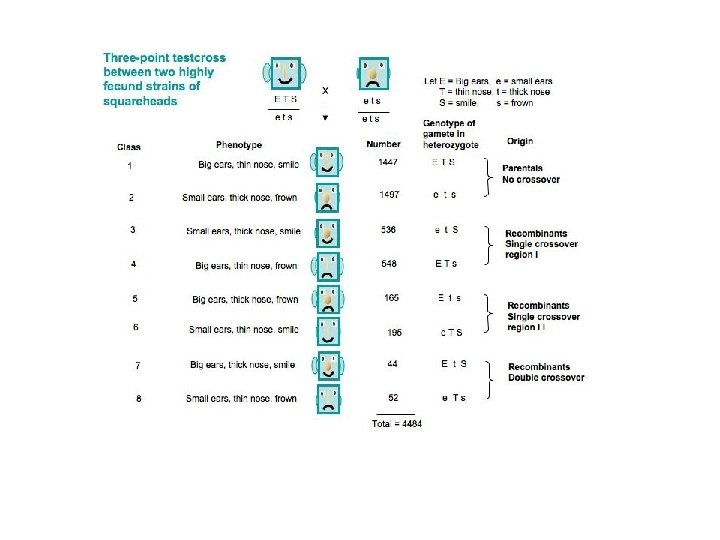
Calculating recombination frequencies • This involves counting the number of progeny in which a crossover occurs between the two genes. • Note: must count double-crossover class.