Competitor Analysis and Multimarket Competition The Role of
- Slides: 16
Competitor Analysis and Multimarket Competition The Role of Competitor Position in Crafting Strategy
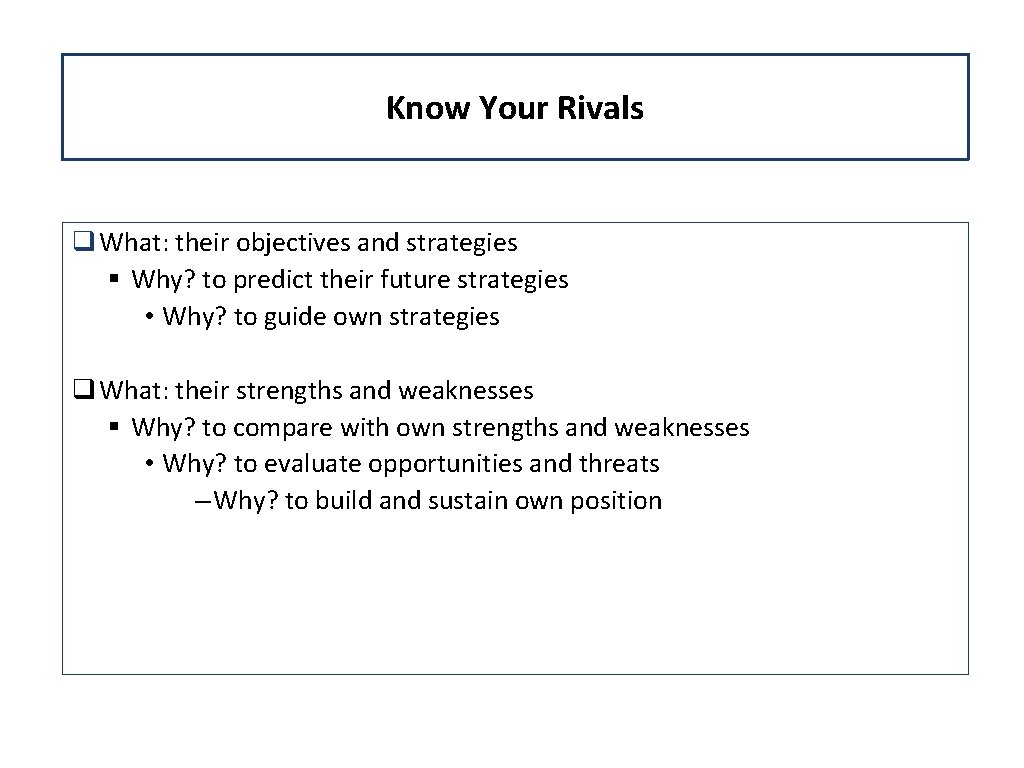
Know Your Rivals q What: their objectives and strategies § Why? to predict their future strategies • Why? to guide own strategies q What: their strengths and weaknesses § Why? to compare with own strengths and weaknesses • Why? to evaluate opportunities and threats – Why? to build and sustain own position
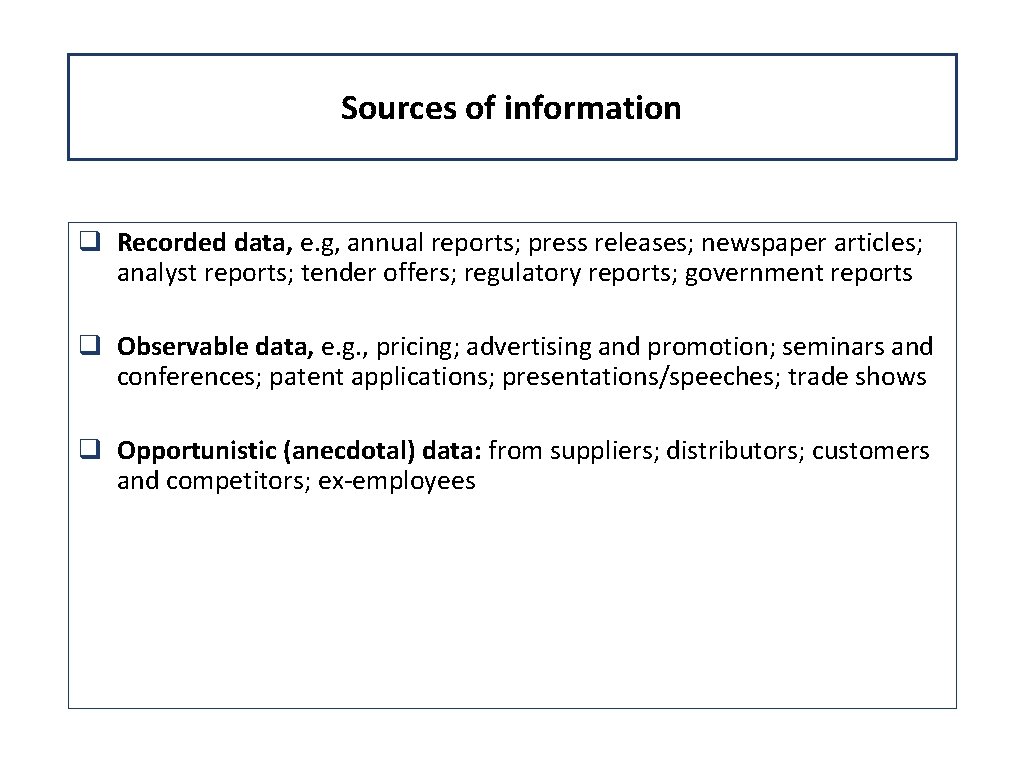
Sources of information q Recorded data, e. g, annual reports; press releases; newspaper articles; analyst reports; tender offers; regulatory reports; government reports q Observable data, e. g. , pricing; advertising and promotion; seminars and conferences; patent applications; presentations/speeches; trade shows q Opportunistic (anecdotal) data: from suppliers; distributors; customers and competitors; ex-employees
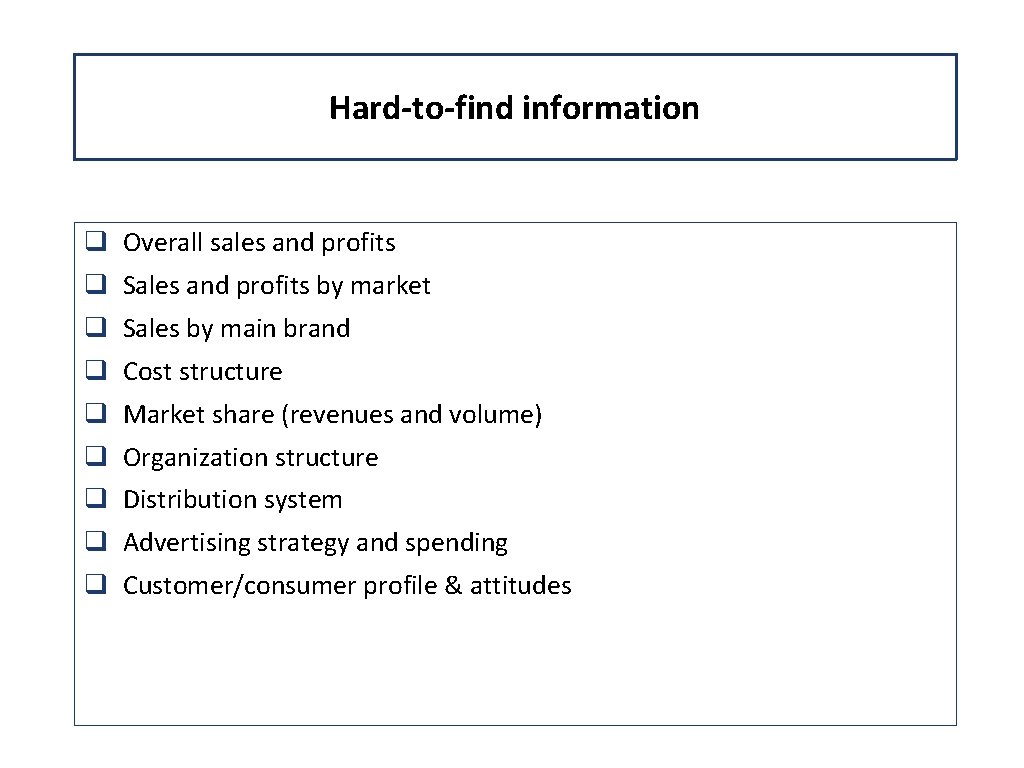
Hard-to-find information q Overall sales and profits q Sales and profits by market q Sales by main brand q Cost structure q Market share (revenues and volume) q Organization structure q Distribution system q Advertising strategy and spending q Customer/consumer profile & attitudes
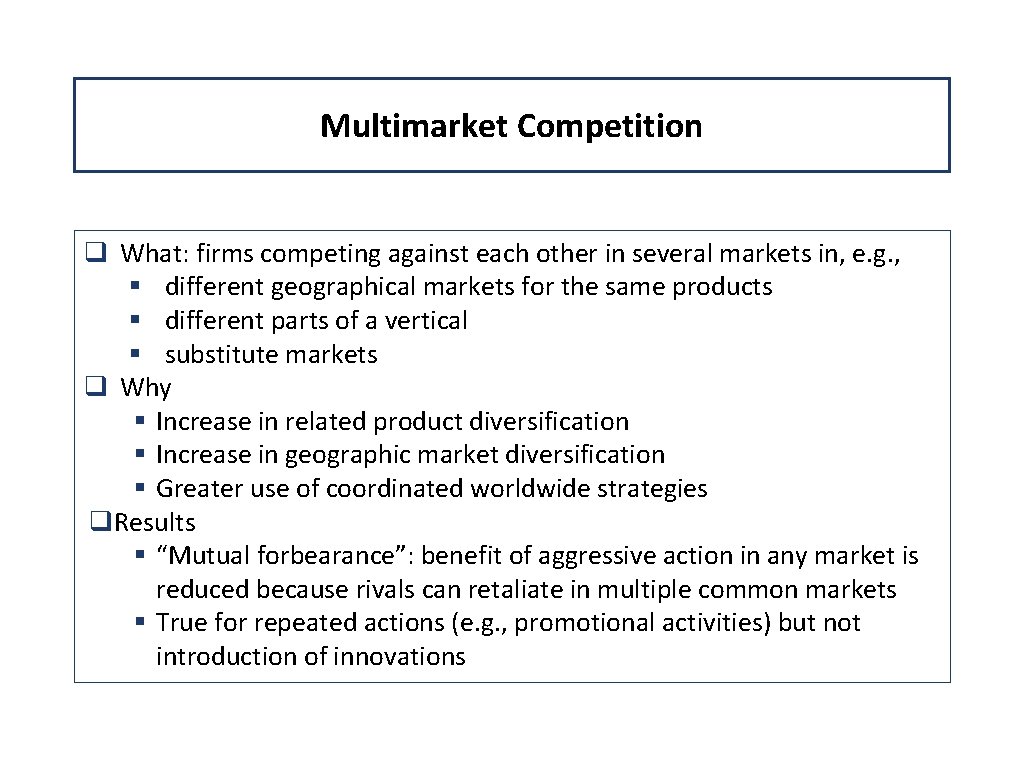
Multimarket Competition q What: firms competing against each other in several markets in, e. g. , § different geographical markets for the same products § different parts of a vertical § substitute markets q Why § Increase in related product diversification § Increase in geographic market diversification § Greater use of coordinated worldwide strategies q. Results § “Mutual forbearance”: benefit of aggressive action in any market is reduced because rivals can retaliate in multiple common markets § True for repeated actions (e. g. , promotional activities) but not introduction of innovations
Visual Aids q Multimarket Competitor Chart: displays competitors in common markets q Strategic Group Map: displays clusters of rivals along two dimensions of industry positioning
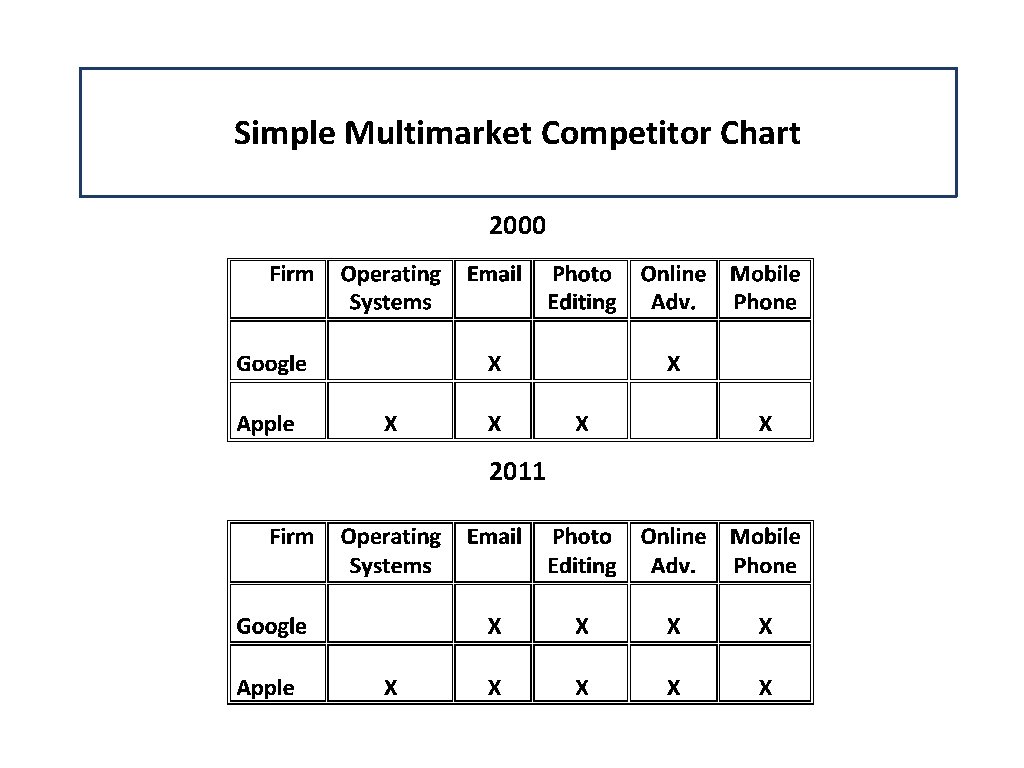
Simple Multimarket Competitor Chart 2000 2011
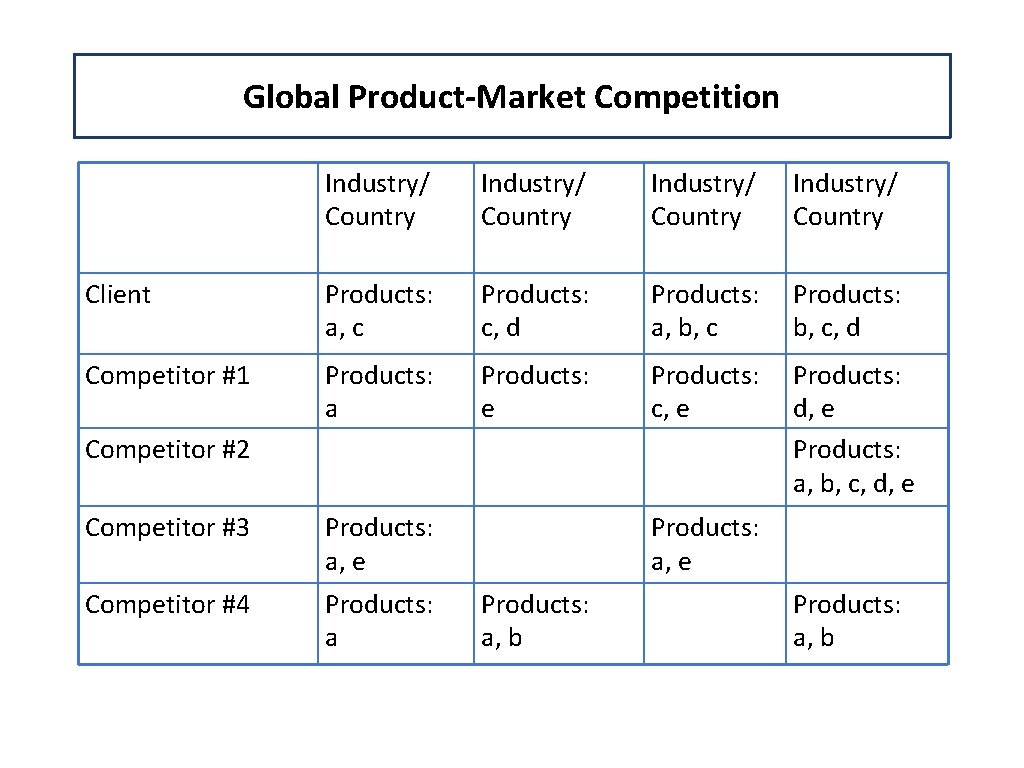
Global Product-Market Competition Industry/ Country Client Products: a, c Products: c, d Products: a, b, c Products: b, c, d Competitor #1 Products: a Products: e Products: c, e Products: d, e Products: a, b, c, d, e Competitor #2 Competitor #3 Products: a, e Competitor #4 Products: a, e Products: a, b
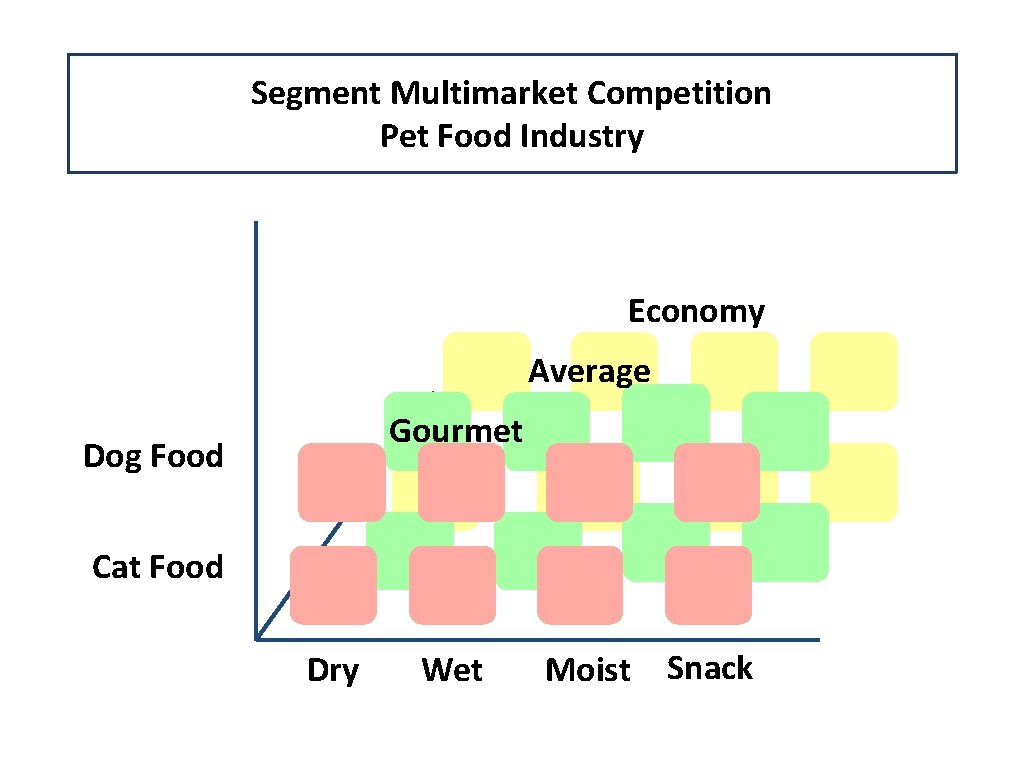
Segment Multimarket Competition Pet Food Industry Economy Average Gourmet Dog Food Cat Food Dry Wet Moist Snack
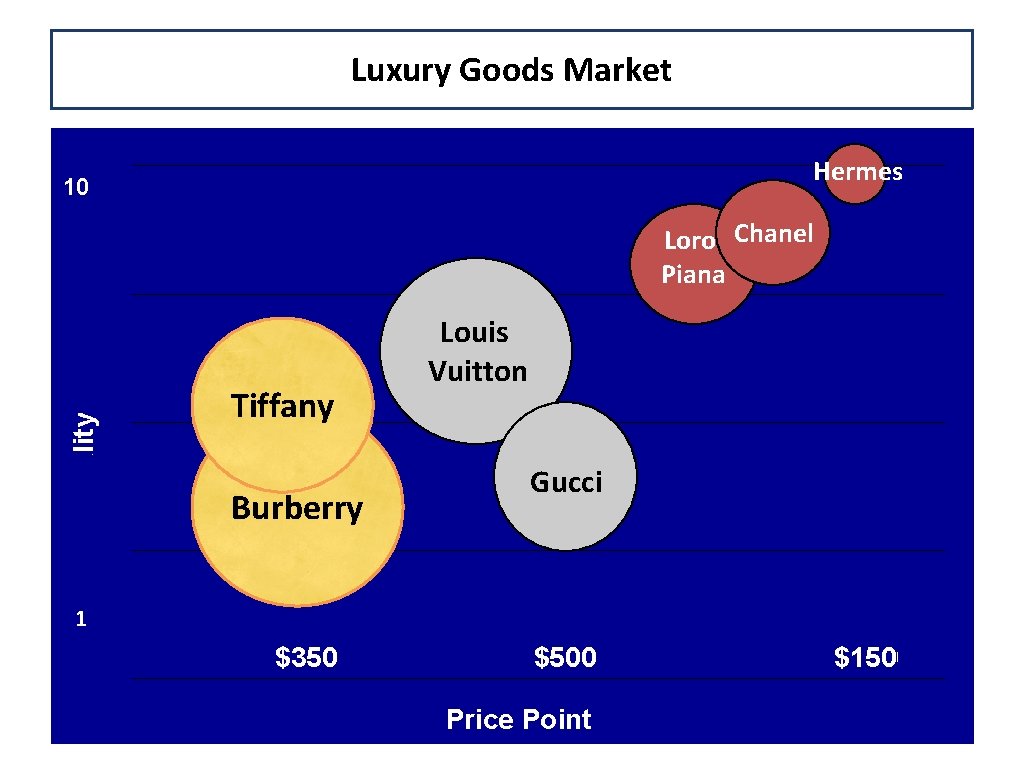
Strategic Group Maps q A strategic group consists of rival firms with similar competitive strategies and positioning in an industry q A strategic group map displays clusters of groups within an industry based on two variables that you choose for their strategic significance.
Some Strategic Variables q Specialization q Brand identification (private label, brand) q Distribution channels q Product quality q Vertical integration q Cost position q Service q Price point ***Outcome variables like profit and market share should not be used to distinguish competitive groups
Constructing a Strategic Group Map 1. Choose two variables that distinguish competitors § Maximize contrast § Minimize correlation 2. Plot on graph 3. Represent firm/group size with circle proportional to market share OR 1. Begin grouping firms and then identify variables 2. Position firms on map 3. Represent firm/group size with circle proportional to market share
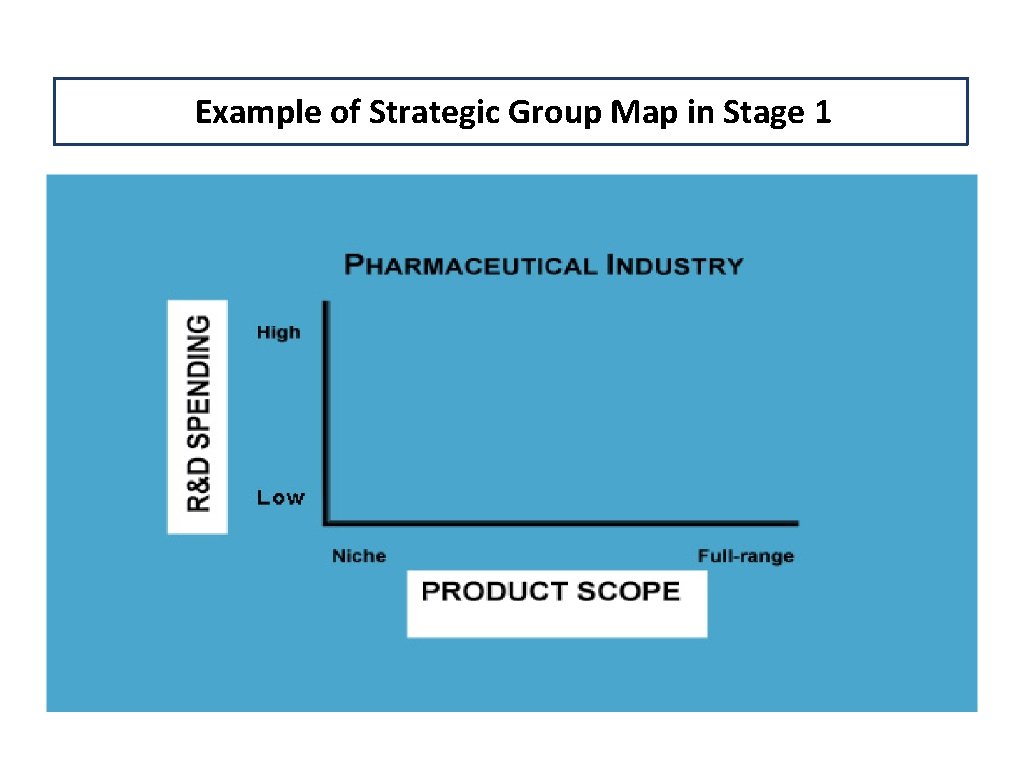
Example of Strategic Group Map in Stage 1
Luxury Goods Market Hermes 10 Quality Level Loro Chanel Piana Tiffany Burberry Louis Vuitton Gucci 1 $350 $500 Price Point $1500
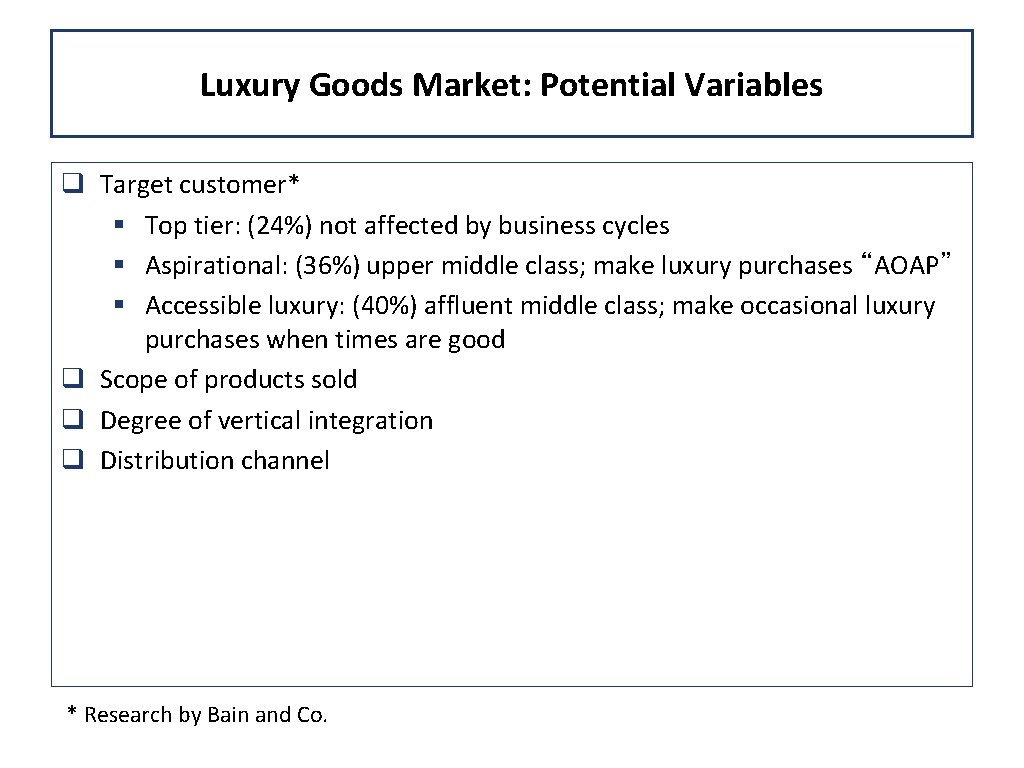
Luxury Goods Market: Potential Variables q Target customer* § Top tier: (24%) not affected by business cycles § Aspirational: (36%) upper middle class; make luxury purchases “AOAP” § Accessible luxury: (40%) affluent middle class; make occasional luxury purchases when times are good q Scope of products sold q Degree of vertical integration q Distribution channel * Research by Bain and Co.
Interpreting the Map q Fiercest rivalry occurs within strategic groups q The closer the clusters, the stronger the rivalry q Firms attempt moves into different segments as industry conditions change q Mobility barriers: group-specific entry barriers that restrict movement across groups q Identify mobility barriers