Comparison of Precision Analysis of Variance ANOVA Variance
")


 degree of freedom for SSF :")
- Slides: 8
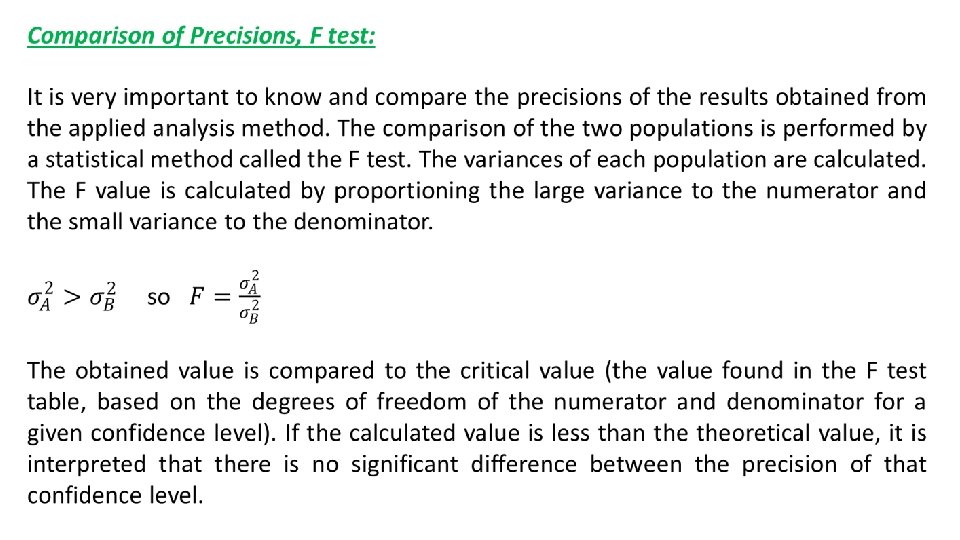
Comparison of Precision, Analysis of Variance (ANOVA)
Variance Analysis The comparison of means from the binary population was performed by applying t-test as previously described. The t-test is no longer performed when the number of populations increases, ie when there are 3 or more. Instead, multiple variance analysis, known as ANOVA, is used for analysis of variance. Typical examples of ANOVA testing are as follows: Whethere is a difference between the means of the analysis found by 5 different analysts from the sample, Whethere is a difference between the analysis results obtained at four different temperatures, Whethere is a difference between the results obtained by 3 different analysis methods of the sample, Whethere is a difference between the results obtained at different p. H 4.
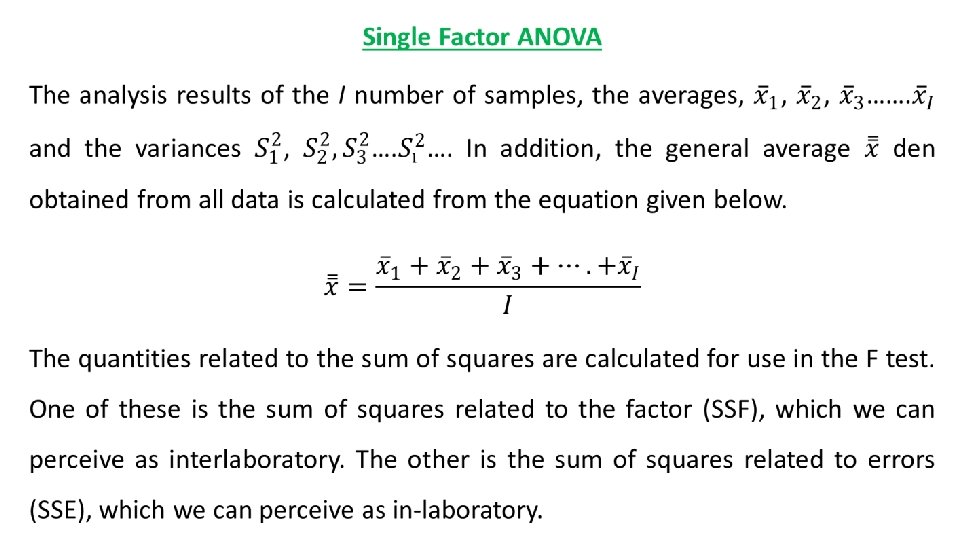
The differences in the elements compared are called factors or applications. In the first example, the analyzer is the temperature in the second, the method in the third, and the p. H in the fourth. The averages obtained separately from the factor of interest indicate the level. For example, in the first example, the factor is the analyzer. Since there are 5 analysts, it is called 5 levels. In the ANOVA test, factor levels are often referred to as groups. In this lesson, we will focus on single factor ANOVA.
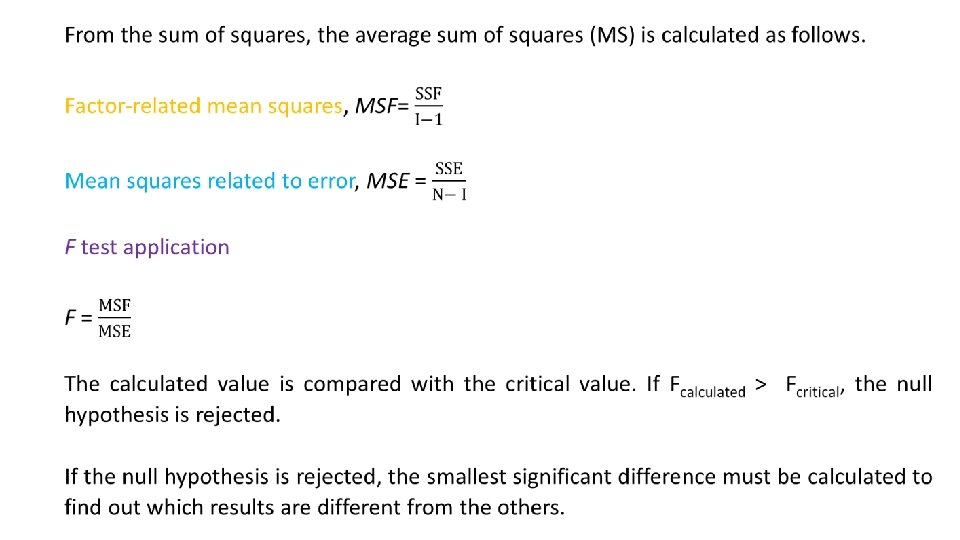
degree of freedom for SST : (N-1) degree of freedom for SSF : (N-I) degree of freedom for SSE : (I - 1)