
Comparison of Heat Exchanger Types Shannon Murphy Conor
- Slides: 1
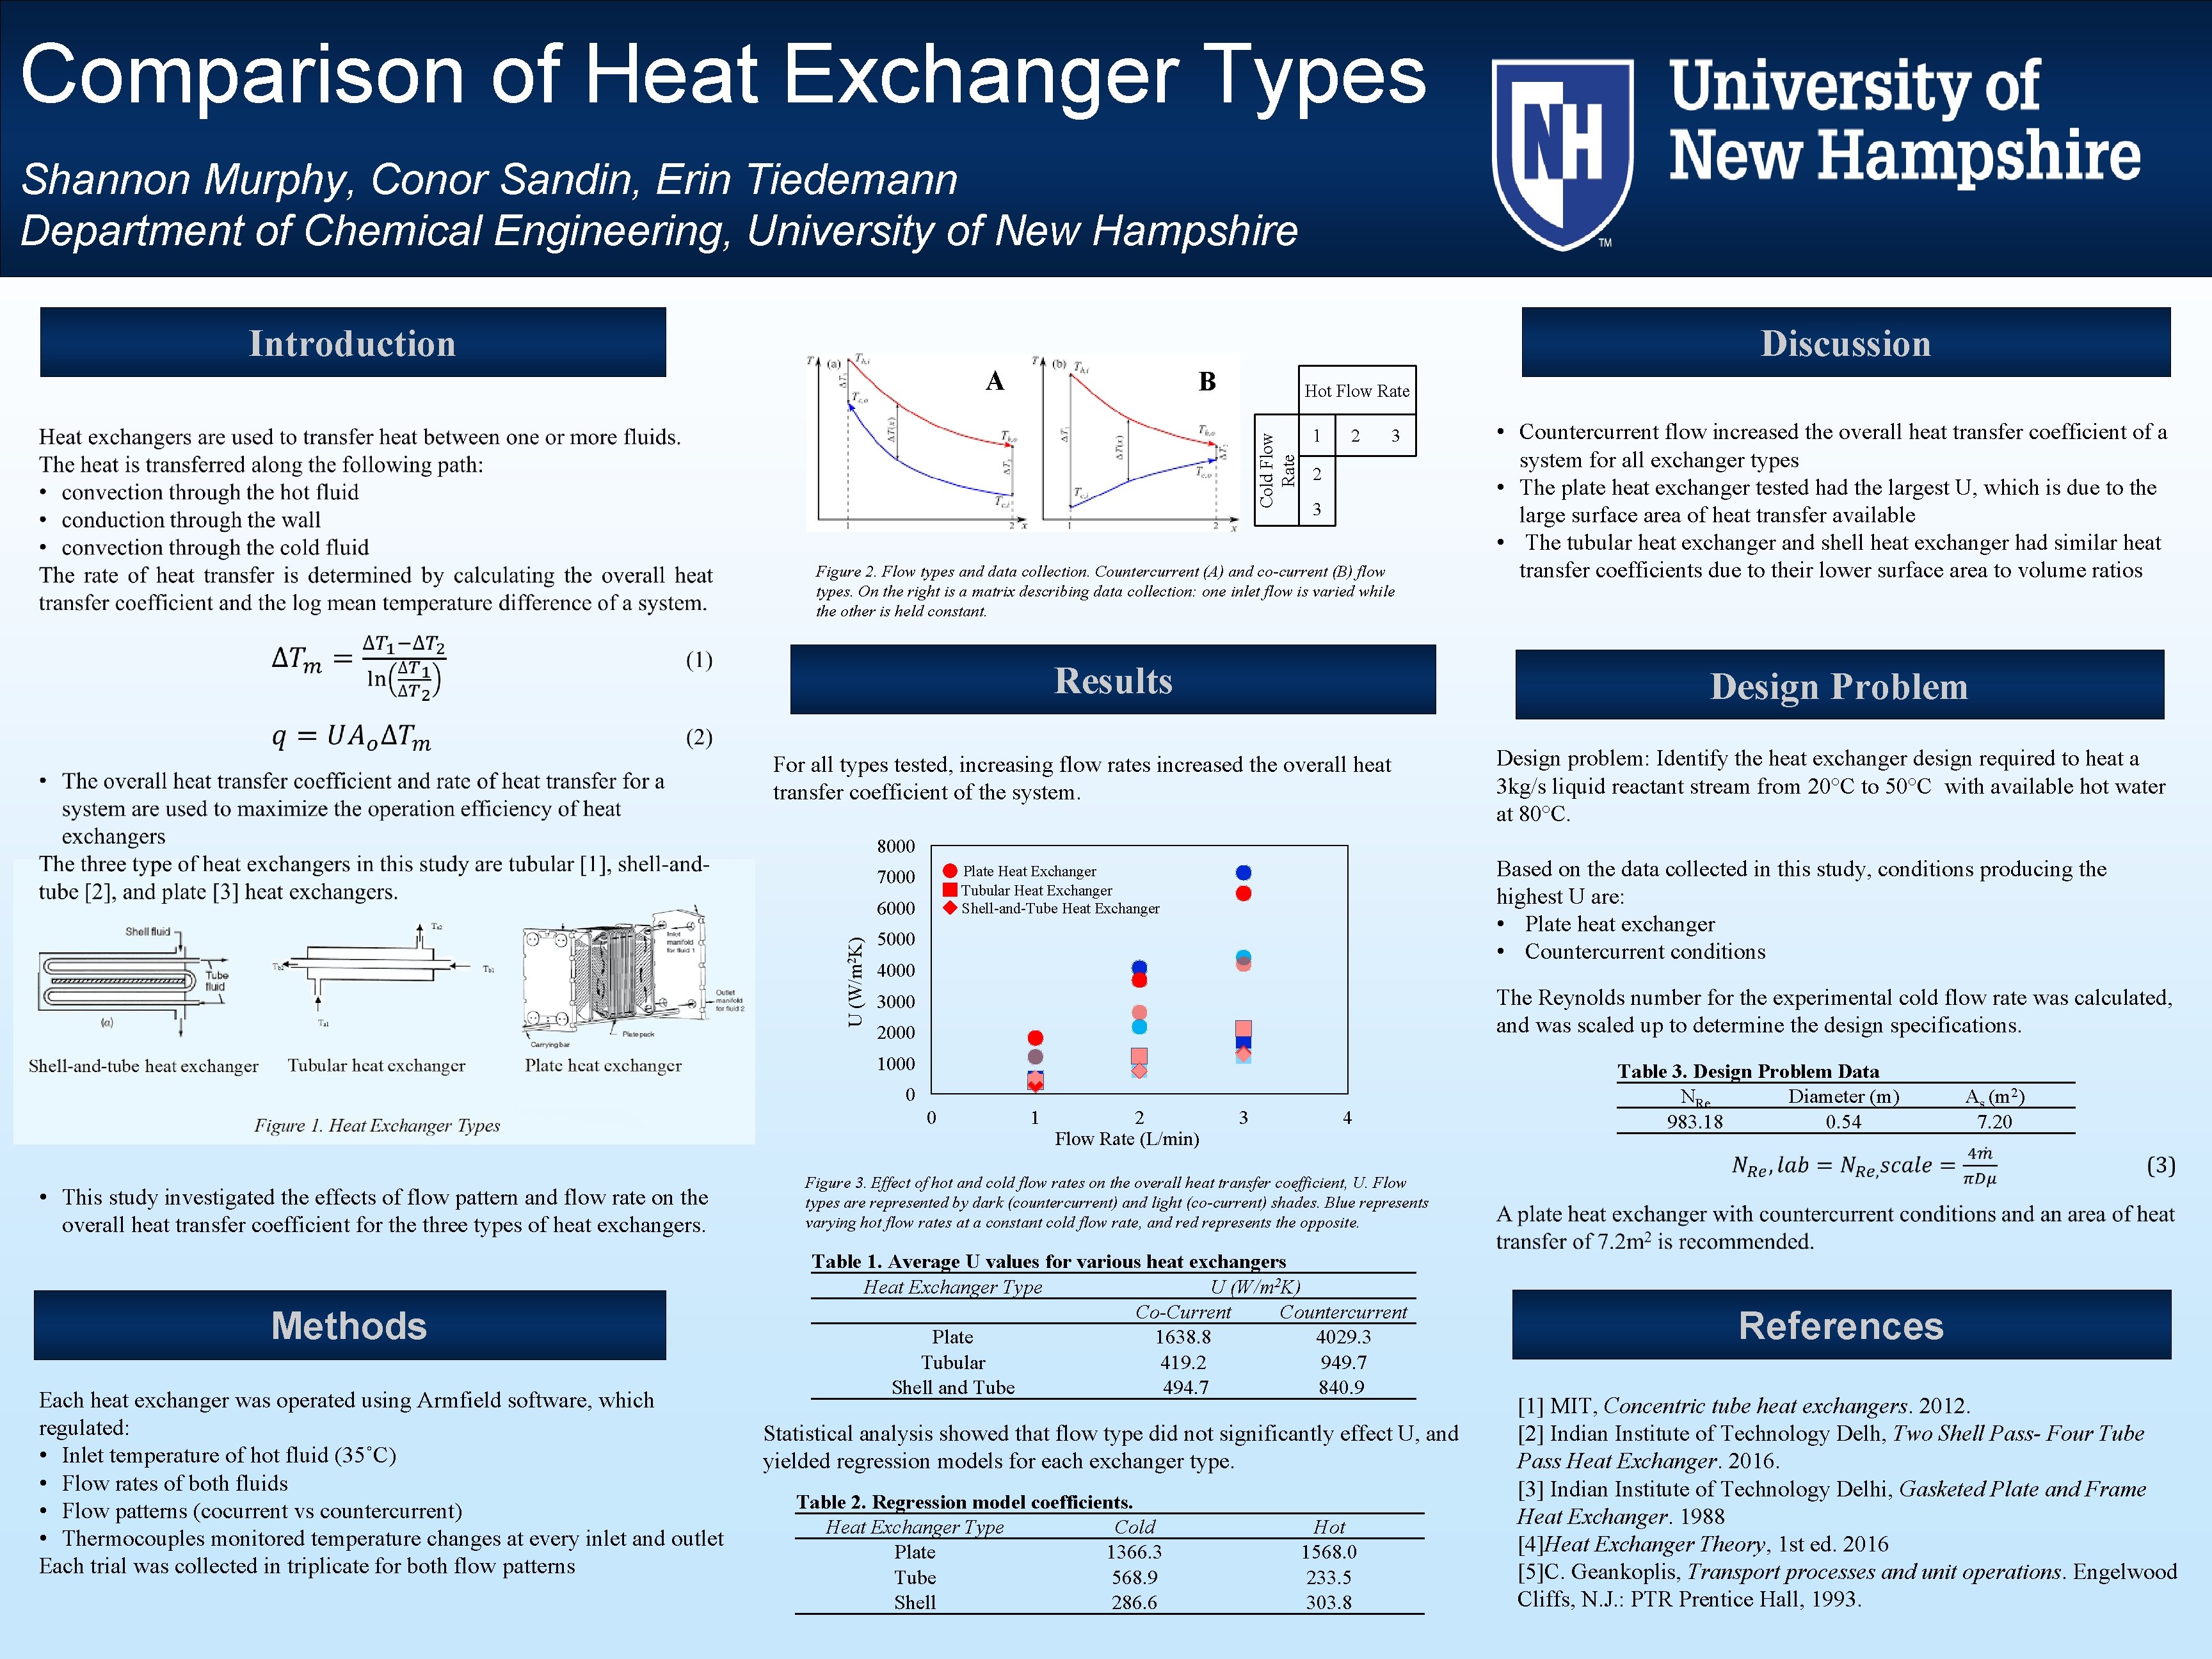
Comparison of Heat Exchanger Types Shannon Murphy, Conor Sandin, Erin Tiedemann Department of Chemical Engineering, University of New Hampshire Introduction Discussion A B Hot Flow Rate Cold Flow Rate 1 2 3 Figure 2. Flow types and data collection. Countercurrent (A) and co-current (B) flow types. On the right is a matrix describing data collection: one inlet flow is varied while the other is held constant. Results Design Problem For all types tested, increasing flow rates increased the overall heat transfer coefficient of the system. 8000 U (W/m 2 K) 6000 5000 4000 The Reynolds number for the experimental cold flow rate was calculated, and was scaled up to determine the design specifications. 3000 2000 1000 0 0 • This study investigated the effects of flow pattern and flow rate on the overall heat transfer coefficient for the three types of heat exchangers. Methods Each heat exchanger was operated using Armfield software, which regulated: • Inlet temperature of hot fluid (35˚C) • Flow rates of both fluids • Flow patterns (cocurrent vs countercurrent) • Thermocouples monitored temperature changes at every inlet and outlet Each trial was collected in triplicate for both flow patterns Design problem: Identify the heat exchanger design required to heat a 3 kg/s liquid reactant stream from 20°C to 50°C with available hot water at 80°C. Based on the data collected in this study, conditions producing the highest U are: • Plate heat exchanger • Countercurrent conditions Plate Heat Exchanger Tubular Heat Exchanger Shell-and-Tube Heat Exchanger 7000 • Countercurrent flow increased the overall heat transfer coefficient of a system for all exchanger types • The plate heat exchanger tested had the largest U, which is due to the large surface area of heat transfer available • The tubular heat exchanger and shell heat exchanger had similar heat transfer coefficients due to their lower surface area to volume ratios 1 2 Flow Rate (L/min) 3 4 Table 3. Design Problem Data NRe Diameter (m) 983. 18 0. 54 As (m 2) 7. 20 Figure 3. Effect of hot and cold flow rates on the overall heat transfer coefficient, U. Flow types are represented by dark (countercurrent) and light (co-current) shades. Blue represents varying hot flow rates at a constant cold flow rate, and represents the opposite. Table 1. Average U values for various heat exchangers Heat Exchanger Type U (W/m 2 K) Co-Current Countercurrent Plate 1638. 8 4029. 3 Tubular 419. 2 949. 7 Shell and Tube 494. 7 840. 9 Statistical analysis showed that flow type did not significantly effect U, and yielded regression models for each exchanger type. Table 2. Regression model coefficients. Heat Exchanger Type Cold Plate 1366. 3 Tube 568. 9 Shell 286. 6 Hot 1568. 0 233. 5 303. 8 References [1] MIT, Concentric tube heat exchangers. 2012. [2] Indian Institute of Technology Delh, Two Shell Pass- Four Tube Pass Heat Exchanger. 2016. [3] Indian Institute of Technology Delhi, Gasketed Plate and Frame Heat Exchanger. 1988 [4]Heat Exchanger Theory, 1 st ed. 2016 [5]C. Geankoplis, Transport processes and unit operations. Engelwood Cliffs, N. J. : PTR Prentice Hall, 1993.